Tunneling nanotube formation is stimulated by hypoxia in ovarian cancer cells
- PMID: 27223082
- PMCID: PMC5190014
- DOI: 10.18632/oncotarget.9504
Tunneling nanotube formation is stimulated by hypoxia in ovarian cancer cells
Abstract
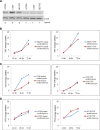
In this study, we demonstrated that hypoxic conditions stimulated an increase in tunneling nanotube (TNT) formation in chemoresistant ovarian cancer cells (SKOV3, C200).We found that suppressing the mTOR pathway using either everolimus or metformin led to suppression of TNT formation in vitro, verifying TNTs as a potential target for cancer-directed therapy. Additionally, TNT formation was detected in co-cultures including between platinum-resistant SKOV3 cells, between SKOV3 cells and platinum-chemosensitive A2780 cells, and between SKOV3 cells cultured with benign ovarian epithelial (IOSE) cells; these findings indicate that TNTs are novel conduits for malignant cell interactions and tumor cell interactions with other cells in the microenvironment. When chemoresistant C200 and parent chemosensitive A2780 cells were co-cultured, chemoresistant cells displayed a higher likelihood of TNT formation to each other than to chemosensitive malignant or benign epithelial cells. Hypoxia-induced TNT formation represents a potential mechanism for intercellular communication in ovarian cancer and other forms of invasive refractory cancers.
Keywords: chemoresistance; hypoxia; intercellular communication; mTOR; tunneling nanotubes.
Conflict of interest statement
The authors have no conflicts of interest to declare.
Figures


Similar articles
-
Tumor-stromal cross talk: direct cell-to-cell transfer of oncogenic microRNAs via tunneling nanotubes.Transl Res. 2014 Nov;164(5):359-65. doi: 10.1016/j.trsl.2014.05.011. Epub 2014 May 24. Transl Res. 2014. PMID: 24929208 Free PMC article.
-
The PI3K/AKT/mTOR pathway is a potential predictor of distinct invasive and migratory capacities in human ovarian cancer cell lines.Oncotarget. 2015 Sep 22;6(28):25520-32. doi: 10.18632/oncotarget.4550. Oncotarget. 2015. PMID: 26267321 Free PMC article.
-
Tumor exosomes induce tunneling nanotubes in lipid raft-enriched regions of human mesothelioma cells.Exp Cell Res. 2014 Apr 15;323(1):178-188. doi: 10.1016/j.yexcr.2014.01.014. Epub 2014 Jan 24. Exp Cell Res. 2014. PMID: 24468420 Free PMC article.
-
A Ticket to Ride: The Implications of Direct Intercellular Communication via Tunneling Nanotubes in Peritoneal and Other Invasive Malignancies.Front Oncol. 2020 Nov 26;10:559548. doi: 10.3389/fonc.2020.559548. eCollection 2020. Front Oncol. 2020. PMID: 33324545 Free PMC article. Review.
-
Wiring through tunneling nanotubes--from electrical signals to organelle transfer.J Cell Sci. 2012 Mar 1;125(Pt 5):1089-98. doi: 10.1242/jcs.083279. Epub 2012 Mar 7. J Cell Sci. 2012. PMID: 22399801 Review.
Cited by
-
ELAVL1 Role in Cell Fusion and Tunneling Membrane Nanotube Formations with Implication to Treat Glioma Heterogeneity.Cancers (Basel). 2020 Oct 21;12(10):3069. doi: 10.3390/cancers12103069. Cancers (Basel). 2020. PMID: 33096700 Free PMC article. Review.
-
Pre-Clinical Drug Testing in 2D and 3D Human In Vitro Models of Glioblastoma Incorporating Non-Neoplastic Astrocytes: Tunneling Nano Tubules and Mitochondrial Transfer Modulates Cell Behavior and Therapeutic Respons.Int J Mol Sci. 2019 Nov 29;20(23):6017. doi: 10.3390/ijms20236017. Int J Mol Sci. 2019. PMID: 31795330 Free PMC article.
-
Perspectives of cellular communication through tunneling nanotubes in cancer cells and the connection to radiation effects.Radiat Oncol. 2019 Dec 3;14(1):218. doi: 10.1186/s13014-019-1416-8. Radiat Oncol. 2019. PMID: 31796110 Free PMC article. Review.
-
Specialized Intercellular Communications via Tunnelling Nanotubes in Acute and Chronic Leukemia.Cancers (Basel). 2022 Jan 28;14(3):659. doi: 10.3390/cancers14030659. Cancers (Basel). 2022. PMID: 35158927 Free PMC article. Review.
-
A transwell assay that excludes exosomes for assessment of tunneling nanotube-mediated intercellular communication.Cell Commun Signal. 2017 Nov 13;15(1):46. doi: 10.1186/s12964-017-0201-2. Cell Commun Signal. 2017. PMID: 29132390 Free PMC article.
References
-
- Siegel R, Ma J, Zou Z, Jemal A. Cancer statistics, 2014. CA Cancer J Clin. 2014;64:9–29. - PubMed
-
- Rauh-Hain JA, Nitschmann CC, Worley MJ, Bradford LS, Berkowitz RS, Schorge JO, Campos SM, del Carmen MG, Horowitz NS. Platinum resistance after neoadjuvant chemotherapy compared to primary surgery in patients with advanced epithelial ovarian carcinoma. Gynecol Oncol. 2013;129:63–68. - PubMed
-
- Frankfurt OS, Seckinger D, Sugarbaker EV. Intercellular transfer of drug resistance. Cancer Res. 1991;51:1190–1195. - PubMed
-
- Zhang FF, Zhu YF, Zhao QN, Yang DT, Dong YP, Jiang L, Xing WX, Li XY, Xing H, Shi M, Chen Y, Bruce IC, Jin J, et al. Microvesicles mediate transfer of P-glycoprotein to paclitaxel-sensitive A2780 human ovarian cancer cells, conferring paclitaxel-resistance. European Journal of Pharmacology. 2014;738:83–90. - PubMed
-
- Tang K, Zhang Y, Zhang HF, Xu PW, Liu J, Ma JW, Lv M, Li DP, Katirai F, Shen GX, Zhang GM, Feng ZH, Ye DY, et al. Delivery of chemotherapeutic drugs in tumour cell-derived microparticles. Nat Commun. 2012:3. - PubMed
MeSH terms
Substances
Grants and funding
LinkOut - more resources
Full Text Sources
Other Literature Sources
Medical
Miscellaneous

