. 2016 Jul 21;128(3):427-39.
doi: 10.1182/blood-2015-12-684142. Epub 2016 May 24.

Peri-alloHCT IL-33 administration expands recipient T-regulatory cells that protect mice against acute GVHD

Affiliations

Peri-alloHCT IL-33 administration expands recipient T-regulatory cells that protect mice against acute GVHD

Benjamin M Matta et al. Blood. .

Abstract

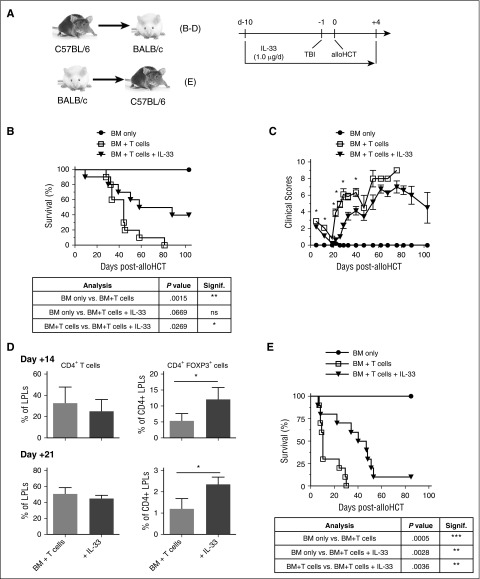
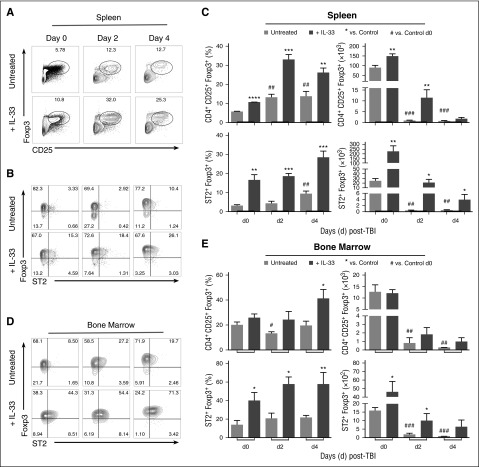
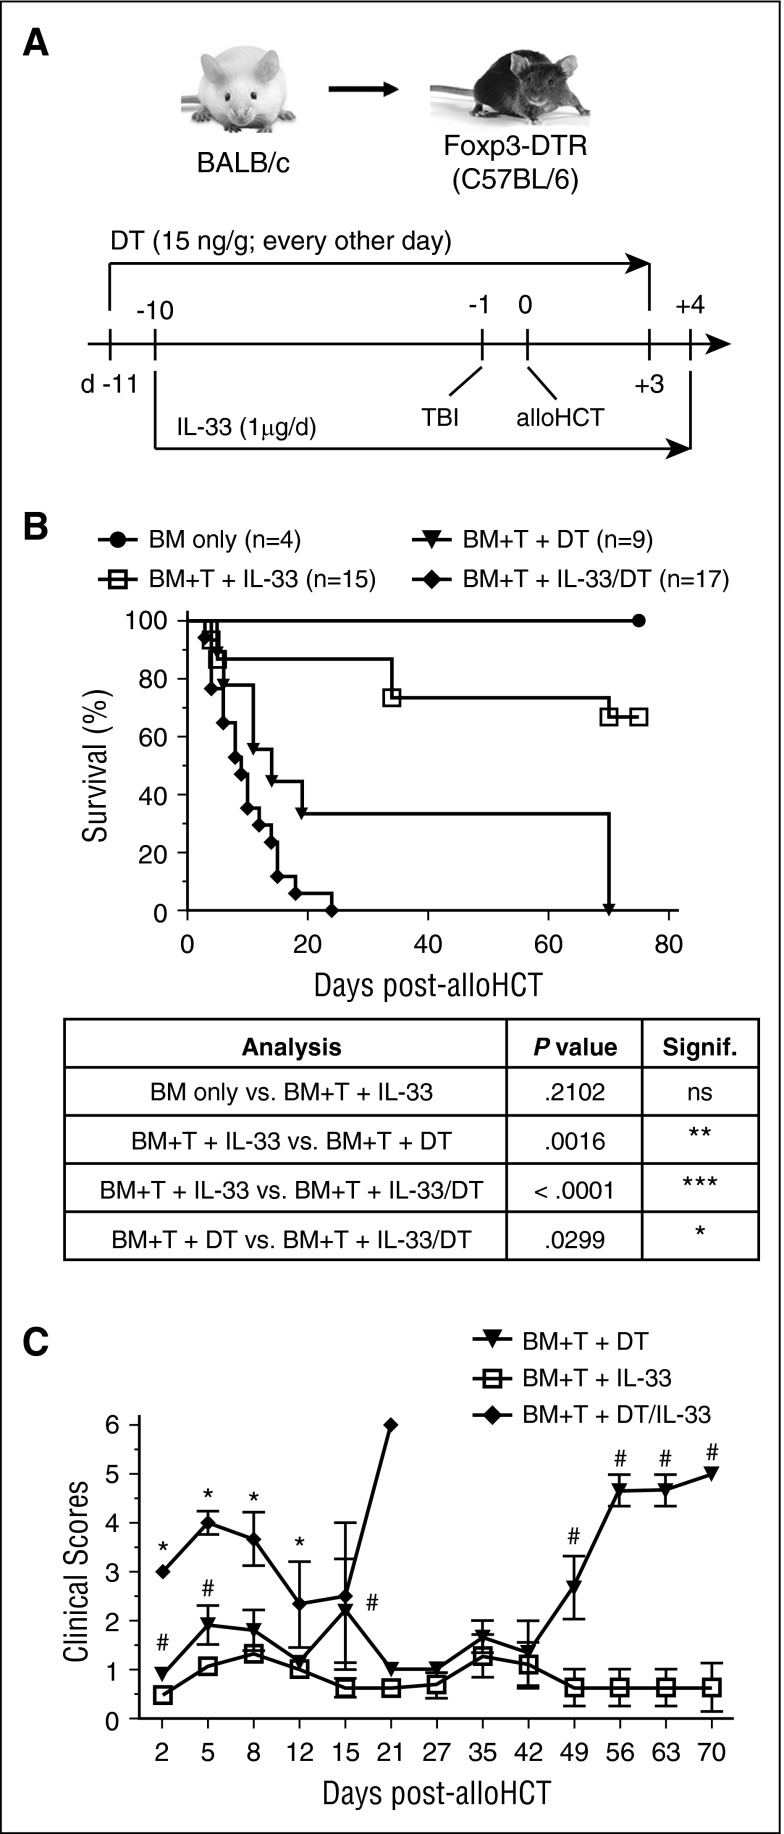
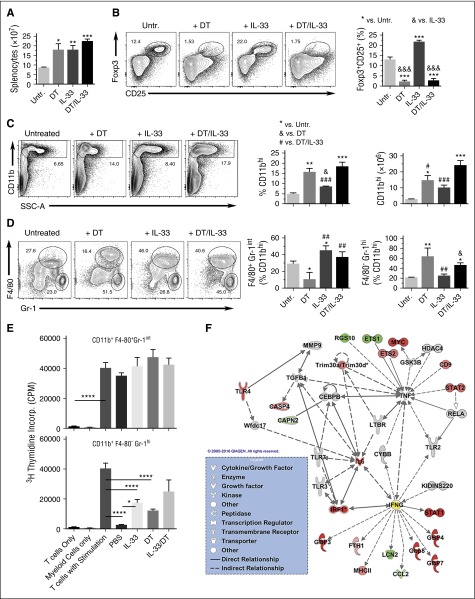
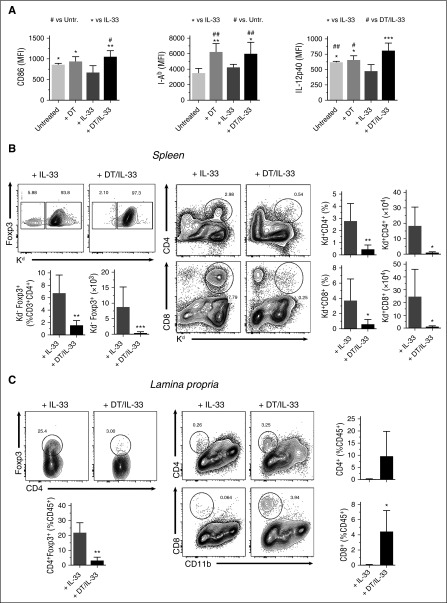
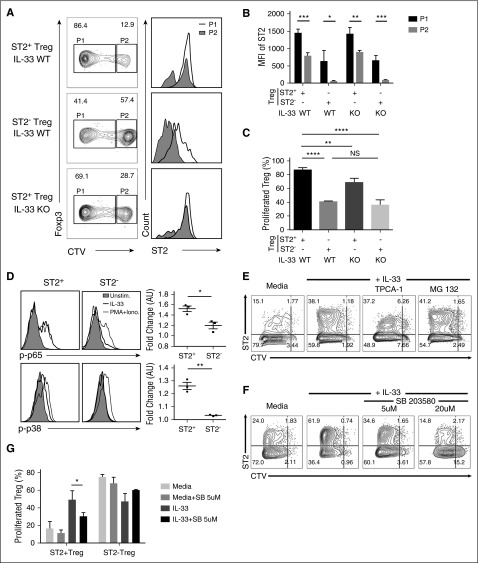
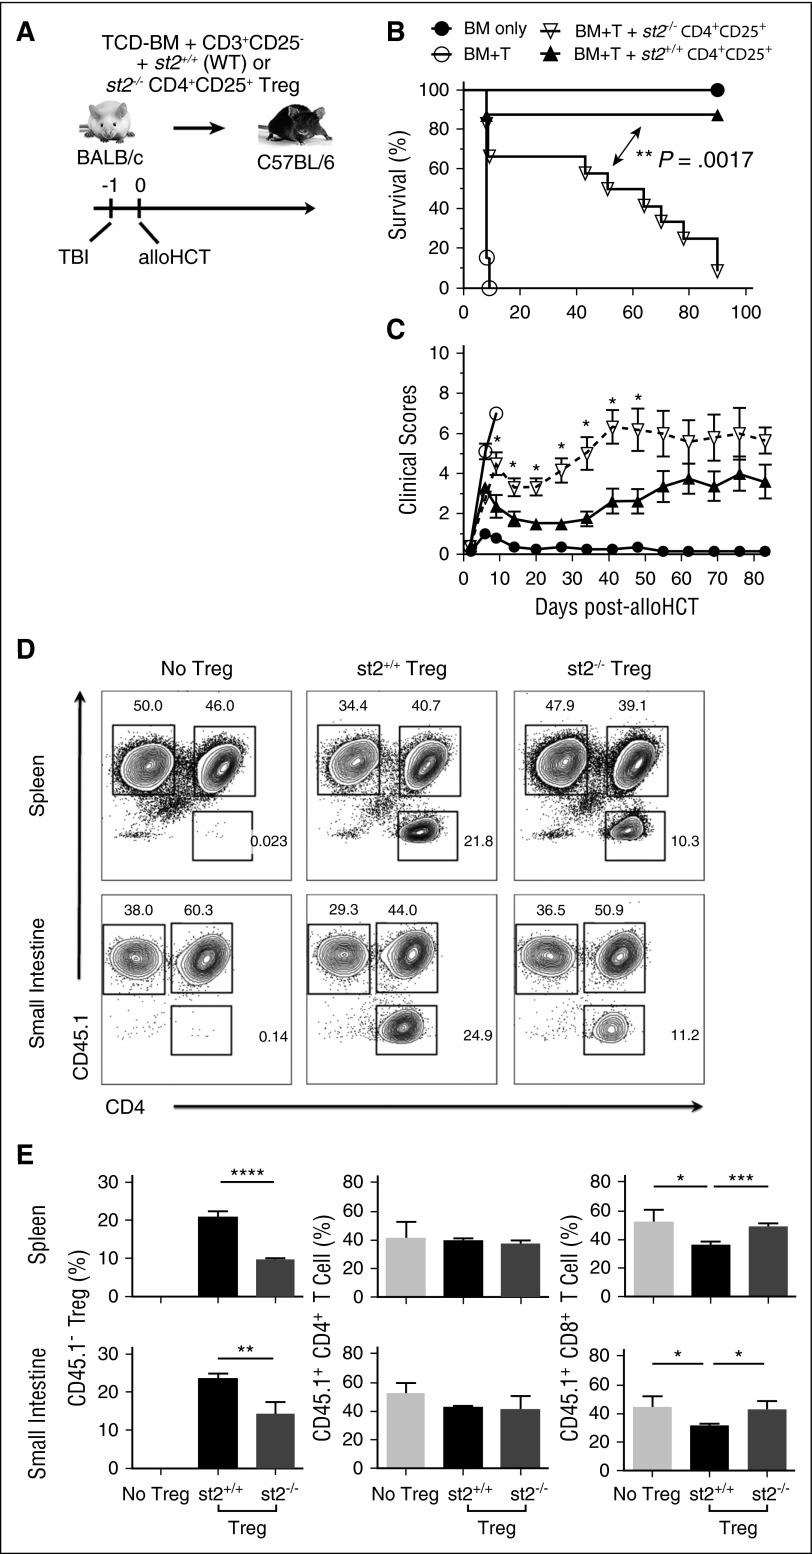
During allogeneic hematopoietic cell transplantation (alloHCT), nonhematopoietic cell interleukin-33 (IL-33) is augmented and released by recipient conditioning to promote type 1 alloimmunity and lethal acute graft-versus-host disease (GVHD). Yet, IL-33 is highly pleiotropic and exhibits potent immunoregulatory properties in the absence of coincident proinflammatory stimuli. We tested whether peri-alloHCT IL-33 delivery can protect against development of GVHD by augmenting IL-33-associated regulatory mechanisms. IL-33 administration augmented the frequency of regulatory T cells (Tregs) expressing the IL-33 receptor, suppression of tumorigenicity-2 (ST2), which persist following total body irradiation. ST2 expression is not exclusive to Tregs and IL-33 expands innate immune cells with regulatory or reparative properties. However, selective depletion of recipient Foxp3(+) cells concurrent with peri-alloHCT IL-33 administration accelerated acute GVHD lethality. IL-33-expanded Tregs protected recipients from GVHD by controlling macrophage activation and preventing accumulation of effector T cells in GVHD-target tissue. IL-33 stimulation of ST2 on Tregs activates p38 MAPK, which drives expansion of the ST2(+) Treg subset. Associated mechanistic studies revealed that proliferating Tregs exhibit IL-33-independent upregulation of ST2 and the adoptive transfer of st2(+) but not st2(-) Tregs mediated GVHD protection. In total, these data demonstrate the protective capacity of peri-alloHCT administration of IL-33 and IL-33-responsive Tregs in mouse models of acute GVHD. These findings provide strong support that the immunoregulatory relationship between IL-33 and Tregs can be harnessed therapeutically to prevent GVHD after alloHCT for treatment of malignancy or as a means for tolerance induction in solid organ transplantation.


Figures

Figure 1
Figure 1
IL-33 conditioning peri-alloHCT protects against acute GVHD. (A) Indicated combinations of WT mice were administered IL-33 (1.0 μg per mouse per day) starting on day −10 prior to alloHCT. On day −1, recipient mice received lethal TBI (B-D, 700 cGy to BALB/c recipients; E, 1100 cGy to B6 recipients) followed by 1 × 10⁷ WT allogeneic TCD-BM (B-D, B6; E, BALB/c) alone or with 2 × 10⁶ allogeneic pan T cells (B-D, B6; E, BALB/c) on day 0. IL-33 was continued through day +4 posttransplant. PBS vehicle-treated mice were used as BM + T only controls. (B,E) Survival curves with statistical significances calculated by log-rank (Mantel-Cox) test (*P < .05, **P < .01). For panels B-C, n = 4 (BM only), 10 (BM + T cells), and 10 (BM + T cells + IL-33) and the depicted experiment is representative of 2 independent experiments completed. For panel E, n = 5 (BM only), 10 (BM + T cells), and (10 BM + T cells + IL-33). (C) Group means with SEM are depicted for clinical GVHD scores. Significant differences for each point with ≥3 mice per group were calculated between BM + T cells vs BM + T cells + IL-33 using an unpaired Student t test (*P < .05). (D) Average frequency and standard deviation (SD) of indicated colon LPL population. Three to 4 mice per group with statistical significance calculated between groups using an unpaired Student t test (*P < .05). d, day; ns, not significant.
Figure 2
Figure 2
IL-33 and TBI expands ST2+ Tregs that persist through day 4 post-TBI. B6 mice were administered IL-33 (1.0 μg per mouse per day) or PBS (control) for 10 days and then exposed to lethal TBI (1100 cGy). Mice were sacrificed on day 2 or day 4 post-TBI, and nonirradiated mice were sacrificed on day 0. (A) Representative contour plots of CD3+CD4+-gated splenocytes showing Foxp3 vs CD25 expression from control (PBS) and IL-33–treated mice before and after TBI. (B) CD4+CD25+-gated splenocytes showing Foxp3 vs ST2 expression. (C) Summary graphs for the frequency (%) and cell number with SD the mean for the indicated populations. Average from n = 3-4 mice per group, and statistical significance was calculated between each group using an unpaired Student t test (*P < .05, **P < .01, ***P < .001); *IL-33–treated vs control at each time point; #significance for day 2 or day 4 control vs control day 0. Data are representative of at least 4 independent experiments. (D) CD4+CD25+-gated BM cells showing Foxp3 vs ST2 expression. (E) Summary graphs for the frequency (%) and cell number of indicated BM populations. Statistical significances were calculated as in panel C. Three to 4 mice per group and data are representative of 2 independent experiments.
Figure 3
Figure 3
Tregs mediate the GVHD-protective capacity of peri-alloHCT delivery of IL-33. (A) Foxp3-DTR B6 mice were administered 15 ng/g DT starting on day −11 (every other day) concurrently with daily IL-33 administration starting on day −10. On day −1, mice received lethal TBI (1100 cGy) followed by 1 × 10⁷ WT BALB/c TCD-BM alone or with 2 × 10⁶ BALB/c pan T cells on day 0. DT was continued through day +3 and IL-33 through day +4 posttransplant. (B) Resulting survival curves with statistical significances calculated by log-rank (Mantel-Cox) test (*P < .05, **P < .01, ***P < .001). (C) Recorded clinical scores are presented. Significant differences for each point with ≥3 mice were calculated between: (1) BM + T cells + IL-33 vs BM + T cells + DT/IL-33 (*P < .05) or (2) BM + T cells + DT vs BM + T cells + IL-33 (#P < .05) using an unpaired Student t test.
Figure 4
Figure 4
Tregs, including those expanded by IL-33, restrain the development of proinflammatory attributes by granulocytes and macrophages. Foxp3-DTR B6 mice were administered 15 ng/g DT on day −11 through day −1 (every other day) concurrently with IL-33 (day −10 through day −1). On day 0, spleens were harvested and splenocytes stained for multicolor flow cytometric analysis. (A) Assessed total splenocyte numbers for indicated groups (n = 3-4 mice per group): untreated (Untr.), DT only (DT), IL-33 only (IL-33), concurrent IL-33 and DT (DT/IL-33). (B) Representative contour plots and graphical analysis assessing Treg depletion during IL-33 treatment. Plots show Foxp3 vs CD25 expression on CD4+-gated cells. Graph presents the average frequency of CD25+Foxp3+ cells. (C) Representative flow plots and graphical analysis of CD11b+ cells in response to Treg depletion during IL-33 administration. (D) Representative flow plots and graphs showing F4/80 vs Gr-1 on CD11b+ cells. All graphs depict averages and SD from 3 to 4 mice per group and are representative of 2 independent experiments. Indicated significant differences were calculated using an unpaired Student t test (*P < .05, **P < .01, ***P < .01). (E) CD3CD11b+F4/80+Gr-1lo and CD3CD11b+ F4/80 Gr-1hi cells were flow sorted from the spleens of day 0 IL-33– or IL-33/DT-treated B6 Foxp3-DTR mice and assessed in an ex vivo suppression assay. Data represent the average and standard error of the mean (SEM) from 3 mice per group. Significant differences were calculated using an unpaired Student t test (*P < .05, **P < .01, ***P < .001, ****P < .0001). (F) Differential gene expression was also assessed by microarray between CD3CD11b+F4/80+Gr-1lo cell populations from day 0 IL-33– or IL-33/DT-treated B6 Foxp3-DTR mice (n = 3 mouse per group). Partek calculated fold change values and associated P and q values were assessed using Ingenuity Pathway Analysis (IPA) and identified IFNγ as an active upstream regulator in CD3CD11b+F4/80+Gr-1lo cells in the absence of Treg (z score, 2.137; P, 8.56E-06). The schematic is a graphical representation of the IFNγ signaling pathway in CD3CD11b+F4/80+Gr-1lo cells from IL-33–/DT- vs IL-33 only-treated mice. The level of upregulation is indicated by intensity of red color at that node. Gray nodes are part of network, but were not significantly modified between IL-33– or IL-33/DT-treated B6 Foxp3-DTR mice samples. Solid lines indicate direct relationships; dashed lines depict indirect relationships. Yellow color represents predicted upstream regulators. CPM, counts per minute; GSK, glycogen synthase kinase; LTBR, lymphotoxin β receptor; MMP, matrix metalloproteinase; SSC, side scatter; TLR, Toll-like receptor; TNF, tumor necrosis factor.
Figure 5
Figure 5
IL-33–expanded recipient Tregs are critical regulators of macrophage activation and accumulation of effector T cells in GVHD-target tissue. Foxp3-DTR B6 mice were administered 15 ng/g DT starting on day −11 (every other day) concurrently with daily IL-33 administration starting on day −10. On day −1, mice received lethal TBI (1100 cGy) followed by 1 × 10⁷ WT BALB/c TCD-BM alone or with 2 × 10⁶ BALB/c pan T cells on day 0. DT was continued through day +3 and IL-33 through day +4 posttransplant. On day 7 post-alloHCT, splenocytes and LPLs isolated from the SI were subjected to flow cytometry. (A) Flow cytometric analysis of CD11b+F4/80+-gated splenocytes presented as mean with SD for MFI of CD86, MHC class II/I-Ab, and IL-12p40 on F4/80+CD11b+ cells (n = 5 per group). (B-C) Flow cytometric and graphical analysis of spleen (B) and SI LPLs (C) on day 7 post-alloHCT from mice treated with IL-33 alone or in combination with DT. (B) Left panel, CD4+Foxp3+-gated cells. Right panel, CD3+-gated cells. Analysis of Foxp3+ Tregs and CD4 and CD8 effector T cells. Statistical significance between groups was calculated by Student t test. In panels B-C, *P < .05, **P < .01 for DT/IL-33 vs IL-33. MFI, mean fluorescence intensity.
Figure 6
Figure 6
IL-33 mediates p38 MAPK-dependent signaling to promote the expansion of proliferating Tregs expressing ST2. (A) Sorted ST2+ and ST2 CD4+ Foxp3(RFP)+Thy1.1+ cells from B6 OT-II FIR were labeled with CellTrace Violet (CTV), and infused into WT or il33−/− B6N mice that had been exposed to 1100 cGy 1 day prior. Recipient mice also received BM cells matched to recipient IL-33 status to create IL-33+ or IL-33 KO conditions. On day 5 posttransplant, splenocytes were isolated and CD90.1+ T cells assessed by flow cytometry for Foxp3 and ST2 expression, as well as proliferation (CTV dilution). Right flow plots, Proliferation and Foxp3 expression of the transferred CD90.1+ Tregs. Left panel, The ST2 expression on proliferating (P1) vs nonproliferating (P2) CD90.1+ cells. (B-C) Graphs present the average and SEM for (B) ST2 expression and (C) percentage proliferation (4 mice per group). Significant differences were calculated using unpaired Student t tests (*P < .05, **P < .01, ***P < .001, ****P < .0001). (D) CD4+Foxp3(RFP)+ Tregs were flow-sorted based on ST2 expression from B6 FIR mice and treated with IL-33 (100 ng/mL; bolded line) or (phorbol myristate acetate [PMA]/ionomycin; thin line) for 4 minutes before assessment for phospho-p38 or phospho-NF-κB p65 by flow cytometry. Representative histograms are presented. Unstimulated cells (filled histogram) served as a negative control. Graphs depict average calculated fold change in MFI of phospho-p38 or phospho-NF-κB p65 between IL-33–treated and untreated samples from 3 independent experiments. Statistical significance between groups calculated using the Student t test (*P < .05, **P < .01). (C) Bulk CD4+ T cells cultured with BALB/c CD11c+ BMDCs in media, stimulated with IL-33 alone, or IL-33 in combination with (E) the NF-κB inhibitors TPCA-1 or MG 132 or (F) the p38 MAPK inhibitor SB 203580. Flow plots depict ST2 expression vs CTV on CD3+CD4+Foxp3+-gated cells. (G) Average of results from 3 independent experiments represented in panel F. Statistical significance between groups calculated using the Student t test (*P < .05, **P < .01). AU, arbitrary unit.
Figure 7
Figure 7
The IL-33–ST2 axis supports adoptively transferred Tregs and promotes their GVHD-protective capacity. (A) On day −1, WT B6 mice received lethal TBI (1100 cGy) followed by 1 × 10⁷ WT BALB/c TCD-BM alone (n = 9) or with 4 × 10⁶ BALB/c T cells (CD25-depleted) alone (BM+T; n = 13) or with 2 × 10⁶ CD4+CD25+ Tregs from WT (st2+/+; n = 8) or st2−/− (n = 12) BALB/c mice on day 0. Effective Treg-to-T-effector ratio was 1:2. (B) Survival is depicted with significant differences calculated using the log-rank (Mantel-Cox) test. (C) Clinical scores were also monitored and statistical differences determined between st2−/− Tregs vs st2+/+ groups as in Figures 1 and 3. (D-E) B6 recipients irradiated as above received CD4+CD25+ T cells from st2+/+ or st2−/− BALB/c mice, as well as Thy1.1+ BALB/c TCD-BM, and CD25-depleted CD45.1+CD3+ T cells. (D) Representative flow plots depict CD45.1 and CD4 expression on Kd+Thy1.1CD3+-gated splenocytes (top panels) or SI LPLs (bottom panels) at day 5 post-alloHCT. Full gating strategy is shown in supplemental Figure 7B. (E) Averages and SD are shown for the frequency of the indicated T-cell population in the spleen (top graphs) or SI LPLs (bottom graphs). Four mice per group and these data are representative of 2 independent experimental repeats. Statistical differences between groups were calculated using an unpaired Student t test (*P < .05, **P < .01, ***P < .001, ****P < .0001).

Similar articles

Cited by

References

    1. Liew FY, Pitman NI, McInnes IB. Disease-associated functions of IL-33: the new kid in the IL-1 family. Nat Rev Immunol. 2010;10(2):103–110. - PubMed
    1. Cayrol C, Girard JP. IL-33: an alarmin cytokine with crucial roles in innate immunity, inflammation and allergy. Curr Opin Immunol. 2014;31:31–37. - PubMed
    1. Pichery M, Mirey E, Mercier P, et al. Endogenous IL-33 is highly expressed in mouse epithelial barrier tissues, lymphoid organs, brain, embryos, and inflamed tissues: in situ analysis using a novel Il-33-LacZ gene trap reporter strain. J Immunol. 2012;188(7):3488–3495. - PubMed
    1. Bonilla WV, Fröhlich A, Senn K, et al. The alarmin interleukin-33 drives protective antiviral CD8⁺ T cell responses. Science. 2012;335(6071):984–989. - PubMed
    1. Chen WY, Hong J, Gannon J, Kakkar R, Lee RT. Myocardial pressure overload induces systemic inflammation through endothelial cell IL-33. Proc Natl Acad Sci USA. 2015;112(23):7249–7254. - PMC - PubMed

MeSH terms