. 2016 Jul 1;126(7):2452-64.
doi: 10.1172/JCI82956. Epub 2016 May 23.

Transcription factor TLX1 controls retinoic acid signaling to ensure spleen development

Transcription factor TLX1 controls retinoic acid signaling to ensure spleen development

Elisa Lenti et al. J Clin Invest. .

Abstract

The molecular mechanisms that underlie spleen development and congenital asplenia, a condition linked to increased risk of overwhelming infections, remain largely unknown. The transcription factor TLX1 controls cell fate specification and organ expansion during spleen development, and Tlx1 deletion causes asplenia in mice. Deregulation of TLX1 expression has recently been proposed in the pathogenesis of congenital asplenia in patients carrying mutations of the gene-encoding transcription factor SF-1. Herein, we have shown that TLX1-dependent regulation of retinoic acid (RA) metabolism is critical for spleen organogenesis. In a murine model, loss of Tlx1 during formation of the splenic anlage increased RA signaling by regulating several genes involved in RA metabolism. Uncontrolled RA activity resulted in premature differentiation of mesenchymal cells and reduced vasculogenesis of the splenic primordium. Pharmacological inhibition of RA signaling in Tlx1-deficient animals partially rescued the spleen defect. Finally, spleen growth was impaired in mice lacking either cytochrome P450 26B1 (Cyp26b1), which results in excess RA, or retinol dehydrogenase 10 (Rdh10), which results in RA deficiency. Together, these findings establish TLX1 as a critical regulator of RA metabolism and provide mechanistic insights into the molecular determinants of human congenital asplenia.


Figures

Figure 1
Figure 1. TLX1 controls RA signaling pathway.
(A) GSEA enrichment plots and heat maps of differentially expressed genes belonging to the RA pathway associated with loss of Tlx1. The bar-code plot indicates the position of the genes on the expression data rank-sorted by its association with Tlx1 mutants, with red and blue colors indicating over- and underexpression in the mRNA. Validation of RA-associated genes by qPCR was performed on Tlx1+/– and Tlx1–/– embryonic spleens. The means of triplicates ± SD are shown, *P < 0.05, **P < 0.01 (2-tailed Student’s t test). Data are representative of 1 of 2 different validation experiments with 8–10 pooled spleens for each genotype. (B) TLX1 peak annotation relative to the indicated genomic feature. TLX1 ChIP-seq was performed in the eSMC line, and peak call was generated by comparison with an unrelated ChIP-seq experiment using rabbit IgG as control. MEME motif prediction of DNA sequences enriched in TLX1 ChIP-seq. ChIP-qPCR analysis of TLX1 binding in eSMC line. Positive (R1, R3, and R5) and negative (R2, R4, and R6) binding regions are indicated relative to transcription start site (TSS). Data are normalized to amplification of the input chromatin. Data are representative of 1 of 3 independent experiments.
Figure 2
Figure 2. Tlx1 expression is excluded from the domains of RA signaling.
Transverse sections of RARE-LacZ embryos at E13.5 stained for LacZ to show RA signaling (A) and confocal images of E13.5 Tlx1+/– spleen sections to show TLX1 (β-GAL) (B). Scale bars: 50 μm and 25 μm. st, stomach; spm, splenic mesenchyme; m, mesothelium. Data are representative of 1 embryo of 5 embryos analyzed.
Figure 3
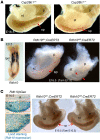
Figure 3. Spatiotemporal requirement of RA signaling during spleen development.
(A) Gross morphology of abdominal organs from Cyp26b1–/– and Cyp26b1+/+ embryos at E16.5. Data are representative of 1 embryo of 10 mutant and 8 control embryos analyzed from 4 different litters. (B) In situ hybridization for Rdh10 at E8.5 (left) and gross morphology of E16.5 abdominal organs from Rdh10fl/+;CreERT2 embryos injected with tamoxifen at E7.5 (right). Data are representative of 1 embryo of 6 mutant and 6 control embryos analyzed from different litters and time points for each genotype. (C) Expression of Rdh10 in the developing spleen as shown by LacZ staining of E14.5 spleens from Rdh10βGeo mice (left). Gross morphology of E15.5 abdominal organs from Rdh10fl/+;CreERT2 embryos injected with tamoxifen at E10.5 (right). Scale bars: 50 μm. Data are representative of 1 embryo of 15 mutant and 8 control embryos analyzed from 3 different litters. Dashed red lines indicate the developing spleen; red arrows indicate spleen normal situs. st, stomach; sp, spleen; p, pancreas; lpm, lateral plate mesoderm.
Figure 4
Figure 4. TLX1 controls RA activity.
(A) Western blot analysis of TLX1 protein in eSMCs upon shRNA silencing of Tlx1 (left). Anti-vinculin (Vcl) antibody is used as a loading control. Expression of Tlx1 and Cyp26b1 in sh-Ctrl and sh-Tlx1 eSMCs (right). Data are representative of 3 independent experiments. (B) Scheme of the coculture experiments with RARE-LacZ F9 reporter cells and sh-Ctrl or sh-Tlx1 eSMCs. Bright-field images of LacZ staining of F9-RARE-LacZ reporter cells cocultured for 48 hours with sh-Ctrl eSMCs (control), sh-Tlx1 eSMCs (silenced), or sh-Tlx1 eSMCs re-expressing Cyp26b1. Scale bars: 50 μm. Differences were measured by counting of the number of LacZ+ cells (in blue) over total cells. Data are representative of 1 of 3 independent experiments. (C) RARE-F9 cells transiently expressing Tlx1 or control vector were treated with RA and expression of indicated genes analyzed by qPCR 30 hours later. Data are representative of 1 of 3 independent experiments. (AC)The means of triplicates ± SD are shown, *P < 0.05 (B and C), **P < 0.01 (A and C) (2-tailed Student’s t test).
Figure 5
Figure 5. RA induces the expression of cell cycle inhibitors and growth arrest.
(A) Growth curve analysis of primary E13.5 spleen mesenchymal cells treated with RA or control vehicle (left). The means of triplicates ± SD are shown, *P < 0.05 (2-way ANOVA). Data are representative of 1 of 3 independent experiments. Expression of Cdkn2b/p15 in primary E13.5 spleen mesenchymal cells treated for 3 or 5 days with RA or control vehicle (middle). The means of triplicates ± SD are shown, **P < 0.01, ***P < 0.001 (2-tailed Student’s t test). Data are representative of 1 of 2 independent experiments. Heat map and validation of Cdkn2b/p15 expression by qPCR in E13.5 Tlx1+/– and Tlx1–/– spleens (right). The means of triplicates ± SD are shown, **P < 0.01 (2-tailed Student’s t test). Data are representative of 1 of 2 independent validation experiments. (B) Bright-field images of E13.5 explanted spleens cultured in the presence of RA or vehicle (DMSO). Arrows indicate mesenchymal cell sprouting. Quantification of the spleen size area (%) was calculated using ImageJ, as the ratio of spleen area at 24 hours versus 0 hours. The means of triplicates ± SD are shown, **P < 0.01 (2-tailed Student’s t test). Data are representative of 1 of 3 independent experiments with 8 explanted spleens for each condition.
Figure 6
Figure 6. Excessive RA due to loss of Tlx1 causes premature differentiation and reduced vasculogenesis.
(A) Heat map and validation of Desmin expression by qPCR in E13.5 Tlx1+/– and Tlx1–/– spleens (left). Confocal images of E13.5 spleen sagittal sections stained with anti-desmin antibody (green) (middle). Nuclei are visualized by DAPI staining (blue). Dashed red lines indicate the developing spleen. Data are representative of 1 embryo of 5 embryos analyzed for each genotype. Desmin expression by qPCR in primary E13.5 spleen mesenchymal cells after 48 hours of RA treatment (right). Data are representative of 1 of 2 independent experiments. (B) Expression of Vegf-a in primary E13.5 spleen mesenchymal cells treated for 48 hours with RA or control vehicle. Heat map and validation of Vegf-a expression by qPRCs in E13.5 Tlx1+/– and Tlx1–/– spleens. Data are representative of 1 of 2 independent experiments. IHC analysis on E13.5 Tlx1+/– and Tlx1–/– sagittal sections stained with anti–PECAM-1 antibody to reveal vascular networks and counterstained with hematoxylin to show nuclei. Microvessel density was calculated by counting of the number of PECAM-1+ vessels/μm2 in Tlx1+/– and Tlx1–/– embryonic spleen. Data are representative of 1 embryo of 5 embryos analyzed for each genotype. (C) Representative confocal images of E13.5 Tlx1+/– and Tlx1–/– spleen sagittal sections stained with anti–PECAM-1 antibody (red) to reveal endothelial cells and anti–β-gal antibody (green) to show TLX1-expressing cells in Tlx1-LacZ knock-in embryos. Nuclei are visualized by DAPI staining (blue). Data are representative of 1 embryo of 5 embryos analyzed for each genotype. (A and B) The means of triplicates ± SD are shown, *P < 0.05 (B), **P < 0.01 (A and B) (2-tailed Student’s t test). (AC) Scale bars: 50 μm. st, stomach; sp, spleen.
Figure 7
Figure 7. Inhibition of RA signaling partially rescues the spleen phenotype.
(A) Partial rescue of spleen morphogenesis in E14.5 Tlx1–/– embryonic spleens treated with BMS493 or control vehicle at E10.5. Number of unjoined splenules (outlined in white) and surface area measurements were normalized to littermate controls. Statistical significance in the number of unjoined splenules was calculated using χ2, *P < 0.05. For the surface area measurement, the means of triplicates ± SD are shown. NS, not significant (2-tailed Student’s t test). Data are from 15 (BMS493) and 14 (DMSO) treated embryonic spleens from 3 different litters. HOM, homozygous; HET, heterozygous. (B) Validation of Vegf-a, collagen 4a1 (Col4a1), laminin B1 (Lamb1), and Rarb expression by qPRCs in E14.5 Tlx1+/– and Tlx1–/– embryonic spleens treated with BMS493 or control vehicle. The means of triplicates ± SD are shown, *P < 0.05, **P < 0.01, ***P < 0.001 (2-tailed Student’s t test). Data are representative of a pool of 12–16 embryonic spleens for each group from 4 different experiments.
Figure 8
Figure 8. SF-1 controls Tlx1 and RA metabolism.
(A) Expression of Tlx1, Cyp26b1, and Vegf-a in E14.5 Sf-1+/+ and Sf-1–/– embryonic spleens. Data are representative of 1 of 2 independent experiments with 4 pooled spleens for each genotype. (B) Luciferase activity on a Cyp26b1 promoter reporter system was assessed at 48 hours in HEK293 cells transiently transfected with increasing concentrations of Sf-1 expression vector. Data are representative of 1 of 3 different experiments. (C) RARE-F9 cells transiently expressing Sf-1 or control vector were treated with RA and expression of indicated genes analyzed by qPCR 8 hours later. Data are representative of 1 of 3 independent experiments. (AC) The means of triplicates ± SD are shown, *P < 0.05 (A and C), **P < 0.01 (AC), ***P < 0.001 (B and C) (2-tailed Student’s t test).
Figure 9
Figure 9. Proposed model for SF-1 and TLX1 function during spleen development.
RA signaling starts at E13.5 and is confined in the outer mesothelial layer of the developing spleen, a domain negative for TLX1. On the contrary, SF-1 and TLX1 restrict RA signaling by promoting Cyp26b1 expression and RA degradation, and repression of RA nuclear receptors in the inner mesenchyme. In the absence of Sf-1 or Tlx1 the expression of Cyp26b1 is markedly reduced, thus causing increased RA content and activity. As a result, RA binds to nuclear receptors that activate RA-induced transcriptional programs. Under these conditions, RA signals in an autocrine (dashed arrows) and paracrine (solid arrows) fashion within the SPM, thus causing growth arrest due to premature cellular differentiation and reduced vasculogenesis. Thus, expression of SF-1 and TLX1 in the SPM is required to control RA signaling and ensure spleen development.

Similar articles

Cited by

References

    1. Ejstrud P, Kristensen B, Hansen JB, Madsen KM, Schonheyder HC, Sorensen HT. Risk and patterns of bacteraemia after splenectomy: a population-based study. Scand J Infect Dis. 2000;32(5):521–525. doi: 10.1080/003655400458811. - DOI - PubMed
    1. Bisharat N, Omari H, Lavi I, Raz R. Risk of infection and death among post-splenectomy patients. J Infect. 2001;43(3):182–186. doi: 10.1053/jinf.2001.0904. - DOI - PubMed
    1. Thomsen RW, et al. Risk for hospital contact with infection in patients with splenectomy: a population-based cohort study. Ann Intern Med. 2009;151(8):546–555. doi: 10.7326/0003-4819-151-8-200910200-00008. - DOI - PubMed
    1. Ram S, Lewis LA, Rice PA. Infections of people with complement deficiencies and patients who have undergone splenectomy. Clin Microbiol Rev. 2010;23(4):740–780. doi: 10.1128/CMR.00048-09. - DOI - PMC - PubMed
    1. Kristinsson SY, Gridley G, Hoover RN, Check D, Landgren O. Long-term risks after splenectomy among 8,149 cancer-free American veterans: a cohort study with up to 27 years follow-up. Haematologica. 2014;99(2):392–398. doi: 10.3324/haematol.2013.092460. - DOI - PMC - PubMed