. 2016 Jun;18(6):595-606.
doi: 10.1038/ncb3354. Epub 2016 May 16.

Medial HOXA genes demarcate haematopoietic stem cell fate during human development

Affiliations

Medial HOXA genes demarcate haematopoietic stem cell fate during human development

Diana R Dou et al. Nat Cell Biol. 2016 Jun.

Abstract

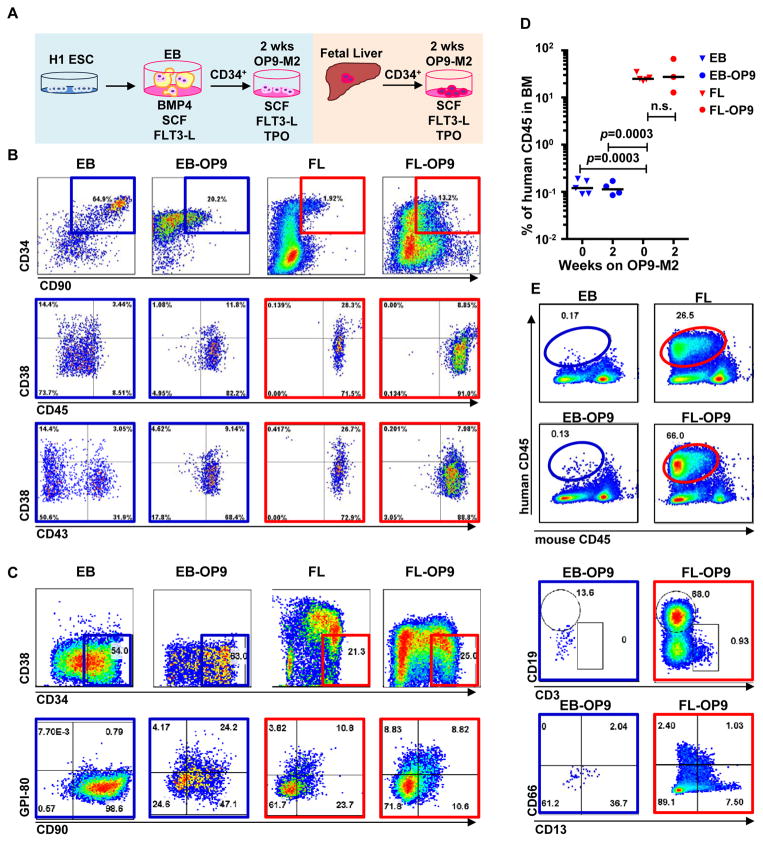
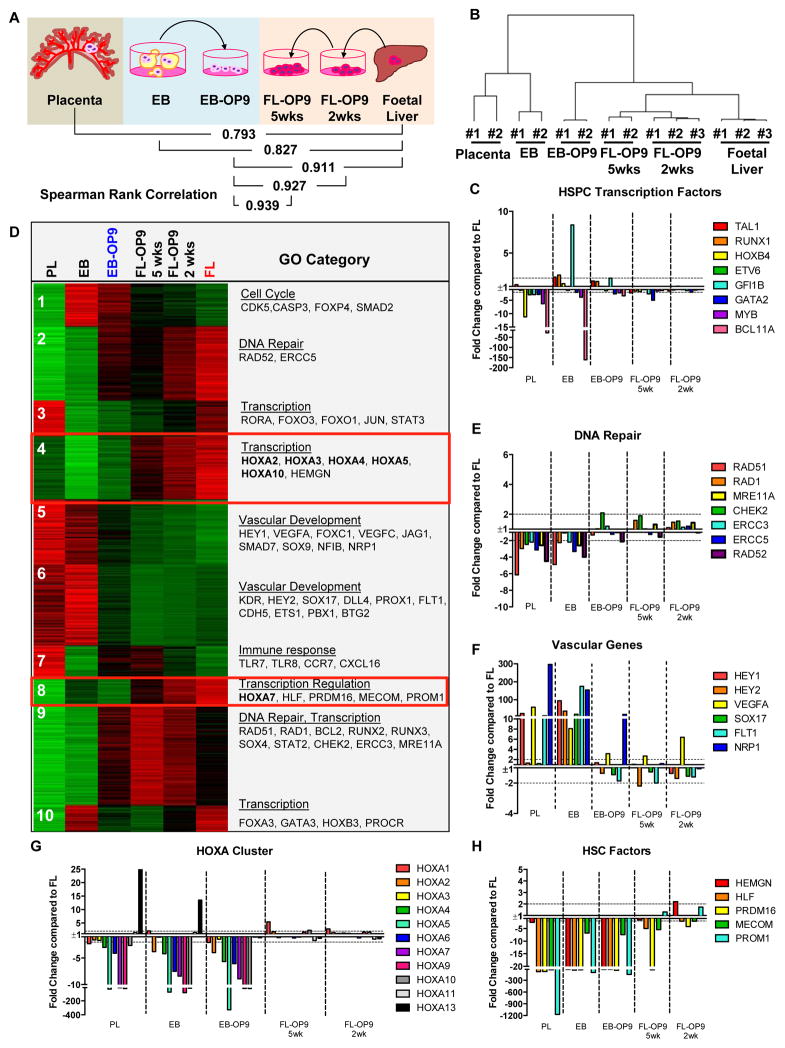
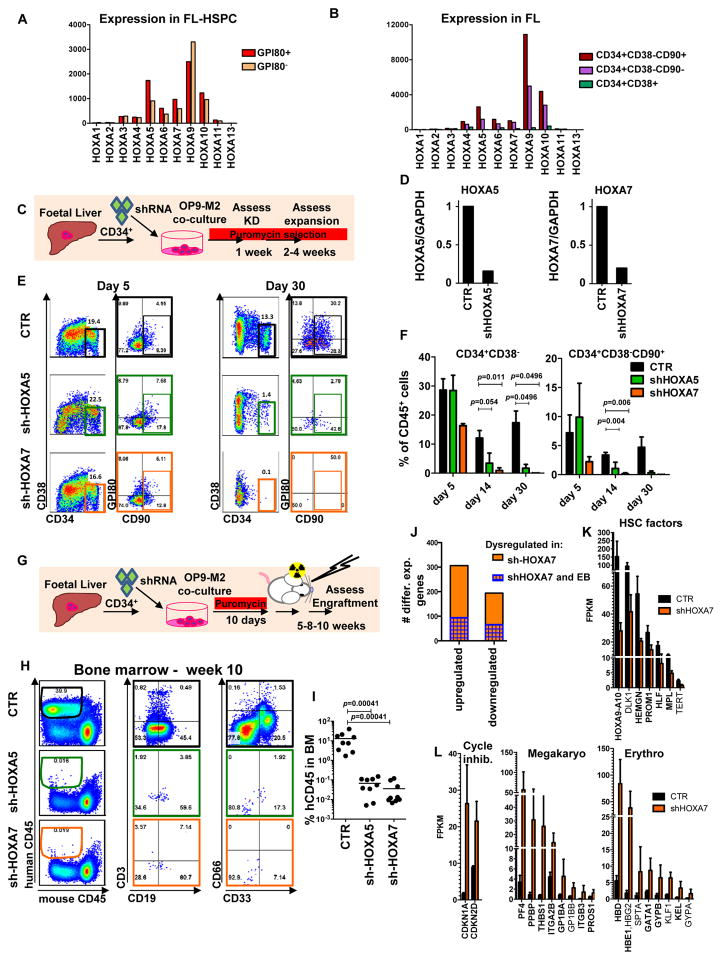
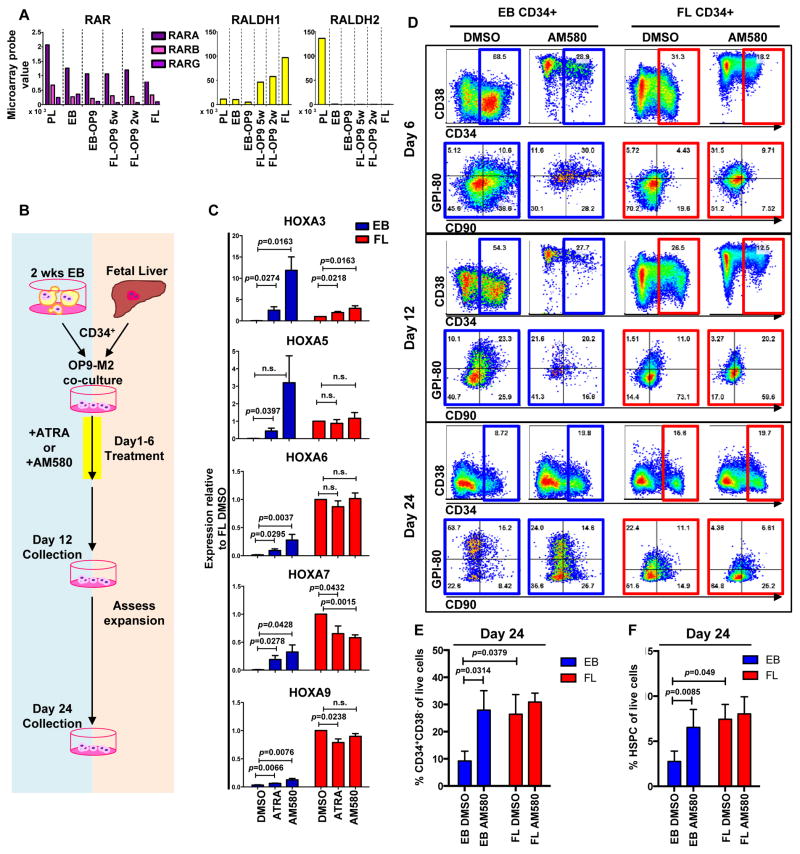
Pluripotent stem cells (PSCs) may provide a potential source of haematopoietic stem/progenitor cells (HSPCs) for transplantation; however, unknown molecular barriers prevent the self-renewal of PSC-HSPCs. Using two-step differentiation, human embryonic stem cells (hESCs) differentiated in vitro into multipotent haematopoietic cells that had the CD34(+)CD38(-/lo)CD90(+)CD45(+)GPI-80(+) fetal liver (FL) HSPC immunophenotype, but exhibited poor expansion potential and engraftment ability. Transcriptome analysis of immunophenotypic hESC-HSPCs revealed that, despite their molecular resemblance to FL-HSPCs, medial HOXA genes remained suppressed. Knockdown of HOXA7 disrupted FL-HSPC function and caused transcriptome dysregulation that resembled hESC-derived progenitors. Overexpression of medial HOXA genes prolonged FL-HSPC maintenance but was insufficient to confer self-renewal to hESC-HSPCs. Stimulation of retinoic acid signalling during endothelial-to-haematopoietic transition induced the HOXA cluster and other HSC/definitive haemogenic endothelium genes, and prolonged HSPC maintenance in culture. Thus, medial HOXA gene expression induced by retinoic acid signalling marks the establishment of the definitive HSPC fate and controls HSPC identity and function.


Conflict of interest statement

The authors declare no competing financial interests.

Figures

Figure 1
Figure 1. Two-step culture of hESCs generates immunophenotypic HSPCs that engraft poorly
(A) Culture and isolation strategy for differentiating H1 hESCs to HSPCs. (B) Representative FACS plots from 11 experiments staining for CD34, CD90, CD38, CD45 and CD43 on hESC-derived CD34+ cells isolated from 2 week EBs (EB), and after 2 week maturation culture on OP9-M2 (EB-OP9), compared to cells from second trimester foetal liver that were isolated directly (FL) or cultured on OP9-M2 (FL-OP9). (C) Representative FACS plots from 9 experiments staining for CD38, CD34, CD90 and human foetal HSC self-renewal marker GPI-80 on hESC- and FL-derived cells. (D) Human engraftment in NSG mice with hESC-derived and FL-derived CD34+ cells, before and after OP9-M2 co-culture (individual values and mean are shown, n=5 EB, n=4 EB-OP9 and FL, and n=3 FL-OP9 transplanted mice, statistical significance was calculated using the Wilcoxon Rank Sum test, see Supplementary Table 7 for statistics source data). (E) Representative FACS plots of showing human CD45+ fraction in the mouse BM 12 weeks post-transplantation. Multi-lineage engraftment is assessed by CD19 and CD3 (B-and T-lymphoid), and CD66 and CD13 (myeloid) stainings.
Figure 2
Figure 2. hESC-derived haematopoietic cells have limited proliferative potential in vitro
(A) Strategy for comparing the expansion of hESC- and FL-HSPCs. (B) FACS staining for HSPC surface markers CD34+, CD38−/lo, CD45+ and CD90+ at various time points in OP9-M2 co-culture. (C) Expansion of FL and hESC-derived haematopoietic cells sorted for HSPC phenotype after two-step differentiation, and cultured for additional weeks on OP9-M2 (mean +/- SEM – upward bars – from n=4 experiments, statistical significance was assessed using the Wilcoxon Rank Sum test. (D) CFU-C expansions from 10,000 hESC-derived or FL-derived immunophenotypic HSPCs in methylcellulose following 0, 1 and 3 additional weeks on OP9-M2 co-culture (mean +/- SEM – upward bars –from n=4 experiments, statistical significance was assessed using the Wilcoxon Rank Sum test. (E) The morphology of myelo-erythroid colonies generated from hESC- or FL-HSPCs on methylcellulose as assessed by light microscopy (green scale bar = 1mm) and May-Grünwald-Giemsa (MGG) staining (black scale bar = 100 μm). Statistics source data used to generate graphs in C and D can be found in Supplementary Table 7.
Figure 3
Figure 3. Identification of differentially expressed programs in hESC- and FL-HSPCs
(A) Spearman rank correlation of HSPCs isolated at different stages of development: 3–5 week placenta (PL, CD34+CD38−/lo CD90+CD43+ n=2), hESC-HSPCs isolated from 2 week EBs (EB, CD34+CD38−/loCD90+CD43+ n=2) or after two-step differentiation (EB-OP9, CD34+CD38−/lo CD90+CD43+CD45+ n=2), and 2nd trimester FL isolated freshly (FL, CD34+CD38−/lo CD90+CD45+ n=3) or after 2 or 5 weeks on OP9-M2 (FL-OP9, CD34+CD38−/loCD90+CD45) (n=3 and n=2, respectively). n represents number of tissue samples collected from separate specimens per condition. Each replicate was collected from independent experiments and analysed together. (B) Dendrogram showing hierarchical clustering of microarray samples. (C) Relative levels of haematopoietic transcription factors in different samples compared to FL-HSPCs. (D) K-means clustering of differentially expressed genes in HSPCs from different stages of human haematopoietic development with representative examples of GO terms and genes in clusters (see Supplementary Tables 2 and 3 and GEO database GSE64865). (E) Levels of DNA repair genes compared to FL-HSPCs from Clusters 2 and 9, (F) vascular genes from Clusters 5 and 6,. (G) HOXA genes and (H) other HSC factors from clusters 4 and 8. See Supplementary Tables 1 and 3, and GEO database GSE64865 for values.
Figure 4
Figure 4. Medial HOXA genes govern the function and identity of human foetal HSPCs
(A, B) Microarray analysis of HOXA gene expression in CD34+CD38−/lo CD90+GPI-80+ cells and their progeny (Mean values are shown, left, n=3 samples, GEO database GSE54316, and right, n=3 samples (CD34+CD38-CD90+) or 2 (CD34+CD38-CD90- and CD34+CD38-) GSE34974. (C) Schematic showing the strategy for lentiviral shRNA knockdown of HOXA5 or HOXA7 in FL-HSPCs. (D) Knockdown is confirmed using q-RT-PCR 1 week post-infection (mean +/- SD shown from n=3 different FL samples). (E) Representative FACS plots 30 days after HOXA5 or HOXA7 knockdown. (F) Quantification of HSPC subsets in empty-vector (CTR) and shRNA infected cells (shHOXA5 or shHOXA7) after 5, 14 and 30 days in culture (mean and SEM, n=6 independent experiments per condition for day 14 and n=3 for day 5 and 30). Statistical significance was assessed using Wilcoxon Signed Rank test. (G) Schematic showing the transplantation strategy with HOXA5 or HOXA7 knockdown FL-HSPCs. (H) Representative FACS plots from mouse BM 10 weeks post-transplantation assessing human CD45+ cells and multi-lineage engraftment (CD19 and CD3 for B-and T-lymphoid, and CD66 and CD33 for myeloid). (I) Quantification of human engraftment (n=9 mice per condition from 3 independent experiments Individual values and mean are shown.) Statistical significance was assessed using the Wilcoxon Rank Sum test (J) RNA-sequencing of HOXA7 knockdown FL-HSPCs at day 5 post-infection. Number of genes up- or down-regulated in shHOXA7 FL-HSPCs are shown. Genes dysregulated both in HOXA7 knockdown FL-HSPCs (RNA-seq 1.8-fold change, n=4 independent experiments, p-value < 0.05) and in EB-OP9-HSPCs compared to FL-HSPCs (microarray, 2-fold change, p-value < 0.05) are shown in blue pattern overlay. (K) Examples of HSC factors downregulated in HOXA7 knockdown FL-HSPCs and (L) differentiation associated genes upregulated in HOXA7 knockdown FL-HSPCs. Mean shown for n=4 independent specimens, values used to generate graphs can be found in Supplementary Table 4 and GEO database GSE76685). See Supplementary Table 7 for Statistics source data for 4D, F and I.
Figure 5
Figure 5. Overexpression of medial HOXA genes enhances proliferative potential in FL-HSPCs but does not confer HSC properties to hESC-HSPCs
(A) Schematic showing the strategy for constitutive lentiviral overexpression of HOXA5 or HOXA7 in FUGW vectors in FL-HSPCs. (B) Representative FACS plots of FUGW empty vector, HOXA5- or HOXA7- overexpressing FL-HSPCs. (C, D) Expansion of total FL cells (C) or HSPCs (D) transduced with HOXA5- or HOXA7- overexpression vectors or empty vector control (CTR), (mean and SEM values from n=3 independent experiments; statistical significance was assessed using the paired Student’s t-test. (E) q-RT-PCR confirming overexpression in transduced HSPCs sorted 1 week post-infection (n=1 experiment with 2 pooled donors). (F) CFU-Cs from 2000 HSPCs sorted after day 10 of infection with vectors overexpressing HOXA5 or HOXA7 or FUGW empty vector control (mean and SD values shown from n=4 transductions from 2 independent experiments, p-values shown correspond to CTR vs. OE-HOXA7). (G) Schematic showing the strategy for lentiviral overexpression of HOXA5 and/or HOXA7 and/or HOXA9 in FUGW vectors in EB CD34+ cells. (H) Representative examples of FACS plots of EB CD34+ cells overexpressing HOXA5 or HOXA7 or a combination of HOXA5, HOXA7 and HOXA9. Un-transduced FL is shown as a control. (I) Quantification of CD34+CD38−/loCD45+ haematopoietic cells from (H), mean from n=4 independent experiments for CTR and n=3 for HOXA5/7/9, HOXA5, and HOXA7 at days 0 and 24, and n=2 at all other time points. J) Representative FACS plots and (K) quantification of human CD45+ cells in the BM of NSG mice 12 weeks post-transplantation. Multi-lineage engraftment is assessed by CD19 and CD3 (B-and T-lymphoid) and CD66 and CD33 (myeloid) (mean from n=5 mice per condition (except for FL n=4) from two independent experiments). (L). Q-RT-PCR for HOXA7 from transduced EB-OP9-HSPCs 2 weeks post-infection from one representative experiment. (M) Graphs representing RNA-seq of EB-OP9 cells overexpressing HOXA7 for genes regulated by HOXA7 in FL-HSPCs (Figure 4K,L) (one representative experiment, GEO database GSE76685). See Supplementary Table 7 for statistics source data in D, E, F, I and K.
Figure 6
Figure 6. Retinoic acid signalling activates medial HOXA genes during human haematopoietic development
(A) Microarray analysis of gene expression of components of RA signalling pathway compared to FL-HSPCs (for n see Figure 4B); for mean values see Supplementary Table 1 and GEO database GSE64865). (B) Schematic showing 6-day treatment of CD34+ EB and FL cells by all-trans retinoic acid (ATRA) and RAR-α agonist AM580. Cells were re-seeded on OP9-M2 stroma after 12 days and analysed after additional 12±1 days (day 24±1). (C) q-RT-PCR of HOXA3, HOXA5, HOXA6, HOXA7 and HOXA9 expression in EB or FL cells treated with RA and AM580 (mean +/- SEM from n=4 independent experiments, see Supplementary Table 7 for statistics source data). (D) Representative FACS plots of CD45+ cells from AM580-treated EB and FL cells at 6, 12 and 24 days on OP9-M2 culture (n=8 independent experiments). (E) Quantification of CD34+CD38−/lo and (F) HSPC fraction of EB- and FL-derived haematopoietic cells at day 24±1 of OP9-M2 culture (mean +/− S.E.M from n=8 independent experiments). Statistical significance was assessed using the Student’s paired t-test for C, E, and F, one-tailed for C and two-tailed for E and F.
Figure 7
Figure 7. Retinoic acid signalling pulse in EB haemato-vascular cells induces transcriptional programs associated with definitive haemogenic endothelium and HSC fate
(A) FPKM quantification from RNA-seq for RAR-α targets RAR-β and RARA-γ and (B) HOXA genes in sorted AM580-treated and DMSO control hESC-HSPCs (mean from 2 independent experiments). (C) RNA-seq genome browser screen shot for HOXA cluster and RUNX1 in hESC- and FL-HSPCs after 6 days of AM580 treatment. (D) GO categories of biological processes significantly upregulated in hESC-HSPCs by AM580 treatment at day 6. (E) FPKM quantification values from representative genes from vasculature development and transcription GO categories from genes significantly upregulated in hESC-HSPCs by 6 day AM580 treatment (2-fold or greater change, p-value <0.05, mean from 2 independent experiments). (F) ATAC-seq genome browser shot for HOXA cluster and RUNX1 assessing change in accessibility of regulatory regions in hESC- and FL-HSPCs upon AM580 treatment. (G) Peaks significantly induced by AM580-treatment grouped based on the distance from TSS. (H) GO categories enriched among genes showing significant difference in accessibility after AM580 treatment. (I) ATAC-seq signal proximal to the TSS of genes up- or downregulated by AM580 treatment. (ATAC-seq data shows one representative data set from two independent experiments that showed comparable results). See Supplementary Table 5 and GEO database GSE76685 for values used to generate graphs in 6 B, E, G, H and I.

Similar articles

Cited by

References

    1. Bordignon C. Stem-cell therapies for blood diseases. Nature. 2006;441:1100–1102. - PubMed
    1. Doulatov S, et al. Induction of multipotential hematopoietic progenitors from human pluripotent stem cells via respecification of lineage-restricted precursors. Cell Stem Cell. 2013;13:459–470. - PMC - PubMed
    1. Pereira CF, et al. Induction of a hemogenic program in mouse fibroblasts. Cell Stem Cell. 2013;13:205–218. - PMC - PubMed
    1. Riddell J, et al. Reprogramming committed murine blood cells to induced hematopoietic stem cells with defined factors. Cell. 2014;157:549–564. - PMC - PubMed
    1. Olsen AL, Stachura DL, Weiss MJ. Designer blood: creating hematopoietic lineages from embryonic stem cells. Blood. 2006;107:1265–1275. - PMC - PubMed

Publication types

MeSH terms