

Novel Luminex Assay for Telomere Repeat Mass Does Not Show Well Position Effects Like qPCR
- PMID: 27182778
- PMCID: PMC4868509
- DOI: 10.1371/journal.pone.0155548
Novel Luminex Assay for Telomere Repeat Mass Does Not Show Well Position Effects Like qPCR
Abstract
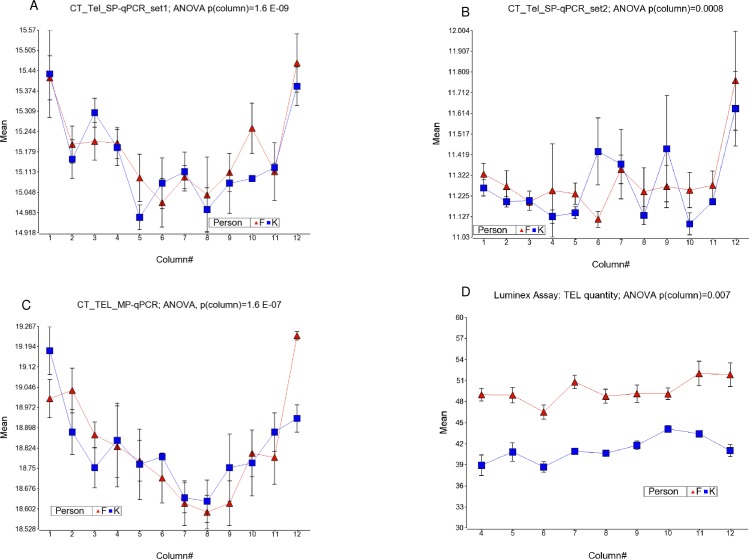
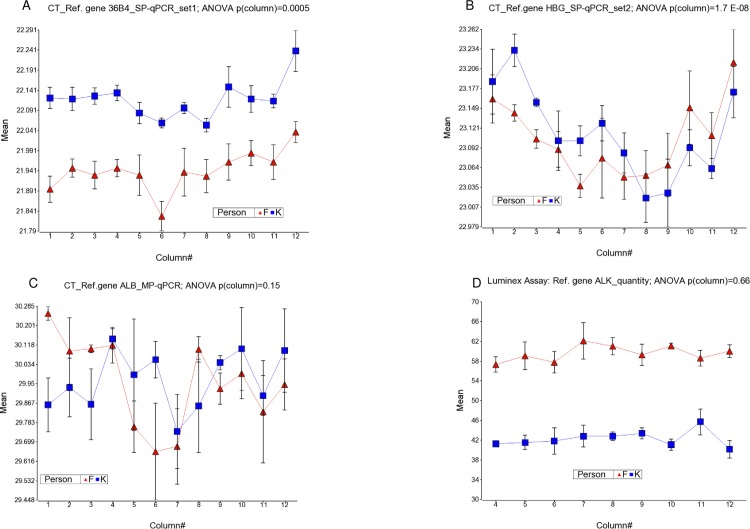
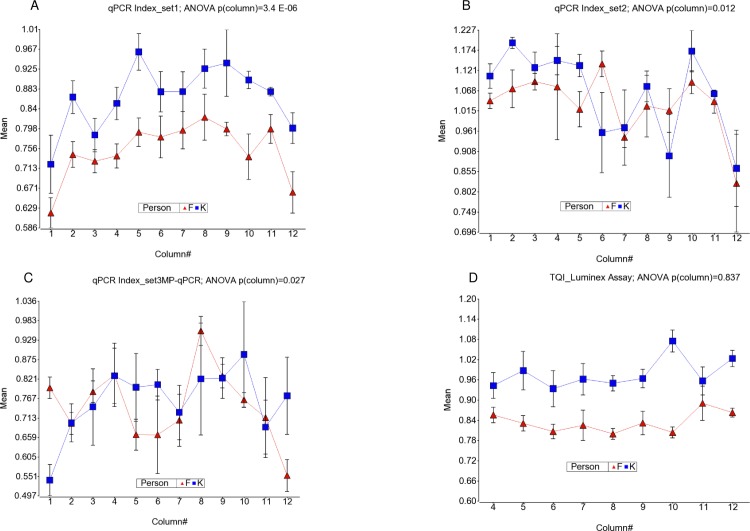
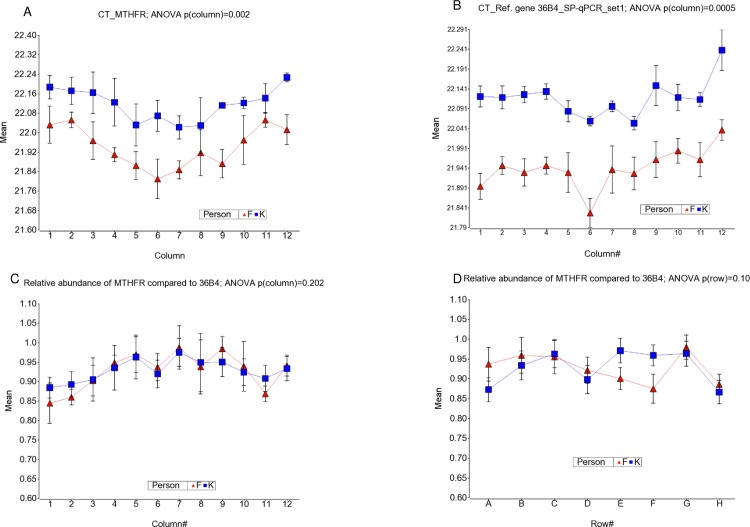
Telomere length is a potential biomarker of aging and risk for age-related diseases. For measurement of relative telomere repeat mass (TRM), qPCR is typically used primarily due to its low cost and low DNA input. But the position of the sample on a plate often impacts the qPCR-based TRM measurement. Recently we developed a novel, probe-based Luminex assay for TRM that requires ~50ng DNA and involves no DNA amplification. Here we report, for the first time, a comparison among TRM measurements obtained from (a) two singleplex qPCR assays (using two different primer sets), (b) a multiplex qPCR assay, and (c) our novel Luminex assay. Our comparison is focused on characterizing the effects of sample positioning on TRM measurement. For qPCR, DNA samples from two individuals (K and F) were placed in 48 wells of a 96-well plate. For each singleplex qPCR assay, we used two plates (one for Telomere and one for Reference gene). For the multiplex qPCR and the Luminex assay, the telomere and the reference genes were assayed from the same well. The coefficient of variation (CV) of the TRM for Luminex (7.2 to 8.4%) was consistently lower than singleplex qPCR (11.4 to 14.9%) and multiplex qPCR (19.7 to 24.3%). In all three qPCR assays the DNA samples in the left- and right-most columns showed significantly lower TRM than the samples towards the center, which was not the case for the Luminex assay (p = 0.83). For singleplex qPCR, 30.5% of the variation in TL was explained by column-to-column variation and 0.82 to 27.9% was explained by sample-to-sample variation. In contrast, only 5.8% of the variation in TRM for the Luminex assay was explained by column-to column variation and 50.4% was explained by sample-to-sample variation. Our novel Luminex assay for TRM had good precision and did not show the well position effects of the sample that were seen in all three of the qPCR assays that were tested.
Conflict of interest statement
Figures
Similar articles
-
A novel pooled-sample multiplex luminex assay for high-throughput measurement of relative telomere length.Am J Hum Biol. 2018 Jul;30(4):e23118. doi: 10.1002/ajhb.23118. Epub 2018 Mar 12. Am J Hum Biol. 2018. PMID: 29527774 Free PMC article.
-
Telomere length measurement by a novel Luminex-based assay: a blinded comparison to Southern blot.Int J Mol Epidemiol Genet. 2016 Mar 23;7(1):18-23. eCollection 2016. Int J Mol Epidemiol Genet. 2016. PMID: 27186324 Free PMC article.
-
Empirical evaluation of humpback whale telomere length estimates; quality control and factors causing variability in the singleplex and multiplex qPCR methods.BMC Genet. 2012 Sep 6;13:77. doi: 10.1186/1471-2156-13-77. BMC Genet. 2012. PMID: 22954451 Free PMC article.
-
Telomere length measurement by qPCR - Summary of critical factors and recommendations for assay design.Psychoneuroendocrinology. 2019 Jan;99:271-278. doi: 10.1016/j.psyneuen.2018.10.005. Epub 2018 Oct 10. Psychoneuroendocrinology. 2019. PMID: 30343983 Free PMC article. Review.
-
Standard guidelines for the publication of telomere qPCR results in evolutionary ecology.Mol Ecol Resour. 2020 May;20(3). doi: 10.1111/1755-0998.13152. Epub 2020 Mar 24. Mol Ecol Resour. 2020. PMID: 32133733 Review.
Cited by
-
Bovine telomere dynamics and the association between telomere length and productive lifespan.Sci Rep. 2018 Aug 24;8(1):12748. doi: 10.1038/s41598-018-31185-z. Sci Rep. 2018. PMID: 30143784 Free PMC article.
-
The contribution of parent-to-offspring transmission of telomeres to the heritability of telomere length in humans.Hum Genet. 2019 Jan;138(1):49-60. doi: 10.1007/s00439-018-1964-2. Epub 2018 Dec 10. Hum Genet. 2019. PMID: 30536049 Free PMC article.
-
The association between telomere length and mortality in Bangladesh.Aging (Albany NY). 2017 Jun 15;9(6):1537-1551. doi: 10.18632/aging.101246. Aging (Albany NY). 2017. PMID: 28630379 Free PMC article.
-
Determinants of telomere length across human tissues.Science. 2020 Sep 11;369(6509):eaaz6876. doi: 10.1126/science.aaz6876. Science. 2020. PMID: 32913074 Free PMC article.
-
Urinary arsenic and relative telomere length in 5-7 year old children in Bangladesh.Environ Int. 2021 Nov;156:106765. doi: 10.1016/j.envint.2021.106765. Epub 2021 Jul 15. Environ Int. 2021. PMID: 34273872 Free PMC article.
References
-
- Blackburn EH. Structure and function of telomeres. Nature; 1991; 350: 569–73. - PubMed
-
- Blackburn EH. Switching and signaling at the telomere. Cell; 2001; 106: 661–73. - PubMed
-
- Lapham K, Kvale MN, Lin J, Connell S, Croen LA, Dispensa BP, et al. Automated Assay of Telomere Length Measurement and Informatics for 100,000 Subjects in the Genetic Epidemiology Research on Adult Health and Aging (GERA) Cohort. Genetics; 2015; 200: 1061–72. 10.1534/genetics.115.178624 - DOI - PMC - PubMed
Publication types
MeSH terms
Grants and funding
LinkOut - more resources
Full Text Sources
Other Literature Sources
