. 2016 May 16:6:26028.
doi: 10.1038/srep26028.

Peroxisomes are platforms for cytomegalovirus' evasion from the cellular immune response

Affiliations

Peroxisomes are platforms for cytomegalovirus' evasion from the cellular immune response

Ana Cristina Magalhães et al. Sci Rep. .

Abstract

The human cytomegalovirus developed distinct evasion mechanisms from the cellular antiviral response involving vMIA, a virally-encoded protein that is not only able to prevent cellular apoptosis but also to inhibit signalling downstream from mitochondrial MAVS. vMIA has been shown to localize at mitochondria and to trigger their fragmentation, a phenomenon proven to be essential for the signalling inhibition. Here, we demonstrate that vMIA is also localized at peroxisomes, induces their fragmentation and inhibits the peroxisomal-dependent antiviral signalling pathway. Importantly, we demonstrate that peroxisomal fragmentation is not essential for vMIA to specifically inhibit signalling downstream the peroxisomal MAVS. We also show that vMIA interacts with the cytoplasmic chaperone Pex19, suggesting that the virus has developed a strategy to highjack the peroxisomal membrane proteins' transport machinery. Furthermore, we show that vMIA is able to specifically interact with the peroxisomal MAVS. Our results demonstrate that peroxisomes constitute a platform for evasion of the cellular antiviral response and that the human cytomegalovirus has developed a mechanism by which it is able to specifically evade the peroxisomal MAVS-dependent antiviral signalling.


Figures
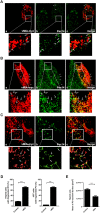
Figure 1
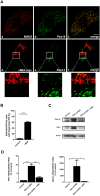
Figure 1. vMIA localizes at peroxisomes and causes their fragmentation.
(A) (a-c) vMIA intracellular localization in HepG2 cells (a) vMIA-myc, (b) Pex14 and (c) merge image of a and b. (B) (a-c) vMIA intracellular localization in HFF cells (a) vMIA-myc, (b) Pex14 and (c) merge image of a and b. (C) (a-c) vMIA intracellular localization in DLP1-patient cells. (a) vMIA-myc, (b) Pex14 and (c) merge image of a and b. The images presented in the zoom insets from panel (C) are the result of deconvolution and 3D rendering analysis. Confocal images from immunofluorescence staining. Bars represent 10 μm. Arrows represent co-localization loci. (D) Quantification analysis of peroxisome morphology in the presence and absence of vMIA in HepG2 and HFF cells. We considered cells containing “fragmented peroxisomes” as those whose peroxisomes were significantly smaller and in higher number when compared to the control cells. Data represents the means ± SEM of three independent experiments. Error bars represent SEM. ***p < 0.001 in a Student’s t test. (E) Quantification analysis of peroxisomal area (pixel2) in the presence or absence of vMIA in HepG2 cells, using the Spot Detector plug-in from Icy Bioimage Analysis Software. Data represents the means ± SEM of three independent experiments. Error bars represent SEM. ***p < 0.001 in a Student’s t test.
Figure 2
Figure 2. Biochemical analysis of vMIA intracellular localization.
(A) Western blot analysis of the presence of vMIA in cytosolic (Cyto), mitochondrial (Mito) and peroxisomal-enriched (PO) fractions, upon differential centrifugation of HFF lysates. PMP70, TIM23 and tubulin were used as peroxisomal, mitochondrial and cytosolic markers, respectively. (B) Western blot analysis of the localization of vMIA after density gradient centrifugation of HepG2 lysates. ACOX1 and Pex14 are used as peroxisomal markers, TOM20 and COXIV are used as mitochondrial markers and BiP/GRP78 as ER marker.
Figure 3
Figure 3. vMIA localization upon HCMV infection.
(a) Representative image of peroxisomal morphology in uninfected HFF cells, stained with catalase. (b–d) HFF cells infected with HCMV, 8 h post-infection. (b) vMIA, (c) catalase and (d) merge image of b and c. Arrows indicate co-localization loci. Bar represents 10 μm.
Figure 4
Figure 4. vMIA interacts with Pex19.
(A) Co-immunoprecipitation analysis of the interaction between overexpressed Pex19-YFP and vMIA-myc in HepG2 cells. The pull-down was performed using GFP-Trap M kit. Negative control was performed by immunoprecipitating cells overexpressing GFP and vMIA-myc. Western blot was performed with antibodies against myc, Pex19 and GFP. Input represents total cell lysate and IP represents the immunoprecipitation. Arrows indicate endogenous Pex19 and the transfected Pex19-YFP. (B) Co-immunoprecipitation analysis of the interaction between overexpressed vMIA-myc and endogenous Pex19 in HFF cells. The pull-down was performed using an antibody against myc. Negative control was performed by immunoprecipitating non-transfected cells. Western blot was performed with antibodies against myc and Pex19. Input represents total cell lysate and IP represents the immunoprecipitation. (C) Co-immunoprecipitation analysis of the interaction between overexpressed Pex19-YFP and vMIA-myc in HFF cells. The pull-down was performed using an antibody against GFP. Negative control was performed by immunoprecipitating cells overexpressing vMIA-myc. Western blot was performed with antibodies against myc and GFP. Input represents total cell lysate and IP represents the immunoprecipitation.
Figure 5
Figure 5. vMIA inhibits the peroxisomal-dependent antiviral signalling.
(A) (a–c) MAVS intracellular localization in Mefs MAVS-Pex cells (a) MAVS, (b) Pex14 and (c) merge image of a and b. (d–f) localization of transfected vMIA in Mefs MAVS-Pex cells (d) vMIA-myc, (e) Pex14 and (f) merge image of d and e. Confocal images from immunofluorescence staining. Bar represents 10 μm. (B) Quantification analysis of peroxisome morphology in the presence and absence of vMIA in Mefs MAVS-Pex cells. Data represents the means ± SEM of three independent experiments. Error bars represent SEM. ***p < 0.001 in a Student’s t test. (C) Western blot analysis of the production of IRF1 and viperin in Mefs MAVS-Pex cells stimulated with GFP-RIG-I-CARD in the presence or absence of vMIA. Representative image of three independent experiments. Actin was used as a loading control. (D) RT-qPCR analysis of IRF1 and viperin mRNA in Mefs MAVS-Pex cells stimulated with GFP-RIG-I-CARD in the presence or absence of vMIA. GAPDH was used as control. Data represents the means ± SEM of three independent experiments. Error bars represent SEM. *p < 0.05 and ***p < 0.001 in one-way ANOVA, with Bonferroni’s post test.
Figure 6
Figure 6. Interactions between peroxisomal MAVS and vMIA.
(A) Co-immunoprecipitation analysis of the interaction between overexpressed vMIA-myc and endogenous MAVS in Mefs MAVS-Pex cells. Negative control was performed by immunoprecipitating non-transfected cells. The pull-down was performed using an antibody against MAVS. Western blot was performed with antibodies against MAVS and myc. Input represents total cell lysate and IP represents the immunoprecipitation. (B) As negative control, the mitochondrial myc-tagged Miro1 (myc-Miro1) was transfected in Mefs MAVS-Pex cells. The pull-down was performed using an antibody against MAVS. Western Blot was performed with antibodies against MAVS and myc. Input represents total cell lysate and IP represents the immunoprecipitation. (C) As negative control, vMIA-myc was transfected in Mefs MAVS-KO cells. The pull-down was performed using an antibody against MAVS. Western Blot was performed with antibodies against MAVS and myc. Input represents total cell lysate and IP represents the immunoprecipitation.
Figure 7
Figure 7. Peroxisomal fragmentation is not essential for vMIA’s inhibition of the peroxisomal-dependent antiviral signalling.
(A) (a–c) Peroxisome morphology in DLP1-silenced Mefs MAVS-Pex cells (a) DLP1, (b) Pex14 and (c) merge image of a and b. Confocal images from immunofluorescence staining. Bar represents 10 μm. (B) Western blot analysis of the silencing of DLP1 in Mefs MAVS-Pex cells. Representative image of three independent experiments. (C) RT-qPCR analysis of the expression of IRF1 mRNA in Mefs MAVS-Pex cells stimulated with GFP-RIG-I-CARD in the presence of vMIA-myc and upon silencing of DLP1. Non-silenced cells, as well as cells not expressing vMIA-myc were used as controls. GAPDH was measured as control. Data represents the means ± SEM of three independent experiments. Error bars represent SEM. ***p < 0.001 in one-way ANOVA, with Bonferroni’s post test.

Similar articles

Cited by

References

    1. Mocarski E. S., Shenk T. & Pass R. F. In Fields Virol. (Knipe D. M. & Howley P. M.) 2701–2772 (Lippincott Williams & Wilkins, 2007).
    1. Paludan S. R., Bowie A. G., Horan K. A. & Fitzgerald K. A. Recognition of herpesviruses by the innate immune system. Nat. Rev. Immunol. 11, 143–54 (2011). - PMC - PubMed
    1. Fliss P. M. & Brune W. Prevention of cellular suicide by cytomegaloviruses. Viruses 4, 1928–49 (2012). - PMC - PubMed
    1. Goldmacher V. S. Cell death suppression by cytomegaloviruses. Apoptosis 10, 251–65 (2005). - PubMed
    1. Goldmacher V. S. et al.. A cytomegalovirus-encoded mitochondria-localized inhibitor of apoptosis structurally unrelated to Bcl-2. Proc. Natl. Acad. Sci. USA 96, 12536–41 (1999). - PMC - PubMed

Publication types

Substances