. 2016 Oct;64(4):1189-201.
doi: 10.1002/hep.28641. Epub 2016 Jun 15.

Chronic expression of interferon-gamma leads to murine autoimmune cholangitis with a female predominance

Affiliations

Chronic expression of interferon-gamma leads to murine autoimmune cholangitis with a female predominance

Heekyong R Bae et al. Hepatology. 2016 Oct.

Abstract

In most autoimmune diseases the serologic hallmarks of disease precede clinical pathology by years. Therefore, the use of animal models in defining early disease events becomes critical. We took advantage of a "designer" mouse with dysregulation of interferon gamma (IFNγ) characterized by prolonged and chronic expression of IFNγ through deletion of the IFNγ 3'-untranslated region adenylate uridylate-rich element (ARE). The ARE-Del(-/-) mice develop primary biliary cholangitis (PBC) with a female predominance that mimics human PBC that is characterized by up-regulation of total bile acids, spontaneous production of anti-mitochondrial antibodies, and portal duct inflammation. Transfer of CD4 T cells from ARE-Del(-/-) to B6/Rag1(-/-) mice induced moderate portal inflammation and parenchymal inflammation, and RNA sequencing of liver gene expression revealed that up-regulated genes potentially define early stages of cholangitis. Interestingly, up-regulated genes specifically overlap with the gene expression signature of biliary epithelial cells in PBC, implying that IFNγ may play a pathogenic role in biliary epithelial cells in the initiation stage of PBC. Moreover, differentially expressed genes in female mice have stronger type 1 and type 2 IFN signaling and lymphocyte-mediated immune responses and thus may drive the female bias of the disease.

Conclusion: Changes in IFNγ expression are critical for the pathogenesis of PBC. (Hepatology 2016;64:1189-1201).


Conflict of interest statement

The authors declare no competing financial interests.

Figures
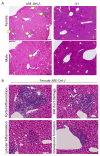
Figure 1
Figure 1
Liver histology in ARE-Del−/− mice. 1A. Representative H&E staining of male and female ARE-Del−/− mice. Arrow bars point to the inflammatory foci region. 1B. Representative H&E staining of portal inflammation (arrow bar: bile duct showing mild damage), lobular inflammation (arrow bar: focal necrosis), biliary duct damage (arrow bar: bile duct showing moderate damage) and granuloma formation (arrow bar: epithelioid granuloma in portal tract) in female ARE-Del−/− mice. 1C. Statistical analysis of liver histology of male and female ARE-Del−/− mice was performed by the nonparametric Mann Whitney test using GraphPad Prism 6.0 (mean ± SEM; n=16 from three independent experiments). The two-tailed p-value < 0.05 was taken as significance (* P < 0.05, ** P < 0.01, *** P < 0.001, n.s., not significant). 1D. Representative Sirius Red staining of liver fibrosis in female ARE-Del−/− mice at age 20 wks. Scale bar: 200 μm (A left and D top); 50 μm (A right, B and D bottom).
Figure 1
Figure 1
Liver histology in ARE-Del−/− mice. 1A. Representative H&E staining of male and female ARE-Del−/− mice. Arrow bars point to the inflammatory foci region. 1B. Representative H&E staining of portal inflammation (arrow bar: bile duct showing mild damage), lobular inflammation (arrow bar: focal necrosis), biliary duct damage (arrow bar: bile duct showing moderate damage) and granuloma formation (arrow bar: epithelioid granuloma in portal tract) in female ARE-Del−/− mice. 1C. Statistical analysis of liver histology of male and female ARE-Del−/− mice was performed by the nonparametric Mann Whitney test using GraphPad Prism 6.0 (mean ± SEM; n=16 from three independent experiments). The two-tailed p-value < 0.05 was taken as significance (* P < 0.05, ** P < 0.01, *** P < 0.001, n.s., not significant). 1D. Representative Sirius Red staining of liver fibrosis in female ARE-Del−/− mice at age 20 wks. Scale bar: 200 μm (A left and D top); 50 μm (A right, B and D bottom).
Figure 2
Figure 2
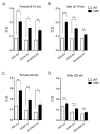
Levels of anti-mitochondrial antibodies in ARE-Del−/− mice. 2A–B. Level of anti-PDC-E2, anti-OGDC-E2 and anti-BCOADC-E2 in the serum of female (A) and male (B) ARE-Del−/− at age 10 (±2) weeks (n=4). 2C–D. Level of anti-PDC-E2, anti-OGDC-E2 and anti-BCOADC-E2 in the serum of female (C) and male (D) ARE-Del−/− at age 20 (±2) weeks (n=7–8). Data represent mean ± SEM. Statistical analysis was performed by the unpaired Student’s t-test. * P < 0.05, ** P < 0.01, *** P < 0.001, n.s., not significant. All data are representative of at least three independent experiments.
Figure 3
Figure 3
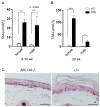
Serum TBA levels in ARE-Del−/− mice. 3A. Serum TBA levels in female and male ARE-Del at age 10 (±2) weeks (n=4). 3B. Serum TBA levels in female and male ARE-Del at age 20 (±2) weeks (n=7–8). Data represent mean ± SEM. Statistical analysis was performed by the unpaired Student’s t-test. * P < 0.05, ** P < 0.01, *** P < 0.001, n.s., not significant. 3C. Increased tail skin pigmentation in female ARE-Del−/− mice. All data are representative of at least three independent experiments.
Figure 4
Figure 4
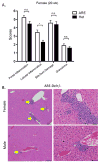
Pathology of ARE-Del heterozygotes vs homozygotes. 4A. Statistical analysis of female ARE-Del−/− (n=9 from two independent experiments) vs ARE-Del+/− mice (n=23 from two independent experiments) in portal inflammation, lobular inflammation, biliary damage and granuloma formation at age 20 wks (mean ± SEM), performed by nonparametric Mann Whitney test with the two-tailed p-value. 4B. Representative H&E staining of male and female ARE-Del+/− mice at age 20 wks. Arrow bars point to the inflammatory foci region. 4C. Statistical analysis of liver histology of male and female ARE-Del+/− mice (n=20 ± 2 from two independent experiments) was performed by Mann Whitney test with the two-tailed p-value. 4D–E. IgG and IgM anti-PDC-E2 in male and female ARE-Del+/− mice at age 20 wks (mean ± SD, n=20 ± 2). 4F. Serum TBA in male and female ARE-Del+/− mice at age 20 wks (mean ± SD, n=20 ± 2). 4D–F. Statistical analysis was performed by the unpaired Student’s t-test.* P < 0.05, ** P < 0.01, *** P < 0.001, n.s., not significant.
Figure 4
Figure 4
Pathology of ARE-Del heterozygotes vs homozygotes. 4A. Statistical analysis of female ARE-Del−/− (n=9 from two independent experiments) vs ARE-Del+/− mice (n=23 from two independent experiments) in portal inflammation, lobular inflammation, biliary damage and granuloma formation at age 20 wks (mean ± SEM), performed by nonparametric Mann Whitney test with the two-tailed p-value. 4B. Representative H&E staining of male and female ARE-Del+/− mice at age 20 wks. Arrow bars point to the inflammatory foci region. 4C. Statistical analysis of liver histology of male and female ARE-Del+/− mice (n=20 ± 2 from two independent experiments) was performed by Mann Whitney test with the two-tailed p-value. 4D–E. IgG and IgM anti-PDC-E2 in male and female ARE-Del+/− mice at age 20 wks (mean ± SD, n=20 ± 2). 4F. Serum TBA in male and female ARE-Del+/− mice at age 20 wks (mean ± SD, n=20 ± 2). 4D–F. Statistical analysis was performed by the unpaired Student’s t-test.* P < 0.05, ** P < 0.01, *** P < 0.001, n.s., not significant.
Figure 5
Figure 5
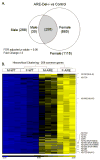
Hepatic gene expression in male and female ARE-Del−/− mice at age 20 wks. 5A. Venn diagram of differentially expressed genes in male and female ARE-Del−/− mice vs control mice (n=3). 5B. Hierarchical clustering of 258 common genes. The human homologs are described in parentheses. 5C. Hierarchical clustering of 20 genes involved in interferon signaling pathway. 5D. Top canonical pathways of common genes derived from IPA. Ratio (bottom y-axis, yellow line) refers to the number of genes from dataset divided by the total number of genes that make up that pathway from within the IPA knowledgebase and the -log of P value (top y-axis, bar) was calculated by Fisher’s exact test.
Figure 5
Figure 5
Hepatic gene expression in male and female ARE-Del−/− mice at age 20 wks. 5A. Venn diagram of differentially expressed genes in male and female ARE-Del−/− mice vs control mice (n=3). 5B. Hierarchical clustering of 258 common genes. The human homologs are described in parentheses. 5C. Hierarchical clustering of 20 genes involved in interferon signaling pathway. 5D. Top canonical pathways of common genes derived from IPA. Ratio (bottom y-axis, yellow line) refers to the number of genes from dataset divided by the total number of genes that make up that pathway from within the IPA knowledgebase and the -log of P value (top y-axis, bar) was calculated by Fisher’s exact test.
Figure 6
Figure 6
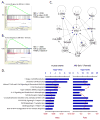
Comparison of the gene expression profiling to human data from PBC patients. 6A–B. GSEA enrichment plots for human DE genes in PBC-BEC lesions using gene sets of male (A) and female (B) ARE-Del−/− mice. NES; normalized enrichment scores, FDR; false discovery rate, FWER; family-wise error rate. 6C. Top network identified by IPA for the most significant 26 variants. The lines between genes represent known interactions (solid line for direct interaction; dashed line for indirect interaction). 6D. Canonical pathways of human GWAS with ARE-Del−/− mice. The most significant 26 variants were selected by the NHGRI GWAS catalog (p ≤ 1 x 10⁻⁵). Top canonical pathways of these genes were derived from ingenuity pathway analysis (IPA) and compared with ones from female ARE-Del−/− mice. Ratio (bottom y-axis, yellow line) refers to the number of genes from dataset divided by the total number of genes that make up that pathway from within the IPA knowledgebase and the -log of P value (top y-axis, bar) was calculated by Fisher’s exact test.
Figure 7
Figure 7
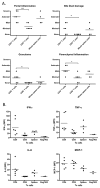
Liver histopathology and level of inflammatory cytokines in recipient mice. 7A. Pathological score of portal inflammation, bile duct damage, granuloma and parenchymal inflammation and bile duct damage in group of CD4+ T cell (n=6), CD8+ T cells (n=6) and whole spleen cells (n=4) recipient mice. 7B. Serum were collected 20 weeks after cell transfer, the levels of IFN-, TNF-α, IL-6 and MCP-1 in group of CD4+ T cell (n=6), CD8+ T cells (n=6) and whole spleen cells (n=4) recipient mice were measured by a mouse inflammatory cytokine CBA kit. *, p< 0.05; **, p<0.01, determined using Kruskal-Wallis Test (Nonparametric ANOVA). All data are representative of at least two independent experiments.

Comment in

Similar articles

Cited by

References

    1. Floreani A, Franceschet I, Perini L, Cazzagon N, Gershwin ME, Bowlus CL. New therapies for primary biliary cirrhosis. Clinical reviews in allergy & immunology. 2015;48:263–272. - PubMed
    1. Gershwin ME, Mackay IR, Sturgess A, Coppel RL. Identification and specificity of a cDNA encoding the 70 kd mitochondrial antigen recognized in primary biliary cirrhosis. J Immunol. 1987;138:3525–3531. - PubMed
    1. Kaplan MM, Gershwin ME. Primary biliary cirrhosis. N Engl J Med. 2005;353:1261–1273. - PubMed
    1. Webb GJ, Siminovitch KA, Hirschfield GM. The immunogenetics of primary biliary cirrhosis: A comprehensive review. Journal of autoimmunity. 2015 - PMC - PubMed
    1. Beuers U, Gershwin ME, Gish RG, Invernizzi P, Jones DE, Lindor K, Ma X, et al. Changing nomenclature for PBC: From ‘cirrhosis’ to ‘cholangitis’. Digestive and liver disease: official journal of the Italian Society of Gastroenterology and the Italian Association for the Study of the Liver. 2015 - PubMed

Publication types

Substances