Slug-upregulated miR-221 promotes breast cancer progression through suppressing E-cadherin expression
- PMID: 27174021
- PMCID: PMC4865839
- DOI: 10.1038/srep25798
Slug-upregulated miR-221 promotes breast cancer progression through suppressing E-cadherin expression
Abstract
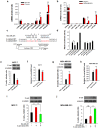
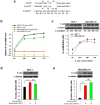
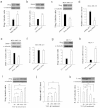
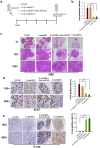
It is generally regarded that E-cadherin is downregulated during tumorigenesis via Snail/Slug-mediated E-cadherin transcriptional reduction. However, this transcriptional suppressive mechanism cannot explain the failure of producing E-cadherin protein in metastatic breast cancer cells after overexpressing E-cadherin mRNA. Here we reveal a novel mechanism that E-cadherin is post-transcriptionally regulated by Slug-promoted miR-221, which serves as an additional blocker for E-cadherin expression in metastatic tumor cells. Profiling the predicted E-cadherin-targeting miRNAs in breast cancer tissues and cells showed that miR-221 was abundantly expressed in breast tumor and metastatic MDA-MB-231 cells and its level was significantly higher in breast tumor or MDA-MB-231 cells than in distal non-tumor tissue and low-metastatic MCF-7 cells, respectively. MiR-221, which level inversely correlated with E-cadherin level in breast cancer cells, targeted E-cadherin mRNA open reading frame (ORF) and suppressed E-cadherin protein expression. Depleting or increasing miR-221 level in breast cancer cells induced or decreased E-cadherin protein level, leading to suppressing or promoting tumor cell progression, respectively. Moreover, miR-221 was specifically upregulated by Slug but not Snail. TGF-β treatment enhanced Slug activity and thus increased miR-221 level in MCF-7 cells. In summary, our results provide the first evidence that Slug-upregulated miR-221 promotes breast cancer progression via reducing E-cadherin expression.
Figures


Similar articles
-
Oncofetal H19 RNA promotes tumor metastasis.Biochim Biophys Acta. 2014 Jul;1843(7):1414-26. doi: 10.1016/j.bbamcr.2014.03.023. Epub 2014 Apr 2. Biochim Biophys Acta. 2014. PMID: 24703882
-
microRNA-203 suppresses invasion of gastric cancer cells by targeting ERK1/2/Slug/ E-cadherin signaling.Cancer Biomark. 2017;19(1):11-20. doi: 10.3233/CBM-160167. Cancer Biomark. 2017. PMID: 28269747
-
Upregulation of microRNA-137 expression by Slug promotes tumor invasion and metastasis of non-small cell lung cancer cells through suppression of TFAP2C.Cancer Lett. 2017 Aug 28;402:190-202. doi: 10.1016/j.canlet.2017.06.002. Epub 2017 Jun 10. Cancer Lett. 2017. PMID: 28610956
-
Cadherins: The Superfamily Critically Involved in Breast Cancer.Curr Pharm Des. 2016;22(5):616-38. doi: 10.2174/138161282205160127095338. Curr Pharm Des. 2016. PMID: 26825466 Review.
-
Molecular mechanisms controlling E-cadherin expression in breast cancer.Biochem Biophys Res Commun. 2009 Jun 19;384(1):6-11. doi: 10.1016/j.bbrc.2009.04.051. Epub 2009 Apr 18. Biochem Biophys Res Commun. 2009. PMID: 19379710 Free PMC article. Review.
Cited by
-
Trichostatin A reverses epithelial-mesenchymal transition and attenuates invasion and migration in MCF-7 breast cancer cells.Exp Ther Med. 2020 Mar;19(3):1687-1694. doi: 10.3892/etm.2020.8422. Epub 2020 Jan 3. Exp Ther Med. 2020. PMID: 32104221 Free PMC article.
-
Downregulation of miR-221-3p and upregulation of its target gene PARP1 are prognostic biomarkers for triple negative breast cancer patients and associated with poor prognosis.Oncotarget. 2017 Oct 6;8(65):108712-108725. doi: 10.18632/oncotarget.21561. eCollection 2017 Dec 12. Oncotarget. 2017. PMID: 29312562 Free PMC article.
-
Tumor protein D52 promotes breast cancer proliferation and migration via the long non-coding RNA NEAT1/microRNA-218-5p axis.Ann Transl Med. 2021 Jun;9(12):1008. doi: 10.21037/atm-21-2668. Ann Transl Med. 2021. PMID: 34277808 Free PMC article.
-
Platelet-derived microvesicles isolated from type-2 diabetes mellitus patients harbour an altered miRNA signature and drive MDA-MB-231 triple-negative breast cancer cell invasion.PLoS One. 2024 Jun 20;19(6):e0304870. doi: 10.1371/journal.pone.0304870. eCollection 2024. PLoS One. 2024. PMID: 38900754 Free PMC article.
-
Triple-negative breast cancer-derived microvesicles transfer microRNA221 to the recipient cells and thereby promote epithelial-to-mesenchymal transition.J Biol Chem. 2019 Sep 13;294(37):13681-13696. doi: 10.1074/jbc.RA119.008619. Epub 2019 Jul 24. J Biol Chem. 2019. PMID: 31341019 Free PMC article.
References
-
- Canel M., Serrels A., Frame M. C. & Brunton V. G. E-cadherin-integrin crosstalk in cancer invasion and metastasis. J Cell Sci 126, 393–401 (2013). - PubMed
-
- Thiery J. P. Epithelial-mesenchymal transitions in tumour progression. Nat Rev Cancer 2, 442–54 (2002). - PubMed
-
- Porretti J. C., Mohamad N. A., Martin G. A. & Cricco G. P. Fibroblasts induce epithelial to mesenchymal transition in breast tumor cells which is prevented by fibroblasts treatment with histamine in high concentration. Int J Biochem Cell Biol 51, 29–38 (2014). - PubMed
-
- Hajra K. M., Chen D. Y. & Fearon E. R. The SLUG zinc-finger protein represses E-cadherin in breast cancer. Cancer Res. 62, 1613–8 (2002). - PubMed
Publication types
MeSH terms
Substances
LinkOut - more resources
Full Text Sources
Other Literature Sources
Medical
Research Materials
Miscellaneous

