. 2016 Aug 2;12(8):1215-28.
doi: 10.1080/15548627.2016.1179401. Epub 2016 May 12.

Essential control of mitochondrial morphology and function by chaperone-mediated autophagy through degradation of PARK7

Affiliations

Essential control of mitochondrial morphology and function by chaperone-mediated autophagy through degradation of PARK7

Bao Wang et al. Autophagy. .

Abstract

As a selective degradation system, chaperone-mediated autophagy (CMA) is essential for maintaining cellular homeostasis and survival under stress conditions. Increasing evidence points to an important role for the dysfunction of CMA in the pathogenesis of Parkinson disease (PD). However, the mechanisms by which CMA regulates neuronal survival under stress and its role in neurodegenerative diseases are not fully understood. PARK7/DJ-1 is an autosomal recessive familial PD gene. PARK7 plays a critical role in antioxidative response and its dysfunction leads to mitochondrial defects. In the current study, we showed that CMA mediated the lysosome-dependent degradation of PARK7. Importantly, CMA preferentially removed the oxidatively damaged nonfunctional PARK7 protein. Furthermore, CMA protected cells from mitochondrial toxin MPP(+)-induced changes in mitochondrial morphology and function, and increased cell viability. These protective effects were lost under PARK7-deficiency conditions. Conversely, overexpression of PARK7 significantly attenuated the mitochondrial dysfunction and cell death exacerbated by blocking CMA under oxidative stress. Thus, our findings reveal a mechanism by which CMA protects mitochondrial function by degrading nonfunctional PARK7 and maintaining its homeostasis, and dysregulation of this pathway may contribute to the neuronal stress and death in PD pathogenesis.

Keywords: CMA; DJ-1; PARK7; Parkinson disease; mitochondria; neuronal death.


Figures
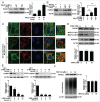
Figure 1.
Figure 1.
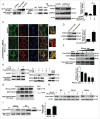
Degradation of PARK7 by lysosomes. (A) The effect of inhibition of lysosomal activity on PARK7. SN4741 cells were incubated with NH4Cl and leupeptin (Leup; 100 μM used in this and subsequent experiments) for 18 h and the levels of PARK7 were analyzed by immunoblotting. The right graph shows the quantification of PARK7 levels (mean ± SEM, n = 3; **, P < 0.01 compared to the control group). (B) The effect of serum deprivation on PARK7. SN4741 cells were maintained in serum free medium in the absence or presence of NH4Cl and Leupeptin (Leup) for 24 h. The levels of PARK7 were analyzed by immunoblotting. The right graph shows the quantification of PARK7 levels (mean ± SEM, n = 3; **, P < 0.01 compared to the control group; ##, P < 0.01 compared to serum-free only group). (C) The effect of serum deprivation on PARK7 and LAMP1 colocalization. SN4741 cells were treated as described in (B). The colocalization of PARK7 and LAMP1 was determined by immunofluorescence. The magnified images were provided. The ratio of colocalization was calculated. Scale bar: 50 μm. (D) The effect of 3-MA on PARK7. SN4741 cells were treated with 3-MA for 8 h and the levels of PARK7, MAP1LC3B-I/II and SQSTM1 were tested by immunoblotting. The lower graph shows the quantification of PARK7 level (mean ± SEM, n = 3). (E) The effect of 3-MA on serum withdrawal-induced decrease of PARK7. SN4741 cells were maintained in serum-free media with or without 3-MA for the indicated time and the levels of PARK7 were detected by immunoblotting. The lower graphs show the quantification of PARK7 levels (mean ± SEM, n = 3; **, P < 0.01 compared to the control group). (F) The effect of MG-132 on the level of PARK7. SN4741 cells were treated with the proteasome inhibitor MG132 for 8 h and the levels of PARK7 were determined by anti-ubiquitin (Ub) and anti-PARK7 blotting. The right graph shows the quantification of PARK7 levels (mean ± SEM, n = 3).
Figure 2.
Figure 2.
Degradation of PARK7 by CMA. (A) Interaction between PARK7 and HSPA8. Left panel: lysates of HEK293 cells transfected with Flag-PARK7 were immunoprecipitated with an anti-HSPA8 antibody. The precipitates were immunoblotted for Flag-PARK7 with an anti-Flag antibody as shown. Right panel: the cytoplasmic fraction of SN4741 cells were immunoprecipitated with an anti-HSPA8 antibody (IgG lane indicates that a control IgG was used in the immunoprecipitation). The precipitates were immunoblotted for PARK7 with an anti-PARK7 antibody. (B) The effect of LAMP2A on PARK7. SN4741 cells were transfected with pcDNA3 or a LAMP2A overexpression construct for 48 h in the absence or presence of NH4Cl and leupeptin, and the levels of LAMP2A and PARK7 were determined by immunoblotting. Right graph shows the quantification of PARK7 (mean ± SEM, n = 3; **, P < 0.01 compared to the control group; ##, P < 0.01 compared to the indicated group). (C) The effect of upregulated LAMP2A on PARK7 and LAMP1 colocalization. SN4741 cells were treated as in (B). The colocalization of PARK7 and LAMP1 was determined by immunofluorescence. The magnified images were also provided. The ratio of colocalization was calculated. Scale bar: 50 μm. (D) The effect of reducing LAMP2A on PARK7. SN4741 cells were transfected with lentivirus expressing control or shRNA to Lamp2a. The levels of LAMP2A and PARK7 were determined by immunoblotting. The right graph shows the quantification of PARK7 (mean ± SEM, n = 3; **, P < 0.01 compared to the control group). (E) Lysosomal binding and uptake of PARK7. Left panel: the purified lysosomes with or without a cocktail of protease inhibitors (P.I.) were incubated with the lysates of HEK293 cells overexpressing PARK7 for 20 min at 37°C. At the end of the incubation, samples were treated with proteinase K (prot K; 50 μg/ml) for 10 min at 0°C. After washing, the presence of PARK7 was determined by immunoblotting. Left panel: the left lane corresponds to PARK7 associated with the lysosomes in the absence of P.I; the middle lane shows that proteinase K efficiently removes PARK7 bound to the lysosomal membrane; and the right lane indicates the total amount of PARK7 associated with lysosomes under the condition. Right panel: the purified lysosomes with or without a cocktail of protease inhibitors (P.I.) were incubated with the purified PARK7 for 20 min at 37°C and followed with or without proteinase K and/or Triton X-100 (Tx-100) treatment (10 min at 0°C). Levels of PARK7 and lysosomal HSP90 and HSPA8 were determined by immunoblotting. (F) The effect of a known CMA substrate RNase A on the association of PARK7 with lysosomes. The experiment was carried out as in (E) right panel with or without increasing concentrations of RNase A for 20 min at 37°C. The presence of PARK7 and RNase A was determined by immunoblotting. Lower graph shows the quantification of PARK7 associated with lysosomes (mean ± SEM, n = 3; *, P < 0.05; **, P < 0.01 compared to the control group). (G) Binding between HSPA8 and wild-type (WT) or mutated PARK7. Lysates of HEK293 cells transfected with wild-type (WT) and mutated (QE→AA or NR→AA) PARK7 were immunoprecipitated with an anti-HSPA8 antibody. The precipitates were immunoblotted for Flag-PARK7 with an anti-Flag antibody. The lower graph shows the quantification of Flag-PARK7 coimmunoprecipitated with HSPA8. (H) Degradation of PARK7 mutant QE→AA and NR→AA by serum deprivation. SN4741 cells transfected with the indicated plasmids were treated as described in Fig. 1B. (I) Interaction between PARK7 mutant QE/AA and lysosomes. The lysates expressing PARK7 WT or QE→AA were incubated with purified lysosomes as described in (E). The right graph shows the quantification of wild-type and mutated QE→AA Flag-PARK7 associated with lysosomes (mean ± SEM, n = 3; **, P < 0.01).
Figure 3.
Figure 3.
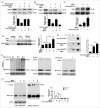
Degradation of oxidized and damaged PARK7, by CMA. (A) CMA-mediated degradation of PARK7 under MPP+. SN4741 cells transfected with lentivirus expressing shLamp2a were treated with MPP+ (50 μM) in the presence or absence of NH4Cl and leupeptin (Leup) for 24 h and the levels of PARK7 were determined by immunoblotting. The lower graph shows the quantification of PARK7 levels (mean ± SEM, n = 3; **, P < 0.01 compared to the control group). (B) The effect of 3-MA on the MPP+-induced decrease of PARK7 level. SN4741 cells were treated with 50 μμ MPP+ and 10 mM 3-MA in the presence or absence of NH4Cl and leupeptin. The levels of PARK7 were determined by immunoblotting. The lower graph shows the quantification of PARK7 levels (mean ± SEM, n = 4; **, P < 0.01 compared to the control group). (C) The effect of reducing LAMP2A on the level of carbonyl PARK7 following MPP+ treatment. The lysates from SN4741 cells transfected with lentivirus expressing shLamp2a and treated with 50 μμ MPP+ for 24 h were immunoprecipitated with an anti-PARK7 antibody. The levels of PARK7 and DNP-derivatized carbonyl groups were determined by immunoblotting. The lower graph shows the quantification of derivatized carbonyl groups levels (mean ± SEM, n = 4; ** and ##, P < 0.01 compared to the control group). (D) Increasing rate of carbonyl oxidation of PARK7 QE→AA mutant. SN4741 cells were transfected with the indicated plasmids, treated with 50 μμ MPP+ for 12 h, and assayed as described in (C). The right graph shows the quantification of the levels of the derivatized carbonyl groups (mean ± SEM, n = 3, **P < 0.01). #x2206;QE, QE→AA. (E) Accumulation of the acidic forms of PARK7 following knockdown of LAMP2A. SN4741 cells were treated as described in (A). The protein extracts were separated by 2D gel electrophoresis and analyzed for PARK7. The right graph shows the quantification of acidic form of PARK7 (mean ± SEM; n=3; *, P < 0.05; **, P < 0.01). (F) The effect of lysosomal and CMA activity on the PARK7 monomer and dimer. SN4741 cells were treated with NH4Cl and Leupeptin (Leup) or serum deprivation for the indicated duration, or transfected with lentiviral shLamp2a and then treated with DSS (5 mM). The levels of PARK7 were detected by immunoblotting. (G) Degradation of monomeric form of PARK7 by CMA. Lysates from SN4741 cells treated as described in (A) and (F) were analyzed for the PARK7 monomer and dimer by immunoblotting. The right graph shows the quantification of the monomeric and dimeric forms of PARK7 (mean ± SEM, n = 4; **, P < 0.01 compared with the control group and *, P < 0.05 compared with the indicated group).
Figure 4.
Figure 4.
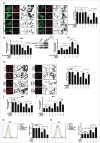
Regulation of mitochondria by CMA through PARK7. (Ato C) The effect of overexpression of PARK7 on shLamp2A- and MPP+-induced mitochondrial dysfunction. SN4741 cells transfected with control GFP or shLamp2a-GFP lentivirus were transfected with the control or PARK7 plasmids, treated with MPP+ (50 μM) for 24 h and analyzed (mean ± SEM; n = 3; *, P < 0.05; **, P < 0.01). For mitochondrial morphology, cells were stained with MitoTracker Red (10 nM) for 20 min at 33°C. Mitochondrial morphology in living SN4741 cells was analyzed by live-cell imaging (Nikon, C2 Si, Japan) (green, GFP; red, MitoTracker Red; insets represent boxed areas) using ImageJ 1.41 software (A). The right graph shows the form factor of mitochondria, which reflects the complexity and branching, calculated as (perimeter2)/(4π·surface area). For MMP, cells were incubated with TMRE (200 nM) for 20 min at 33°C. Ten thousand cells were assayed for TMRE fluorescence by flow cytometry (B). For ROS levels, cells were incubated with CellROX→ Deep Red Reagent (2.5 μμ). Ten thousand cells were assayed for CellROX→ Deep Red Reagent fluorescence by flow cytometry (C). Scale bar: 50 μm. (Dto F) The effect of downregulation of PARK7 on LAMP2A-induced protection of mitochondria. SN4741 cells transfected with the control or LAMP2A plasmid with or without siRNA oligonucleotides for Park7 were treated with MPP+ (50 μM) for 24 h. Mitochondrial functions were assayed as described in (Ato C) (mean ± SEM; n = 3; *, P < 0.05; **, P < 0.01). Scale bar: 50 μm. (G and H) The effect of overexpressing PARK7 QE→AA on MMP (G) and ROS (H) under oxidative stress. SN4741 cells were transfected with the indicated plasmids and treated with MPP+ for 24 h. MMP and ROS were assayed as described as above. Right graphs show the quantifications (mean ± SEM; n = 3; *, P < 0.05; **, P < 0.01).
Figure 5.
Figure 5.
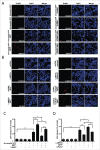
Modulation of the SN4741 cell viability by the CMA-PARK7 pathway. (A and B) The effect of modulating LAMP2A or PARK7 on MPP+-induced cellular apoptosis by TUNEL. SN4741 cells treated as in Fig. 4A or 4D were stained for TUNEL (mean ± SEM; n = 3). The numbers in the TUNEL panels indicate the ratio of TUNEL-positive cells/total cells. Scale bar: 100 μm. (C and D) The effect of modulating LAMP2A or PARK7 on MPP+-induced cell death by LDH release assay. SN4741 cells treated as described in (A and B) were assessed for cytotoxicity by LDH release assay (mean ± SEM; n = 3; *, P < 0.05; **, P < 0.01).

Similar articles

Cited by

References

    1. Fearnley JM, Lees AJ. Ageing and Parkinson's disease: substantia nigra regional selectivity. Brain 1991; 114:2283-301; PMID:1933245; http://dx.doi.org/10.1093/brain/114.5.2283 - DOI - PubMed
    1. Henchcliffe C, Beal MF. Mitochondrial biology and oxidative stress in Parkinson disease pathogenesis. Nat Clin Pract Neurol 2008; 4:600-9; PMID:18978800; http://dx.doi.org/10.1038/ncpneuro0924 - DOI - PubMed
    1. Balch WE, Morimoto RI, Dillin A, Kelly JW. Adapting proteostasis for disease intervention. Science 2008; 319:916-9; PMID:18276881; http://dx.doi.org/10.1126/science.1141448 - DOI - PubMed
    1. Komatsu M, Waguri S, Chiba T, Murata S, Iwata J-i, Tanida I, Ueno T, Koike M, Uchiyama Y, Kominami E, et al.. Loss of autophagy in the central nervous system causes neurodegeneration in mice. Nature 2006; 441:880-4; PMID:16625205; http://dx.doi.org/10.1038/nature04723 - DOI - PubMed
    1. He L-q, Lu J-h, Yue Z-y. Autophagy in ageing and ageing-associated diseases. Acta Pharmacol Sin 2013; 34:605-11; PMID:23416930; http://dx.doi.org/10.1038/aps.2012.188 - DOI - PMC - PubMed

Publication types

MeSH terms