. 2016 May 24;113(21):E2935-44.
doi: 10.1073/pnas.1522367113. Epub 2016 May 9.

Blockage of neddylation modification stimulates tumor sphere formation in vitro and stem cell differentiation and wound healing in vivo

Affiliations

Blockage of neddylation modification stimulates tumor sphere formation in vitro and stem cell differentiation and wound healing in vivo

Xiaochen Zhou et al. Proc Natl Acad Sci U S A. .

Abstract

MLN4924, also known as pevonedistat, is the first-in-class inhibitor of NEDD8-activating enzyme, which blocks the entire neddylation modification of proteins. Previous preclinical studies and current clinical trials have been exclusively focused on its anticancer property. Unexpectedly, we show here, to our knowledge for the first time, that MLN4924, when applied at nanomolar concentrations, significantly stimulates in vitro tumor sphere formation and in vivo tumorigenesis and differentiation of human cancer cells and mouse embryonic stem cells. These stimulatory effects are attributable to (i) c-MYC accumulation via blocking its degradation and (ii) continued activation of EGFR (epidermal growth factor receptor) and its downstream pathways, including PI3K/AKT/mammalian target of rapamycin and RAS/RAF/MEK/ERK, via inducing EGFR dimerization. Finally, MLN4924 accelerates EGF-mediated skin wound healing in mouse and stimulates cell migration in an in vitro culture setting. Taking these data together, our study reveals that neddylation modification could regulate stem cell proliferation and differentiation and that a low dose of MLN4924 might have a therapeutic value for stem cell therapy and tissue regeneration.

Keywords: EGFR; MLN4924; neddylation; stem cell; wound healing.


Conflict of interest statement

The authors declare no conflict of interest.

Figures

Fig. S1.
Fig. S1.
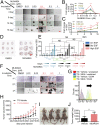
MLN4924 stimulates TS formation and in vivo tumorigenesis. (A and B) Effect on cell proliferation, assayed by ATPLite. H1299 cells (A) and multiple lines of human cancer cells (B) were plated in a 96-well plate for attached growth in RPMI 1640 supplemented with 1% and 10% (vol/vol) FBS or without FBS and treated with vehicle or the indicated concentration of MLN4924. Proliferation was assessed by ATPLite assay after 72 h. Fold-changes in cell growth were calculated by arbitrarily setting the vehicle as 1 and were plotted against dose. (C) Effect on cell proliferation, assayed by Trypan blue exclusion counting. H1299 cells were plated in six-well plate in serum-free RPMI 1640 and treated with or without 0.1 μM MLN4924 for 72 h. Cells were harvested, disassociated, stained with Trypan blue dye, and counted by hemocytometer. (D and E) Effect on TS formation, assayed by IHC. H1299 TSs cultured in vehicle or 0.1 μM MLN4924 were harvested and sectioned for Ki67 staining (D). Number of Ki67+ cells in 10 randomly selected sections from different spheres in the vehicle or 0.1-μM MLN4924-treated group was counted and divided by the sum of areas of the 10 sections from their respective group (E). (Scale bar, 50 μm.) (F) Effect on TS formation in multiple lines of human cancer cells. Indicated cancer cell lines were plated at clonal density in TS medium in 24-well ULA plates and treated with indicated concentrations of MLN4924. SSSs were documented at 16 d. Fold-change in SSSs was calculated by arbitrarily setting the SSS of vehicle-treated wells as 1 and was plotted against dose. (G) Value of SSS of serial TS formation assay. Primary TSs (first) were generated by culturing H1299 in TS medium (500 cells per 2 mL TS medium per well) and were treated with the indicated concentration of MLN4924 for 16 d. Primary TSs from 0.1-μM MLN4924-treated groups were harvested, disassociated, and replated at the same cell density to generate secondary (second) TSs for 16 d. Tertiary (third) TSs were generated from 0.1-μM MLN4924-treated secondary TSs in the same way. SSSs were documented at 4-d intervals. (H) Effect on CD44 staining in monolayer cultured cells. H1299 cells cultured in monolayer vehicle or 0.1 μM MLN4924 for 72 h were harvested, disassociated, stained with anti–CD44-Alexa700, and analyzed by FACS. Unstained cells from both groups served as control. (I and J) In vivo growth of TS-derived tumor cells in nude mice. H1299 TSs cultured in vehicle or 0.1 μM MLN4924 for 8 d were harvested, disassociated, and 1:1 mixed with matrigel, before being injected subcutaneously in the left or right flank region, respectively (50,000 cells per injection for both groups). Tumor volumes were measured in 3-d intervals (I). Weights of explanted tumors from both groups were measured at the end of the experiment (J). Shown are mean ± SEM (n = 5).
Fig. 1.
Fig. 1.
MLN4924 stimulates TS formation and in vivo tumorigenesis. (A–C) H1299 TS formation assay. H1299 cells were plated at clonal density in the TS medium in 24-well ULA plates and treated with the indicated concentration of MLN4924 for up to 16 d. Representative pictures were taken (A) and SSSs were documented at 4-d intervals. Fold-changes in SSSs were calculated by arbitrarily setting the SSS of vehicle treated wells as 1 and were plotted against dose (B) and time (C). (D) Ki67 staining of H1299 TS. H1299 TS cultured in DMSO (vehicle control) and 0.1 μM MLN4924 were harvested and sectioned for Ki67 staining. (E) Effect of MLN4924 on TS formation in the presence or absence of EGF. H1299 cells were plated for TS formation in TS medium supplemented with 20 ng/mL EGF (Std, black), 1,000 ng/mL EGF (High, pink), or without EGF (w/o, blue) and treated with (sliced columns) or without 0.1 μM MLN4924 (solid columns) for up to 16 d. Columns represented fold-change in SSSs at 4, 8, 12, and 16 d by arbitrarily setting the SSS of “Std, 4 day, without MLN4924” as 1. (F) Serial TS formation assay of H1299 cells. Primary TSs (first) were generated by culturing H1299 in TS medium (500 cells per 2 mL TS medium per well) and were treated with the indicated concentration of MLN4924 for 16 d. Primary TSs from 0.1 μM MLN4924-treated groups were harvested, disassociated, and replated at the same cell density to generate secondary (second) TSs for 16 d. Tertiary (third) TSs were generated from 0.1 μM MLN4924-treated secondary TSs in the same way. (G) Effect on CD44 staining in H1299 TSs. H1299 TSs cultured in monolayer vehicle or 0.1 μM MLN4924 for 8 d were harvested, disassociated, and stained with anti–CD44-Alexa700 and analyzed by FACS. Unstained cells from both groups served as control. (H–J) H1299 xenograft assays in nude mice. After being mixed with vehicle or 0.1 μM MLN4924, H1299 cells (5 × 10⁵) were immediately injected subcutaneously in the left or right flank region, respectively. Tumor volumes were measured at 3-d intervals (H). Mice were euthanized at 50 d postinjection (I). Weights of tumors from both groups were measured at the end of this experiment (J). Error bars represent the SEM (n = 8). (Scale bars, 500 μm.)
Fig. 2.
Fig. 2.
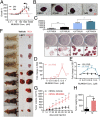
MLN4924 stimulates proliferation of mESCs both in vitro and in vivo. (A) Proliferation assay of mESCs in feeder-free maintenance culture. mESCs were plated in DMEM supplemented with 15% FBS and LIF in 96-well plates and treated with vehicle or the indicated concentration of MLN4924 for up to 48 h. Cell proliferation was assessed by ATPLite assay at 24-h intervals. Fold-change in cell growth was calculated by arbitrarily setting the vehicle as 1 and was plotted against dose. (B) Proliferation assay of mESCs in MEF-feeder culture. mESCs were plated at clonal density (400 cells per well in six-well plates) in MEF-feeder culture supplemented with 15% FBS and treated with vehicle or the indicated concentration of MLN4924 for 120 h. AP staining was used to visualize undifferentiated colonies of mESCs (red stain). (C) Proliferation assay of mESCs in feeder-free attached culture in both self-renew and differentiation conditions. mESCs were plated at clonal density (400 cells per well in six-well plates) in DMEM (15% FBS) supplemented with or without LIF and treated with vehicle or the indicated concentration of MLN4924 for 120 h. AP staining was used to visualize differentiated (weak, disperse staining) and undifferentiated cells (strong, concentrated staining). ATPLite was used to assess cell proliferation on parallel-cultured unstained cells. (D and E) EB formation assay. mESCs were plated at clonal density in DMEM supplemented with 3% FBS, 15% FBS (E), or without FBS (D) in 24-well ULA plates and treated with the indicated concentration of MLN4924 for 4 d or 16 d, respectively. Fold-change in SSSs was calculated by arbitrarily setting the SSS of vehicle-treated wells as 1 and was plotted against dose. (F–H) mESC xenograft/teratoma assays in nude mice. After being mixed with vehicle or 0.1 μM MLN4924, mESC cells (1 × 10⁵) were immediately injected subcutaneously in the left or right flank region, respectively. Tumor volumes were measured at 3-d intervals (G). Mice were euthanized at day 35 postinjection (F). Tumor weights from both groups were measured at the end of the experiment (H). Length of the side of the smallest square in F is 0.5 cm. Error bars represent the SEM (n = 9). (Scale bars, 500 μm.)
Fig. S2.
Fig. S2.
MLN4924 stimulates proliferation of mESCs both in vitro and in vivo. (A) Effect on feeder layer growth. mESCs were plated at clonal density (400 cells per well in a six-well plate) in feeder layer culture supplemented with 15% FBS and treated with vehicle or indicated concentrations of MLN4924 for 120 h, followed by AP staining. Sum of areas of colonies were measured and calculated by computer-based imaging software with the function of taking live measurements (NIS Elements BR). Shown are mean ± SEM (n = 3). (B) Effect on EB formation. mESCs were plated at clonal density in TS medium or DMEM supplemented with 3% or 15% FBS in 24-well ULA plates and treated with indicated concentrations of MLN4924 for 4 d (15% FBS) or 16 d (3% FBS, and TS medium). Representative pictures were taken at 4 d. (Scale bar, 500 μm.) (C) H&E staining of teratomas derived from subcutaneously implanted mESCs mixed with 0.1 μM MLN4924. Teratomas were fixed and processed by H&E staining. Tissues resembling characteristics of three germ layers were found (arrows): (a) neuronal rosettes (ectoderm), (b) squamous epithelium (ectoderm), (c) cartilage (mesoderm), (d) striated muscle (mesoderm), (e) gut-like structure lined with mucinous epithelium (endoderm), and (f) glands (endoderm). (Scale bar, 50 μm.)
Fig. 3.
Fig. 3.
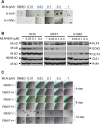
The stimulatory effect of MLN4924 is partially mediated by c-MYC. (A) MLN4924 enhanced c-MYC levels in H125, MCF7, and H1299 cells dose-dependently. Cells were treated with vehicle (–) or 0.03, 0.1, and 0.3 μM MLN4924 for 24 h before being harvested for Western blot detection of c-MYC. (B) Knockdown of c-MYC in H1299. H1299 cells were transfected with 20 nM of scrambled siRNA (–) or siRNA targeting c-MYC (+) before being treated with vehicle (–) or 0.1 μM and 0.3 μM MLN4924 for 24 h. Western blot was used to detect c-MYC levels. LE, long exposure; SE, short exposure. (C) H1299 TS formation assay with c-MYC knockdown. H1299 cells were transfected with 20 nM of scrambled siRNA (si-Cont) or siRNA targeting c-MYC (+) before being plated for TS formation assay and treated with the indicated concentration of MLN4924 for 16 d. Fold-change in SSSs was calculated by arbitrarily setting the SSS of vehicle-treated wells from each group as 1 and was plotted against dose. (D) Effect of FBW7 knockout on c-MYC levels in the presence or absence of MLN4924. Two isogenic HCT116 cells (FBW7+/+ and FBW7−/−) treated with vehicle (–) or 0.01, 0.03, 0.1, and 0.3 and 1 μM MLN4924 for 24 h before being harvested for Western blot detection of c-MYC and Nrf2. (E) HCT116 (FBW7+/+ and FBW7−/−) TS formation assay. The two isogenic cells were plated at clonal density in TS medium in 24-well ULA plates and treated with the indicated concentration of MLN4924 for up to 12 d. SSSs were documented at 4-d intervals. Fold-change in SSSs was calculated by arbitrarily setting the SSS of vehicle-treated samples from each cell line as 1 and was plotted against dose.
Fig. S3.
Fig. S3.
Involvement of c-MYC and FBXW7 in MLN4924-induced TS formation. (A) Partial rescue by c-Myc knockdown. H1299 cells were transfected with scrambled siRNA or 20 nM siRNA targeting c-MYC, followed by TS formation assay in the presence of indicated concentrations of MLN4924 for 16 d. Shown are representative photos of spheres. (B) Expression of other iPS (induced pluripotent stem cell) factors. Three lines of human cancer cells were treated with various concentrations of MLN4924 for 24 h, followed by Western blot. (C) Effect of FBXW7. Isogenic HCT116 cells (FBXW7+/+ and FBXW7−/−) were plated at clonal density in TS medium in 24-well ULA plates and treated with indicated concentrations of MLN4924 for up to 12 d. Shown are representative photos of spheres taken at 4-d intervals. (Scale bars, 500 μm.)
Fig. 4.
Fig. 4.
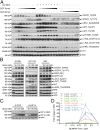
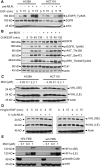
MLN4924 activates EGFR and its downstream signaling pathways. (A) MLN4924 enhanced and prolonged EGF-mediated activation of EGFR and its downstream pathways. H1299 cells were serum-starved for 24 h, followed by treatment with vehicle (–) or 0.1 μM MLN4924 (+) for another 24 h (pre-MLN). Cells were then stimulated with 10 ng/mL EGF or 0.1 μM MLN4924 for 2 min, 4 min, 8 min, 16 min, 32 min, 64 min, 128 min, and 256 min and harvested for Western blot. LE, long exposure; SE, short exposure. (B) MLN4924 alone activated EGFR and its downstream signaling pathways. H1299, HCT116, and U87 cells were serum-starved for 24 h, followed by treatment with vehicle (–) or the indicated concentration of MLN4924 for another 24 h. Cells were then harvested and analyzed by Western blot. (C) Knockdown of HIF1α in H1299. H1299 cells were transfected with 20 nM of scrambled siRNA, or siRNA targeting HIF1α, before being treated with vehicle (0) or 0.1 μM, 0.3 μM, or 1 μM MLN4924 for 24 h. Western blot was used to detect HIF1α levels. (D) H1299 TS formation assay with HIF1α knockdown. H1299 cells were transfected with 20 nM of scrambled siRNA (si-Cont), or siRNA targeting HIF1α (si-HIF1α), before being plated for TS formation assay and treated with vehicle or the indicated concentration of MLN4924 for 16 d. Fold-change in SSSs was calculated by arbitrarily setting the SSS of vehicle-treated wells from each group as 1 and was plotted against dose.
Fig. S4.
Fig. S4.
MLN4924 activates EGFR and its downstream signaling pathways. (A) MLN4924 enhanced EGF-mediated EGFR phosphorylation. H1299 and HCT116 cells were serum-starved for 24 h, followed by treatment with vehicle (–) or 0.1 μM MLN4924 (+) for another 24 h (pre-MLN). Cells were then stimulated with 10 ng/mL EGF for 5 min and 15 min and subjected to Western blotting using indicated antibodies. (B) MLN4924 blocked EGF-induced EGFR degradation. H1299 cells were serum-starved for 24 h and treated with vehicle (–) or 0.1 μM MLN4924 (+) for another 24 h (pre-MLN). Cells were then treated with 10 ng/mL EGF and 100 μg/mL CHX for 5 min, 15 min, 45 min, and 135 min and harvested for Western blotting using the indicated Abs. (C and D) MLN4924 has no effect on VHL levels. H1299 and HCT116 cells were treated with various concentrations of MLN4924 for 24 h or EGF for the indicated time period alone or in combination. Cells were then subjected to Western blotting, using Ab against VHL. LE, long exposure; SE, short exposure. (E) Induction of HIF1α accumulation. H1299 cells were treated with vehicle (–) or MLN4924 (0.1 μM, 0.3 μM, and 1 μM) for 24 h at 10% and 0% FBS, followed by Western blot to detect the levels of HIF1α. For the “w/o FBS” group, cells were serum-starved for 24 h first before being subjected to vehicle (–) or MLN4924 (0.1 μM, 0.3 μM, and 1 μM) treatment for another 24 h in medium without any serum supplement. LE, long exposure; SE, short exposure.
Fig. 5.
Fig. 5.
MLN4924-induced EGFR activation is independent of c-Cbl but is associated with receptor dimerization. (A) c-Cbl has a minimal effect on MLN4924-induced EGFR accumulation. H1299 cells were first transfected with scrambled siRNA (si-Cont) or siRNA targeting c-Cbl (si-c-Cbl), followed by serum starvation for 24 h, and subsequent treatment with vehicle (–) or the indicated concentration of MLN4924 for another 24 h. Cells were then harvested for Western blot. (B) MLN4924 induces EGFR dimerization. H1299 and HCT116 cells were serum-starved for 24 h and then treated with DMSO vehicle control or 0.1 µM MLN4924 for 1 h or 24 h in the presence of the protein cross-linking agent DSS in the last 30 min. For positive control, serum-starved cells were treated with EGF (10 ng/mL) for 30 min in combination with DSS. A combination of MLN4924 and EGFR was also included. Cell lysates were then prepared for Western blot. The band density was quantified using Image J software. Shown are mean ± SEM from three independent experiments. (C) PLA assay to measure EGFR dimerization. EGFR-null CHO cells were cotransfected with plasmids expressing EGFR-MYC and EGFR-FLAG and then seeded in coverslips for treatment with MLN4924 or EGF alone or in combination. The slides were stained with primary antibody, followed by staining using the In Situ-Fluorescence kit. Cell images were acquired, and positive-stained cells were quantified. Shown are mean ± SEM from three independent experiments.
Fig. S5.
Fig. S5.
MLN4924-induced EGFR activation is independent of c-Cbl and VHL. (A) c-Cbl has minimal effect on MLN4924-induced EGFR turnover. H1299 cells were first transfected with siRNA targeting c-Cbl or siCont control, followed by serum starvation for 24 h, and subsequent treatment with vehicle (–) or 0.1 μM MLN4924 for another 24 h. Cells were then treated with 10 ng/mL EGF and 100 μg/mL CHX for 5 min and 15 min, and harvested for Western blotting, using the indicated Abs. (B) Effect on CETSA of EGFR. H1299 were serum-starved for 24 h and pretreated with 10 μM MLN4924 for 1 h before being subjected to thermo-treatment (43 °C, 45 °C, 47 °C, 49 °C, and 51 °C) as described in Materials and Methods. Samples were then analyzed by Western blot using the indicated Abs. (C) Expression of isotope-tagged EGFR. CHO cells were transfected with MYC- or FLAG-tagged EGFR, followed by immunofluorescent staining and photography. (Magnification: 40×.)
Fig. 6.
Fig. 6.
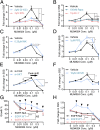
Blockage of TS-stimulating effect of MLN4924 via pharmacological or genetic approaches. (A) Targeting EGFR. H1299 cells were plated for TS formation assay and treated with the indicated concentration of MLN4924 in the presence or absence of CI-1033 (2 μM) or Erlotinib (ERL, 3 μM). Fold-change in SSSs was calculated by arbitrarily setting the SSS of vehicle-treated cells from each group as 1 and was plotted against dose. (B–D) Targeting the PI3K/AKT/mTORC1 axis. H1299 cells were plated for TS formation assay and treated with indicated concentrations of MLN4924 in the presence or absence of Rapamycin (Rapa, 100 nM), LY294002 (LY, 10 μM), MK2206 (MK, 0.25 μM), or Perifosine (PFS, 1 μM). Results were presented as described in A. (E) Targeting total AKT via siRNA. H1299 cells were transfected with scrambled siRNA (si-Cont) or 20 nM siRNA targeting AKT (si-AKT), followed by TS formation assay in the presence of indicated concentrations of MLN4924 for 4 d. Results were presented as described in A. (F) Targeting MAPK. H1299 cells were subjected to TS formation assay with MLN4924 stimulation in the presence or absence of MAPK inhibitor U0126 (10 µM). Results were presented as described in A. (G and H) Effect of ectopic expression of EGFR. EGFR-null CHO cells or colon cancer SW620 cells were transfected with wild-type EGFR and an EGFR dead mutant K721M. CHO cells were subjected to ATPLite proliferation assay after treatment with indicated concentrations of MLN4924 for 72 h (G), whereas SW620 cells were subjected to TS formation assay after treatment with indicated concentrations of MLN4924 for 4 d (H). Results were presented as described in A.
Fig. S6.
Fig. S6.
Blockage of TS-stimulating effect of MLN4924 via pharmacological or genetic approaches. (A and B) Targeting EGFR, PI3K, or mTORC1. H1299 cells were plated for TS formation assay treated with indicated concentrations of MLN4924 in the presence or absence of the indicated concentrations of EGFR inhibitor CI-1033 or Erlotinib (A) or LY294002 or Rapamycin (B). Shown are representative photos of spheres taken at day 8 (for CI-1033 or Erlotinib) or at day 4 (for LY294002 or Rapamycin). (C–E) Targeting AKT. H1299 cells were plated and treated with indicated concentrations of MLN4924 in the presence or absence of indicated concentrations of MK2206 for TS formation assay (C) or Western blot (D) or Perifosine for TS formation assay (E). Shown are representative photos of spheres taken at day 8. (F) Target total AKT via siRNA. H1299 cells were transfected with scrambled siRNA (si-Cont) or 100 nM siRNA targeting AKT (si-AKT), followed by Western blot or TS formation assay in the presence of the indicated concentrations of MLN4924 for 4 d. Shown are representative photos of spheres taken at day 4. (G) Targeting MAPK. H1299 cells were plated for TS formation assay treated with the indicated concentrations of MLN4924 in the presence or absence of 10 μM U0126. Shown are representative photos of spheres taken at day 8. (H) Overexpressing wild-type EGFR (WT) and kinase dead mutant EGFR (K721M) in EGFR-null CHO and SW620 cells. CHO and SW620 cells were transfected with EGFR WT and EGFR K721M constructs. Expression of EGFR WT and mutant were confirmed by Western blot. (I) Effect of ectopic expression of EGFR. EGFR-null SW620 cells were transfected with wild-type EGFR and an EGFR dead mutant K721M and subsequently subjected to TS formation assay treated with indicated concentrations of MLN4924 for 4 d. Shown are representative photos of spheres taken at day 4. (Scale bars, 500 μm.)
Fig. 7.
Fig. 7.
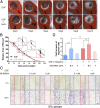
MLN4924 promotes EGF-induced skin wound healing and cell migration. (A) Surgical creation of full-thickness skin wound and measurement/calculation of RAW. Words in red are software-measured pixel areas of actual wounds and the standard hole on the red silicon film. See SI Materials and Methods for details. (B) MLN4924 promoted EGF-induced healing of skin wound. RAWs of wounds treated with EGF plus vehicle (EGF) or EGF plus MLN4924 (EGF+MLN) were plotted against time. Shown are mean ± SEM (n = 11). (C and D) MLN4924 promoted migration of BEAS2B cells in an in vitro scratch assay. BEAS2B cells with a linear wound made by 200-μL pipette tips were then treated with various treatments as indicated while grown in 0% serum for 24 h. Cells were fixed, stained with 1% Toluidine and 1% Borax for 20 min, and photographed (C). Number of cells migrating into scratched space was counted. The data were expressed as fold increase of migrated cells compared with vehicle control. Shown are mean ± SEM from three independent experiments (D). (Scale bar, 100 μm.)
Fig. S7.
Fig. S7.
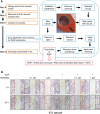
Protocol for skin wound healing assay in mouse. (A) Flowchart of protocol for mouse skin wound healing assay. See Materials and Methods for details. (B) MLN4924 at low concentration stimulates migration of BEAS-2B cells. In confluent BEAS-2B cells cultured in coverslips, a linear wound was generated in the monolayer with sterile 200-μL pipette tips. Cells were cultured in 4% (vol/vol) serum and treated with MLN4924 or EGF alone or in combination for 24 h, followed by staining and photographing. (Scale bar, 100 μm.)
Fig. 8.
Fig. 8.
Mechanism of MLN4924 action. Proposed mechanisms of how MLN4924 promotes cell proliferation. (A) Inactivation of CRL1. MLN4924 causes accumulation of oncoprotein c-MYC, which promotes proliferation of both normal and cancer-initiating cells. (B) Induction of EGFR dimerization. MLN4924 induces EGFR dimerization and stabilizes EGFR on the cellular membrane to activate multiple downstream pathways for proliferation.

Similar articles

Cited by

References

    1. Ciechanover A. The ubiquitin-proteasome pathway: On protein death and cell life. EMBO J. 1998;17(24):7151–7160. - PMC - PubMed
    1. Hershko A. The ubiquitin system for protein degradation and some of its roles in the control of the cell division cycle. Cell Death Differ. 2005;12(9):1191–1197. - PubMed
    1. Ciechanover A. Intracellular protein degradation: From a vague idea through the lysosome and the ubiquitin-proteasome system and onto human diseases and drug targeting. Bioorg Med Chem. 2013;21(12):3400–3410. - PubMed
    1. Orlowski RZ, Kuhn DJ. Proteasome inhibitors in cancer therapy: Lessons from the first decade. Clin Cancer Res. 2008;14(6):1649–1657. - PubMed
    1. Teicher BA, Ara G, Herbst R, Palombella VJ, Adams J. The proteasome inhibitor PS-341 in cancer therapy. Clin Cancer Res. 1999;5(9):2638–2645. - PubMed

Publication types