. 2016 May 9;29(5):697-710.
doi: 10.1016/j.ccell.2016.03.003. Epub 2016 Apr 14.

An Arntl2-Driven Secretome Enables Lung Adenocarcinoma Metastatic Self-Sufficiency

Affiliations

An Arntl2-Driven Secretome Enables Lung Adenocarcinoma Metastatic Self-Sufficiency

Jennifer J Brady et al. Cancer Cell. .

Abstract

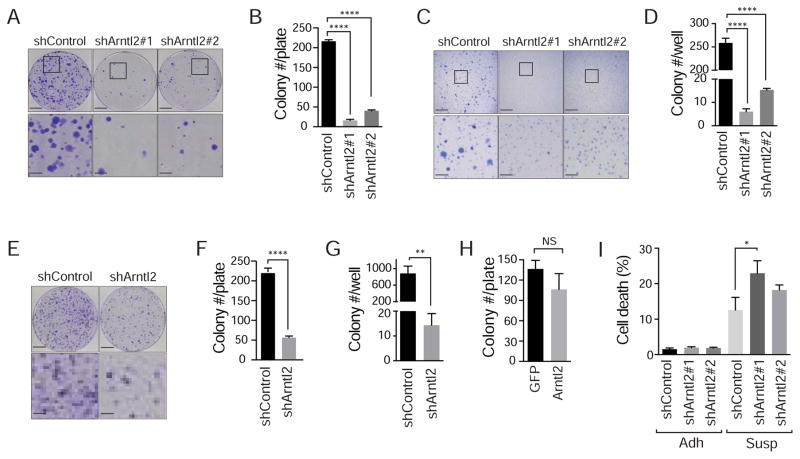
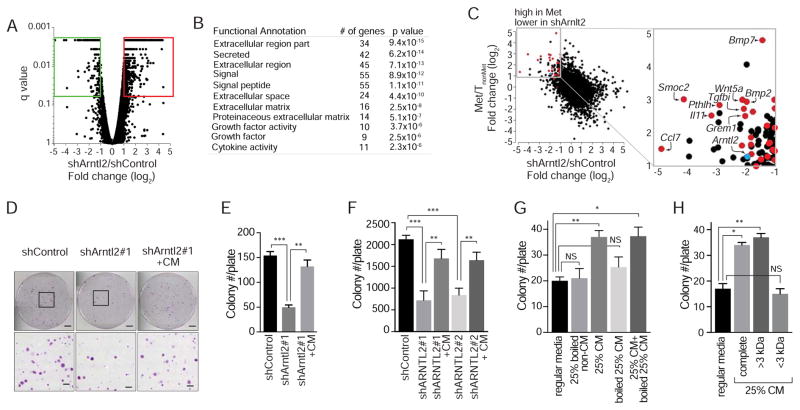
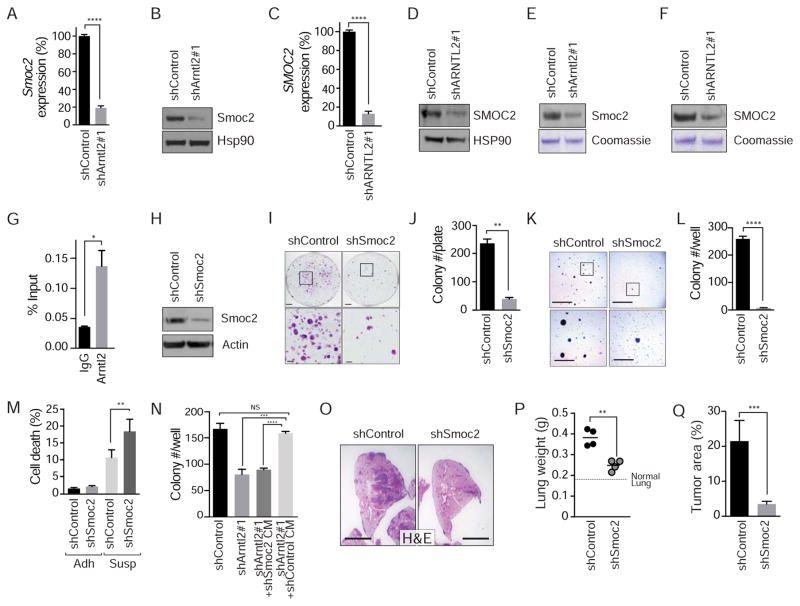
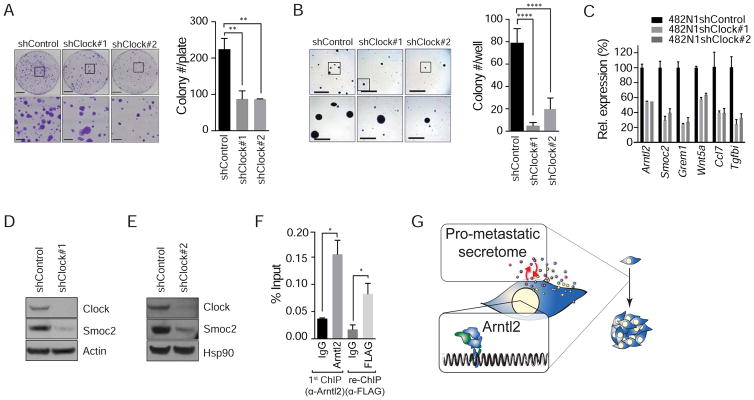
The ability of cancer cells to establish lethal metastatic lesions requires the survival and expansion of single cancer cells at distant sites. The factors controlling the clonal growth ability of individual cancer cells remain poorly understood. Here, we show that high expression of the transcription factor ARNTL2 predicts poor lung adenocarcinoma patient outcome. Arntl2 is required for metastatic ability in vivo and clonal growth in cell culture. Arntl2 drives metastatic self-sufficiency by orchestrating the expression of a complex pro-metastatic secretome. We identify Clock as an Arntl2 partner and functionally validate the matricellular protein Smoc2 as a pro-metastatic secreted factor. These findings shed light on the molecular mechanisms that enable single cancer cells to form allochthonous tumors in foreign tissue environments.


Conflict of interest statement

The authors declare no conflicts of interest.

Figures

Figure 1
Figure 1. Arntl2 is up-regulated in metastatic lung adenocarcinoma and high expression predicts poor lung adenocarcinoma patient outcome
A. Gene expression of Arntl2 in cell lines derived from metastatic primary lung tumors (T Met) and metastases (Met) relative to cell lines derived from non-metastatic primary lung tumors (TnonMet) from the KrasLSL-G12D/+;Trp53flox/flox (KP) mouse model. Each dot represents a cell line and the bar is the mean. * p value <0.05. B. qRT-PCR gene expression analysis for Arntl2 on purified neoplastic cells from defined genotypes and stages of cancer progression. KT tumors were taken from Trp53-sufficient KrasLSL-G12D/+;R26LSL-Tom mice. Expression is normalized to house keeping genes with the average of the TnonMet samples set to 1. C. Analysis of TCGA lung adenocarcinoma data to uncover the ability of each individual gene to predict patient outcome. Each dot is a gene and ARNTL2 is indicated. For genes on the upper left high expression predicts shorter survival. For genes on the upper right high expression predicts longer survival. D. ARNTL2 expression in human lung adenocarcinomas. Data from TCGA. The highest 10% (n=44) of patients are included. Hazard ratios (HR) and p values are shown. Median survival is indicated. E. Survival of Stage I human lung adenocarcinoma patients with high versus low ARNTL2 expression. Meta-analysis data from Gyorffy et al. F. Survival of human lung adenocarcinoma patients with high versus low ARNTL2 expressing tumors. Data from Shedden et al. See also Figure S1 and Table S1.
Figure 2
Figure 2. ARNTL2 expression is associated with poorly differentiated lung adenocarcinomas
A. qRT-PCR for Nkx2-1 and Arntl2 on ex vivo sorted cancer cells from KPT tumors and metastases. Note split scale for Arntl2. B. Western blot for Arntl2 on ex vivo sorted cancer cells from KPT mice. Representative of five metastases (Met) from three KPT mice. Actin shows loading. C. Expression of ARNTL2 and the lung differentiation marker NKX2-1/TTF1 in human lung adenocarcinoma. Each dot represents a lung adenocarcinoma from TCGA (n=230). D. ARTNL2 expression in human lung adenocarcinomas. Data from Shedden et al. The highest 20% of all samples are defined as ARNTL2high. Number of ARNTL2high/total tumors is shown. Percent of ARNTL2high tumors is shown in brackets. E. RNAscope-based ARNTL2 expression in human lung adenocarcinoma cells at low (top panel) and high (bottom panel) magnification. Hematoxylin counter-stained well-differentiated adenocarcinoma (left) and poorly differentiated adenocarcinoma (right) are shown. Top scale bars = 50 μm. Bottom scale bars = 25 μm. F. Quantification of ARNTL2 expression relative to cytological differentiation state. The highest 20% of all samples are defined as ARNTL2high. Number of ARNTL2high/total tumors is shown. Percent of ARNTL2high tumors is shown in brackets. See also Figure S2.
Figure 3
Figure 3. Arntl2 is required for lung adenocarcinoma metastatic ability
A. qPCR for Arntl2 expression in a metastasis-derived cell line (482N1) with or without knock-down of Arntl2 by two independent shRNAs, normalized to shControl and Gapdh. **** p value <0.0001. B. Western blot for Arntl2 protein levels in 482N1 cell lines, with or without Arntl2 knock-down. Actin shows loading. C. Representative histology of metastatic lung lesions three weeks after intravenous transplantation of 482N1 cell lines. Scale bars = 3 mm. D. Lung weight per mouse, measured three weeks after intravenous transplantation of 482N1 cell lines. Each dot represents a mouse and the bar is the mean. Normal lung weight is indicated. * p value <0.05; p value for shControl versus shArntl2#2 = 0.0606. E. Quantification of tumor area relative to total lung area. n > 4 mice/group. ** p value <0.005 ***; p value <0.001. F. 889DTC subcutaneous tumor growth in immune compromised NSG mice with or without Arntl2 knock-down. Subcutaneous tumor mass from three to five mice/group is shown. NS = not significant. G. Fluorescent dissecting scope images of whole lungs from immune compromised NSG mice with 889DTC subcutaneous tumors with or without Arntl2 knock-down (top). Representative histology images of lung lobes from the same NSG mice (bottom). Upper scale bars = 5 mm. Lower scale bars = 1 mm. H, I. Quantification of lung and liver metastasis number by counting surface tumors. ** p value <0.01; *** p value <0.001. Panels with error bars show the mean +/− SD. See also Figure S3.
Figure 4
Figure 4. Arntl2 is required, but not sufficient for clonal expansion of lung adenocarcinoma cells
A, B. 482N1 lung adenocarcinoma colony formation under low-density plating conditions (3x10³ cells/10 cm plate) with or without Arntl2 knock-down. Upper scale bars = 2 cm, lower scale bars 5 mm. **** p value <0.0001. C, D. 482N1 lung adenocarcinoma cell growth in anchorage-independent conditions (soft agar) with or without Arntl2 knock-down. Upper scale bars = 5 mm. Lower scale bars = 1.5 mm. **** p value <0.0001. E, F. 889DTC lung adenocarcinoma colony formation under low-density plating conditions (3x10³ cells/10 cm plate) with or without Arntl2 knock-down. Upper scale bars = 2 cm, lower scale bars 5 mm. **** p value <0.0001. G. 889DTC lung adenocarcinoma cell growth in anchorage-independent conditions (soft agar) with or without Arntl2 knock-down. ** p value <0.01. H. Quantification of colony formation in low-density plating conditions of 394T4 (TnonMet) cells with or without over-expression of Arntl2. NS = not significant. I. Quantification of percent DAPIpositive dead cells after plating in adherent (Adh) and suspension (Susp) conditions of 482N1 cells with or without Arntl2 knock-down. * p value <0.05. Panels with error bars show the mean +/− SD. See also Figure S4.
Figure 5
Figure 5. ARNTL2 is required for clonogenic expansion of human lung adenocarcinoma cells
A. qPCR for ARNTL2 expression in control and knock-down H1792 cells, normalized to ACTIN. **** p value <0.0001. B. PrestoBlue assay for H1792 cell growth in standard culture conditions, with or without ARNTL2 knock-down. C, D. H1792 colony formation in anchorage-independent conditions (C) and low-density plating conditions (D) with or without ARNTL2 knock-down. * p value <0.05; ** p value <0.01. E. Quantification of percent DAPIpositive dead cells after plating in adherent (Adh) and suspension (Susp) conditions of H1792 cells with or without Arntl2 knock-down. *** p value <0.001. F. qPCR for ARNTL2 expression in control and knock-down H2009 cells, normalized to ACTIN. *** p value <0.001; **** p value <0.0001. G. PrestoBlue assay for H2009 cell growth in standard culture conditions with or without ARNTL2 knock-down. H. H2009 colony formation under low-density plating conditions, with or without ARNTL2 knock-down. *** p value <0.001. I. Quantification of percent DAPIpositive dead cells after plating in adherent (Adh) and suspension (Susp) conditions of H2009 cells with or without ARNTL2 knock-down. *** p value <0.001; * p value <0.05. Panels with error bars show the mean +/− SD. See also Figure S5.
Figure 6
Figure 6. Arntl2-regulated secreted factors drive clonal growth ability
A. RNA-seq on 482N1shControl and shArntl2 cells to identify differentially expressed genes. shArntl2 is an average of 482N1shArntl2#1 and 482N1shArntl2#2. B. GO term enrichment of secreted proteins down-regulated in shArntl2 cells. C. Gene expression difference between 482N1 Arntl2 knock-down and shControl cells plotted against gene expression difference between metastasis-derived and TnonMet-derived cell lines. Red dots are genes that encode secreted proteins. Blue dot is Arntl2 itself. Several top secreted factors are labeled. D, E. Colony formation by 482N1shArntl2 cells under low density plating conditions, quantified in (E). Upper scale bars = 2 cm. Lower scale bars = 1.5 mm. ** p value <0.01; *** p value <0.001. F. Colony formation by H1792 shControl or shARNTL2 cells under low-density plating conditions, with or without conditioned media (CM) from control cells. ** p value <0.01; *** p value <0.001. G. Colony formation by 482N1shArntl2#1 cells in low density plating conditions with or without boiled conditioned media. * p value <0.05; ** p value <0.01. H. Colony formation by 482N1 shArntl2#1 cells under low-density plating conditions with fractionated conditioned media (CM). * p value <0.05; ** p value <0.01. Panels with error bars show the mean +/− SD. See also Figure S6 and Table S2.
Figure 7
Figure 7. Arntl2-controlled expression of Smoc2 drives clonal growth and metastatic ability
A, B. Smoc2 expression at the RNA (A) and protein (B) level in 482N1 cells with or without Arntl2 knock-down. Gene expression normalized to Gapdh and shControl. Hsp90 shows loading. **** p value <0.0001. C. Western blot for Smoc2 protein levels in conditioned media (CM) derived from 482N1 cells with or without Arntl2 knock-down. Coomassie staining shows loading. D, E. Smoc2 expression at the RNA (D) and protein (E) level in H1792 cells with or without ARNTL2 knock-down. Gene expression normalized to ACTIN and shControl. HSP90 shows loading. **** p value <0.0001. F. Western blot for SMOC2 protein levels in conditioned media (CM) derived from H1792 cells with or without ARNTL2 knock-down. Coomassie staining shows loading. G. Chromatin immunoprecipitation of Arntl2 at the Smoc2 proximal promoter (Tile 11) in 482N1 lung adenocarcinoma cells. Data are normalized to input. H. Western blot for Smoc2 in the 482N1 cell line, with or without Smoc2 knock-down. Actin shows loading. I, J. 482N1 lung adenocarcinoma colony formation under low-density plating conditions (3x10³ cells/10 cm plate) with or without Smoc2 knock-down. Upper scale bars = 2 cm, lower scale bars = 5 mm. Quantified in (J). ** p value <0.01. K, L. 482N1 lung adenocarcinoma cell growth in anchorage-independent conditions with or without Smoc2 knock-down. Upper scale bars = 5 mm, lower scale bars = 1.5 mm. Quantified in (L). **** p value <0.0001. M. Quantification of percent DAPIpositive dead cells after plating in adherent (Adh) and suspension (Susp) conditions of 482N1 cells with or without Smoc2 knock-down. *** p value <0.001; * p value <0.05. N. Colony formation of 482N1shArntl2 cells under low-density plating conditions (1x10³ cells/6 well) with or without shSmoc2 conditioned media (CM). Upper scale bars = 5 mm, lower scale bars = 1.5 mm. O. Representative histology of metastatic lung lesions three weeks after intravenous transplantation of 482N1 cells. Scale bar = 3 mm. P. Total lung weight per mouse, measured three weeks after intravenous transplant of 482N1 cells, with or without Smoc2 knock-down. Each dot represents a mouse and the bar is the mean. Normal lung weight is indicated. ** p value <0.01. Q. Quantification of tumor area relative to total lung area. *** p value <0.001. Panels with error bars show the mean +/− SD. See also Figure S7.
Figure 8
Figure 8. Smoc2 expression is regulated by Arntl2, in association with Clock
A. 482N1 colony formation under low-density plating conditions (3x10³ cells/10 cm plate) with or without Clock knock-down. Upper scale bars = 2 cm, lower scale bars = 5 mm. ** p value <0.01. B. 482N1 colony formation in anchorage-independent conditions with or without Clock knock-down. Upper scale bars = 5 mm, lower scale bars = 1.5 mm. **** p value <0.0001. C. qPCR for expression of several Arntl2-regulated genes in Clock knock-down lung adenocarcinoma cells. All gene expression levels are significant at p value < 0.0001 relative to shControl and Gapdh. D, E. Western blot for Smoc2 protein expression in 482N1 Clock knock-down cell lines. Actin (D) or Hsp90 (E) show loading. F. Chromatin immunoprecipitation of Arntl2 at the Smoc2 proximal promoter (Tile 11), followed by re-ChIP for 3xFLAG-Clock in 482N1 cells overexpressing 3xFLAG-Clock. * p value < 0.05. G. Model in which high levels of Arntl2 drive the expression of a pro-metastatic secretome which increases the metastatic ability of single lung adenocarcinoma cells within a foreign environment. Panels with error bars show the mean +/− SD. See also Figure S8.

Similar articles

Cited by

References

    1. Aceto N, Bardia A, Miyamoto DT, Donaldson MC, Wittner BS, Spencer JA, Yu M, Pely A, Engstrom A, Zhu H, et al. Circulating Tumor Cell Clusters Are Oligoclonal Precursors of Breast Cancer Metastasis. Cell. 2014;158:1110–1122. - PMC - PubMed
    1. Bafico A, Liu G, Goldin L, Harris V, Aaronson SA. An autocrine mechanism for constitutive Wnt pathway activation in human cancer cells. Cancer Cell. 2004;6:497–506. - PubMed
    1. Blanco MA, LeRoy G, Khan Z, Ale3kovi3 M, Zee BM, Garcia BA, Kang Y. Global secretome analysis identifies novel mediators of bone metastasis. Cell Res. 2012;22:1339–1355. - PMC - PubMed
    1. Bo H, Zhang S, Gao L, Chen Y, Zhang J, Chang X, Zhu M. Upregulation of Wnt5a promotes epithelial-to-mesenchymal transition and metastasis of pancreatic cancer cells. BMC Cancer. 2013;13:496. - PMC - PubMed
    1. Bunger MK, Wilsbacher LD, Moran SM, Clendenin C, Radcliffe LA, Hogenesch JB, Simon MC, Takahashi JS, Bradfield CA. Mop3 is an essential component of the master circadian pacemaker in mammals. Cell. 2000;103:1009–1017. - PMC - PubMed

Publication types

MeSH terms