

Metabolic acceleration and the evolution of human brain size and life history
- PMID: 27144364
- PMCID: PMC4942851
- DOI: 10.1038/nature17654
Metabolic acceleration and the evolution of human brain size and life history
Abstract
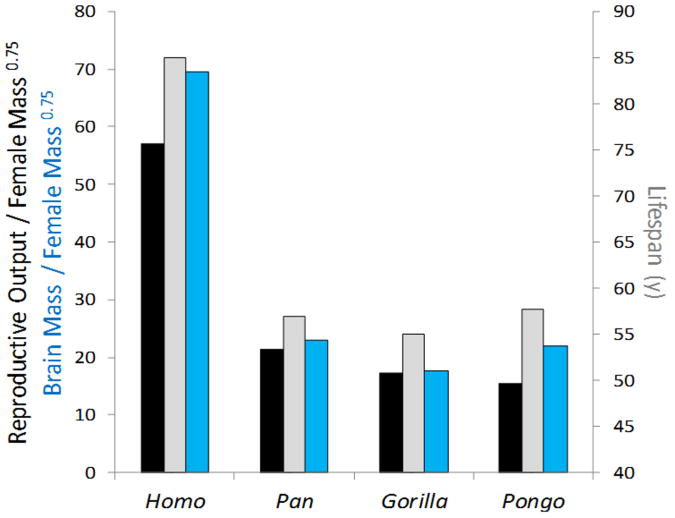
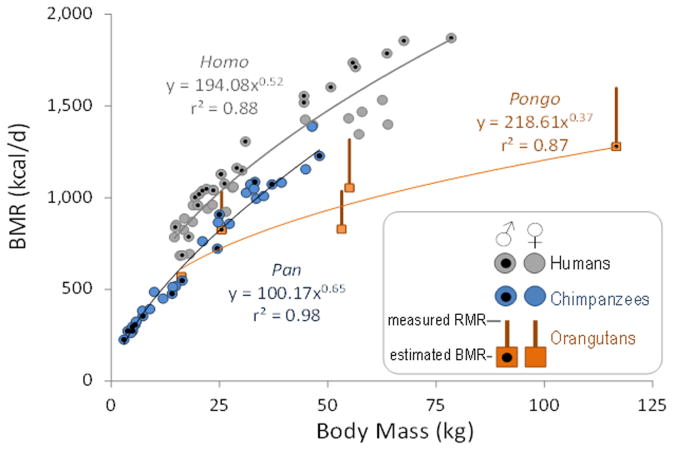
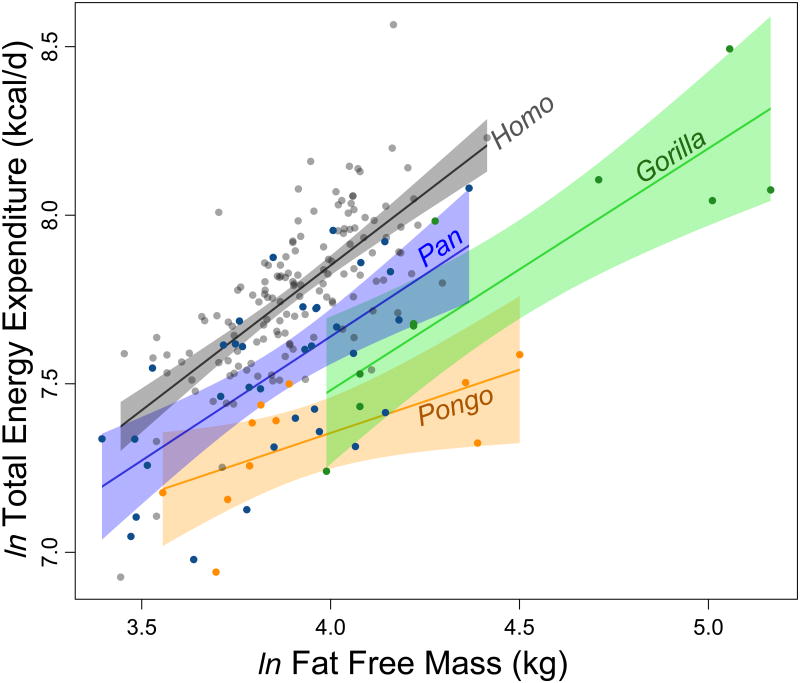
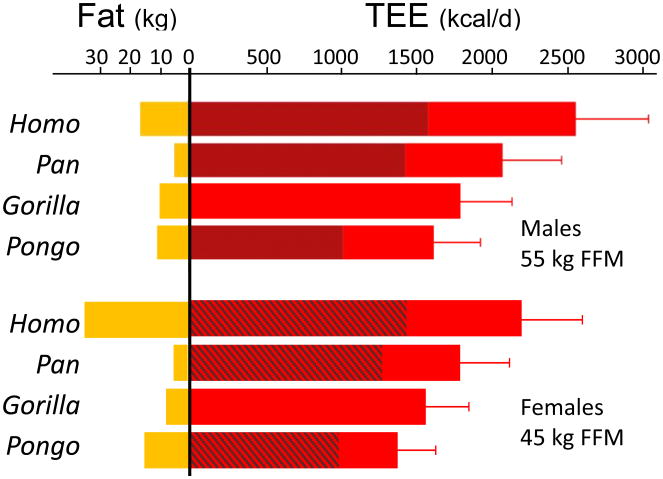
Humans are distinguished from the other living apes in having larger brains and an unusual life history that combines high reproductive output with slow childhood growth and exceptional longevity. This suite of derived traits suggests major changes in energy expenditure and allocation in the human lineage, but direct measures of human and ape metabolism are needed to compare evolved energy strategies among hominoids. Here we used doubly labelled water measurements of total energy expenditure (TEE; kcal day(-1)) in humans, chimpanzees, bonobos, gorillas and orangutans to test the hypothesis that the human lineage has experienced an acceleration in metabolic rate, providing energy for larger brains and faster reproduction without sacrificing maintenance and longevity. In multivariate regressions including body size and physical activity, human TEE exceeded that of chimpanzees and bonobos, gorillas and orangutans by approximately 400, 635 and 820 kcal day(-1), respectively, readily accommodating the cost of humans' greater brain size and reproductive output. Much of the increase in TEE is attributable to humans' greater basal metabolic rate (kcal day(-1)), indicating increased organ metabolic activity. Humans also had the greatest body fat percentage. An increased metabolic rate, along with changes in energy allocation, was crucial in the evolution of human brain size and life history.
Figures
Comment in
-
Metabolic Acceleration in Human Evolution.Cell Metab. 2016 Jul 12;24(1):5-6. doi: 10.1016/j.cmet.2016.06.015. Cell Metab. 2016. PMID: 27411003
Similar articles
-
Comparative Pathology of Aging Great Apes: Bonobos, Chimpanzees, Gorillas, and Orangutans.Vet Pathol. 2016 Mar;53(2):250-76. doi: 10.1177/0300985815612154. Epub 2015 Dec 31. Vet Pathol. 2016. PMID: 26721908 Review.
-
Evolution of water conservation in humans.Curr Biol. 2021 Apr 26;31(8):1804-1810.e5. doi: 10.1016/j.cub.2021.02.045. Epub 2021 Mar 5. Curr Biol. 2021. PMID: 33675699
-
Token transfers among great apes (Gorilla gorilla, Pongo pygmaeus, Pan paniscus, and Pan troglodytes): species differences, gestural requests, and reciprocal exchange.J Comp Psychol. 2009 Nov;123(4):375-84. doi: 10.1037/a0017253. J Comp Psychol. 2009. PMID: 19929106
-
Relationships between the hard and soft dimensions of the nose in Pan troglodytes and Homo sapiens reveal the positions of the nasal tips of Plio-Pleistocene hominids.PLoS One. 2022 Feb 22;17(2):e0259329. doi: 10.1371/journal.pone.0259329. eCollection 2022. PLoS One. 2022. PMID: 35192639 Free PMC article.
-
Evolution and demography of the great apes.Curr Opin Genet Dev. 2016 Dec;41:124-129. doi: 10.1016/j.gde.2016.09.005. Epub 2016 Oct 4. Curr Opin Genet Dev. 2016. PMID: 27716526 Review.
Cited by
-
Insights into human evolution from ancient and contemporary microbiome studies.Curr Opin Genet Dev. 2016 Dec;41:14-26. doi: 10.1016/j.gde.2016.07.003. Epub 2016 Aug 6. Curr Opin Genet Dev. 2016. PMID: 27507098 Free PMC article. Review.
-
Repressive Gene Regulation Synchronizes Development with Cellular Metabolism.Cell. 2019 Aug 8;178(4):980-992.e17. doi: 10.1016/j.cell.2019.06.023. Epub 2019 Jul 25. Cell. 2019. PMID: 31353220 Free PMC article.
-
Impact of energy availability and physical activity on variation in fertility across human populations.J Physiol Anthropol. 2023 Feb 24;42(1):1. doi: 10.1186/s40101-023-00318-3. J Physiol Anthropol. 2023. PMID: 36829218 Free PMC article. Review.
-
Relationship between body mass, lean mass, fat mass, and limb bone cross-sectional geometry: Implications for estimating body mass and physique from the skeleton.Am J Phys Anthropol. 2018 May;166(1):56-69. doi: 10.1002/ajpa.23398. Epub 2018 Jan 18. Am J Phys Anthropol. 2018. PMID: 29344931 Free PMC article.
-
A Human Brain Map of Mitochondrial Respiratory Capacity and Diversity.Res Sq [Preprint]. 2024 Mar 22:rs.3.rs-4047706. doi: 10.21203/rs.3.rs-4047706/v1. Res Sq. 2024. PMID: 38562777 Free PMC article. Preprint.
References
-
- Isler K, van Schaik CP. How our ancestors broke through the gray ceiling. Curr Anthropol. 2012;53:S453–S465.
-
- Charnov EL. Life History Invariants. Oxford Univ. Press; 1993.
-
- Brown JH, Gillooly JF, Allen AP, Savage VM, West BG. Toward a metabolic theory of ecology. Ecology. 2004;85:1771–1789.
-
- Stearns SC. The Evolution of Life Histories. Oxford Univ. Press; 1992.
-
- Charnov EL. The optimal balance between growth rate and survival in mammals. Evol Ecol Res. 2004;6:307–313.
Publication types
MeSH terms
Grants and funding
LinkOut - more resources
Full Text Sources
Other Literature Sources
Medical
Research Materials
Miscellaneous
