

The mitochondrial calcium uniporter regulates breast cancer progression via HIF-1α
- PMID: 27138568
- PMCID: PMC4864890
- DOI: 10.15252/emmm.201606255
The mitochondrial calcium uniporter regulates breast cancer progression via HIF-1α
Abstract
Triple-negative breast cancer (TNBC) represents the most aggressive breast tumor subtype. However, the molecular determinants responsible for the metastatic TNBC phenotype are only partially understood. We here show that expression of the mitochondrial calcium uniporter (MCU), the selective channel responsible for mitochondrial Ca(2+) uptake, correlates with tumor size and lymph node infiltration, suggesting that mitochondrial Ca(2+) uptake might be instrumental for tumor growth and metastatic formation. Accordingly, MCU downregulation hampered cell motility and invasiveness and reduced tumor growth, lymph node infiltration, and lung metastasis in TNBC xenografts. In MCU-silenced cells, production of mitochondrial reactive oxygen species (mROS) is blunted and expression of the hypoxia-inducible factor-1α (HIF-1α) is reduced, suggesting a signaling role for mROS and HIF-1α, downstream of mitochondrial Ca(2+) Finally, in breast cancer mRNA samples, a positive correlation of MCU expression with HIF-1α signaling route is present. Our results indicate that MCU plays a central role in TNBC growth and metastasis formation and suggest that mitochondrial Ca(2+) uptake is a potential novel therapeutic target for clinical intervention.
Keywords: HIF‐1α; breast cancer; metastasis; mitochondrial Ca2+ uptake; reactive oxygen species.
© 2016 The Authors. Published under the terms of the CC BY 4.0 license.
Figures
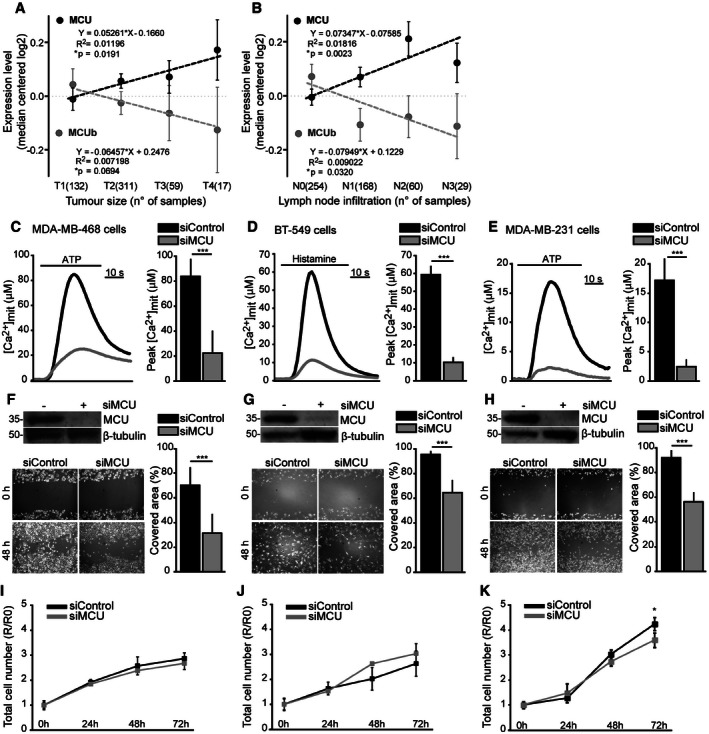
- A, B
Correlation of MCU and MCUb expression levels with breast cancer clinical stages. Median‐centered log2 mRNA expression levels of MCU and MCUb were collected from the TCGA breast cancer dataset (
http://tcga-data.nci.nih.gov/docs/publications/brca_2012/ ). Data were plotted and analyzed against tumor size (T1–T4) (A) and regional lymph node infiltration (N0–N3) (B), according to the AJCC Cancer Staging Manual (7th edition). Linear regression analysis with different stages was implemented. Parameters of linear regression are shown. Numbers of samples for each stage are shown in parentheses. - C–E
MCU silencing reduces [Ca2+]mit uptake in TNBC cells. Cells were transfected with siMCU or siControl. After 48 h, [Ca2+]mit uptake upon ATP (C, E) or histamine (D) stimulation was measured (n = 10). P‐values: ***P = 0.0008 (C), ***P < 0.0001 (D), ***P = 0.0001 (E), respectively.
- F–H
MCU silencing impairs TNBC cell migration. Cells were transfected with siMCU or siControl. The day after transfection, a linear scratch was obtained on the cell monolayer through a vertically held P200 tip (time point 0 h). Cell migration into the scratched area was monitored 48 h later. The covered area was measured and expressed as a percentage relative to 0‐h time point (n = 12). P‐value: ***P < 0.0001.
- I–K
Cell proliferation is mainly unaffected by MCU depletion. Cells were transfected with siMCU or siControl. Cell number was counted every 24 h for 3 days (the 72‐h time point corresponds to the 48‐h time point of wound healing assay). Results are expressed as ratio R/R0 where R0 is the number of cells at the time of transfection (0‐h time point) (n = 6). P‐value: *P = 0.05.
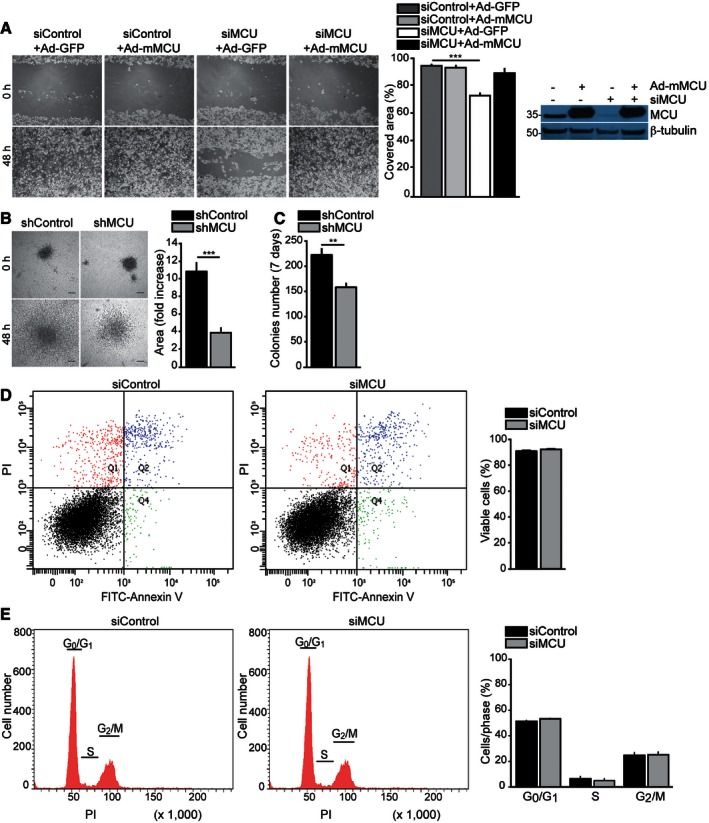
Re‐expression of mMCU rescues cell motility of MCU‐silenced cells. Cells were transfected with siMCU or siControl. Ad‐mMCU was used to re‐express MCU (Ad‐GFP was used as a control). MCU protein expression was verified by Western blot. The day after transduction, a linear scratch was made (0‐h time point). Cell migration into the wounded area was monitored at 48‐h time point, and the covered area was measured (n = 12). P‐value: ***P < 0.0001.
MCU silencing blunts cell invasiveness. Stable shMCU‐ and shControl‐expressing spheroids were plated and let grow into collagen I (0‐h time point). Spheroid area was measured at 0 h and 48 h (n = 8). Scale bar: 300 μm. P‐value: ***P = 0.0003.
MCU silencing reduces the clonogenic potential of MDA‐MB‐231 cells. Stable shMCU‐ and shControl‐expressing cells were plated at low confluence (2 × 10³/well of a 6‐well plate). After 7 days, the number of colonies was counted (minimum 30 cells/colony, n = 8). P‐value: **P = 0.0027.
MCU depletion does not induce cell death. Cells were transfected with siMCU or siControl. Seventy‐two hours later, cell apoptosis and necrosis were measured by FITC‐Annexin V and propidium iodide (PI) detection (Q1: PI positive, Q2: PI and FITC‐Annexin V positive, Q3: PI and FITC‐Annexin V negative, Q4: FITC‐Annexin V positive; n = 6).
MCU depletion does not alter cell cycle. Cells were transfected with siMCU or siControl. Seventy‐two hours later, cell cycle distribution was monitored by propidium iodide (PI) detection (n = 6).
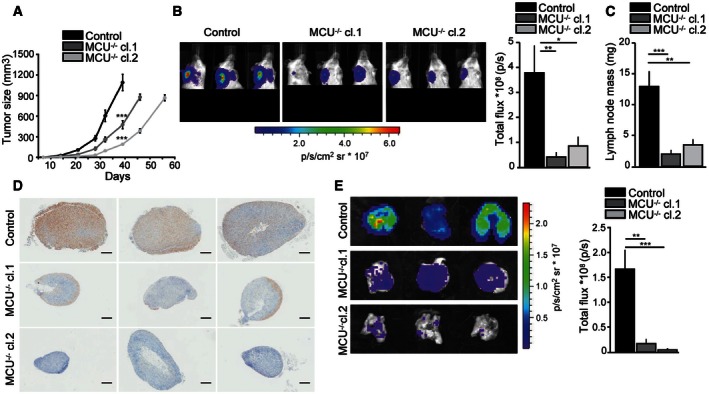
Tumor mass volume was measured at specific time points until the day of sacrifice (day 39 post‐injection for control, day 46 and 56 p.i. for MCU −/− cl.1 and cl.2, respectively). P‐values: (cl.1) ***P = 0.0001, (cl.2) ***P < 0.0001.
Left: in vivo metastasis at the homolateral axillary area of three representative mice per group at the time of sacrifice. Right: total flux analysis. P‐values: **P = 0.01, *P = 0.02.
Lymph nodes weight at the time of sacrifice. P‐values: ***P = 0.0010, **P = 0.0014.
Human cytokeratin 7 (CK7) IHC staining of three representative lymph nodes per group. Scale bar: 500 μm.
Left: images of three representative lungs per group collected ex vivo at the time of sacrifice. Right: total flux analysis. P‐values: **P = 0.0031, ***P = 0.0004.

- A–C
FLIM analysis of cellular NADH/NADPH levels. Fluorescence lifetimes of NAD(P)H autofluorescence in stable shControl‐ and shMCU‐expressing cells were imaged. Representative images of the distribution of τbound on an intensity weighted pseudocolored scale (2.2–2.5 ns) are shown. Scale bars: 20 μm (A). Mean ± SE of τbound (B) and relative NADH and NADPH intensities (C) calculated from equation in Blacker et al (2014) are shown (n = 3). P‐values: **P = 0.01 (B), **P = 0.002 (C).
- D, E
Measurement of the redox state of the NADH/NAD+ couple. Representative measurements of NADH intensity at steady state and at minimal and maximal reduced state (D). Percentage of the steady‐state redox state (E) (n = 3).
- F
MCU depletion impairs the mitochondrial rate of ATP production. Cells were transfected with siMCU or siControl. Forty‐eight hours later, cells were treated with 5.5 mM 2‐deoxy‐D‐glucose for 1 h and cellular ATP levels were quantified (n = 6). P‐value: ***P = 0.0009.
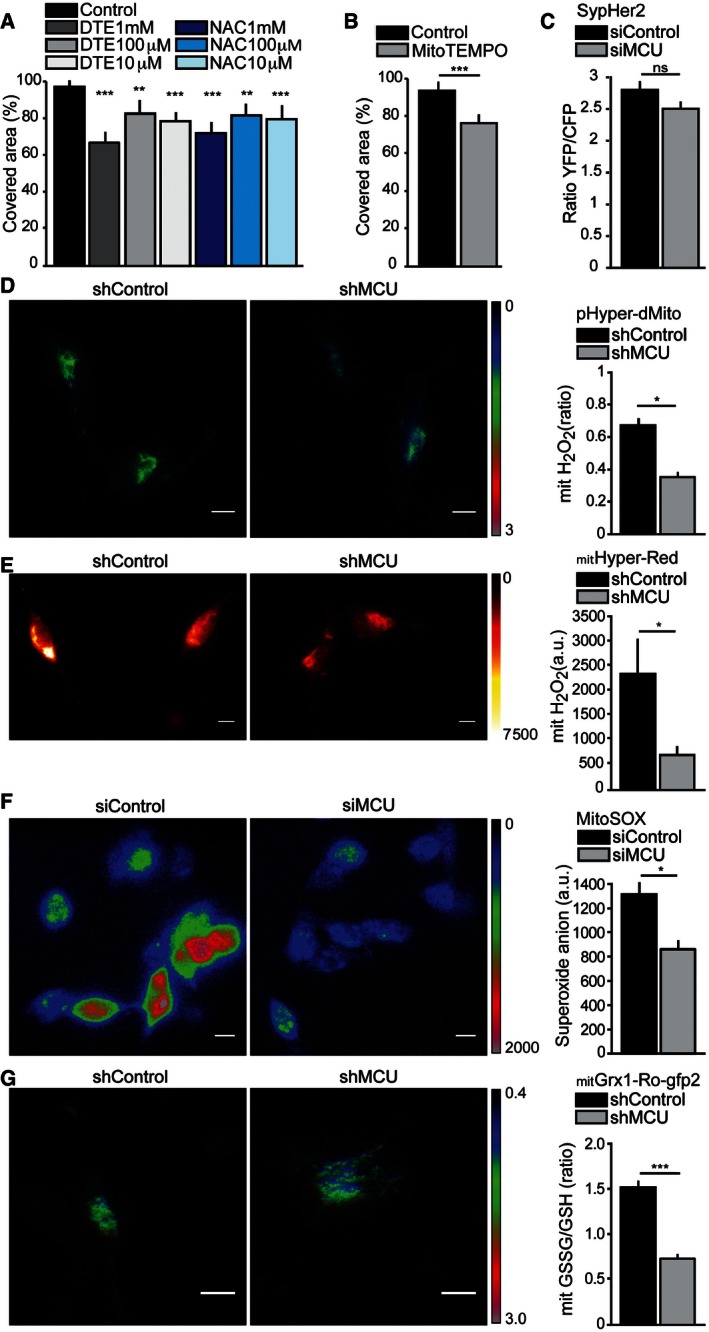
- A
Antioxidant treatments decrease cell migration. A linear scratch was obtained on cell monolayer through a vertically held P200 tip (0‐h time point). Cells were treated for 48 h with N‐acetylcysteine (NAC) or dithioerythritol (DTE). Cell migration into the wounded area was monitored at 48‐h time point, and the covered area was measured (n = 12). P‐values: (DTE 100 μM) **P = 0.008, ***P < 0.0001, (NAC 100 μM) **P = 0.005.
- B
Scavenging of mitochondrial ROS decreases cell migration. A linear scratch was obtained on a cell monolayer through a vertically held P200 tip (0‐h time point). Cells were treated for 48 h with 50 μM MitoTEMPO. Cell migration into the wounded area was monitored at 48‐h time point, and the covered area was measured (n = 12). P‐value: ***P < 0.0001.
- C
MCU silencing does not affect matrix pH. Cells were transfected with siMCU or siControl and SypHer2 probe. Forty‐eight hours later, matrix pH was measured (n = 22).
- D, E
Mitochondrial H2O2 levels are critically blunted after MCU depletion. Cells were transfected with shMCU or shControl, together with the ratiometric YFP‐based biosensor pHyper‐dMito (D) or the mitochondrial H2O2‐sensitive HyPerRed probe (E). Forty‐eight hours later, H2O2 production was measured (n = 35). P‐values: *P = 0.02 (D), *P = 0.05 (E).
- F
Mitochondrial superoxide levels are critically blunted after MCU silencing. Cells were transfected with siMCU or siControl. Forty‐eight hours later, cells were loaded with the red dye MitoSOX™ and superoxide anion levels were measured (n = 25). P‐value: *P = 0.04.
- G
Mitochondrial GSSG/GSH ratio is critically reduced after MCU silencing. Cells were transfected with shMCU or shControl, together with the mitochondrial targeted mitGrx1‐roGFP2 probe. Ninety‐six hours later, the glutathione redox potential (EGSH) was measured (n = 46). P‐value: ***P < 0.0001.
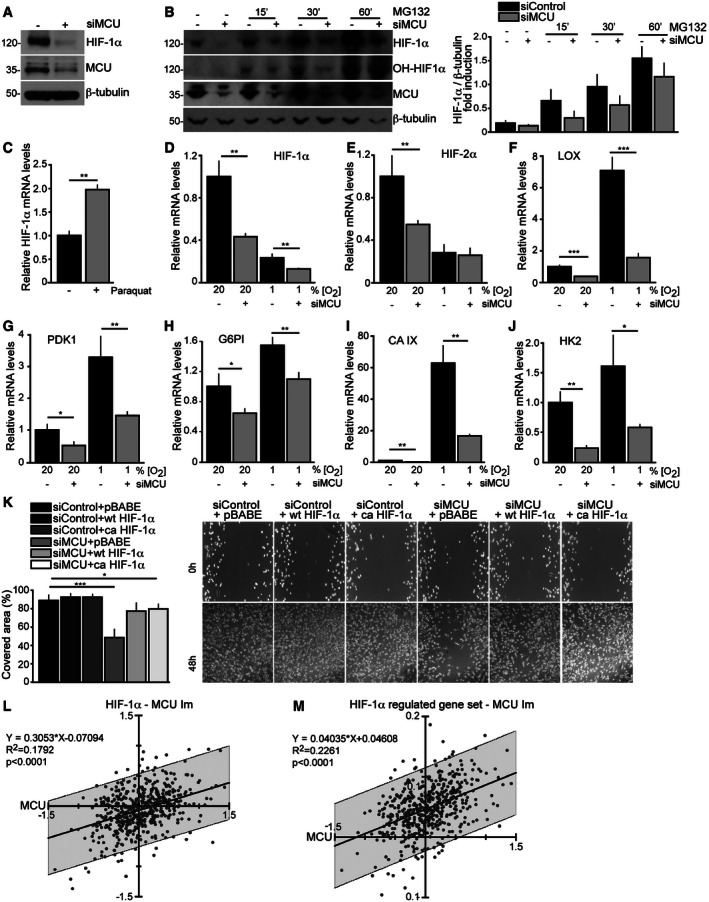
- A
MCU silencing reduces HIF‐1α protein levels. Cells were transfected with siMCU or siControl. HIF‐1α protein levels were detected 48 h later.
- B
MCU silencing reduces MG132‐mediated HIF‐1α and hydroxylated HIF‐1α protein accumulation. Cells were transfected with siMCU or siControl. Forty‐eight hours later, cells were treated with 10 μM of the proteasome inhibitor MG132. Left: Protein levels were revealed by Western blot. Right: quantification by densitometry (n = 5).
- C
ROS increase HIF1A transcription. Cells were treated overnight with 100 μM paraquat to induce ROS production. HIF‐1α mRNA levels were measured by real‐time PCR (n = 3). P‐value: **P = 0.002.
- D–J
MCU silencing reduces mRNA levels of HIF1A, HIF2A, and HIF‐1α target genes. Cells were transfected with siMCU or siControl. mRNA expression was measured by real‐time PCR (n = 3). P‐values: for HIF‐1α **P = 0.0031 (20% O2), **P = 0.009 (1% O2); for HIF‐2α **P = 0.01; for LOX ***P = 0.001 (20% O2), ***P = 0.0005 (1% O2); for PDK1 *P = 0.02, **P = 0.009; for G6PI *P = 0.02, **P = 0.005; for CAIX **P = 0.0026 (20% O2), **P = 0.0022 (1% O2); for HK2 **P = 0.0024, *P = 0.03.
- K
HIF‐1α overexpression rescues siMCU‐mediated migration impairment. Cells were transfected with siMCU or siControl. Wild‐type (wt) and constitutively active (ca) HIF‐1α were expressed by retroviral infection (pBABE was used as a control). The day after transduction, cells were scratched (0‐h time point). Cell migration into the wounded area was monitored at 48‐h time point, and the covered area was measured (n = 12). P‐values: ***P < 0.0001, *P = 0.04.
- L, M
MCU expression levels correlate with HIF1A (L) and HIF‐1α‐regulated genes (M). A linear model (lm) to test the power of MCU expression levels predicting the expression of HIF1A and HIF‐1α‐regulated genes was calculated and plotted for each of the 532 samples of the TCGA database (see Fig 1). Equation and R 2 values of the linear regression and significance indicating deviation from 0 are shown. The area of 95% prediction limit is shaded below and above the linear regression line. The HIF‐1α‐regulated gene set was compiled from Broad Institute GSEA database (
http://www.broadinstitute.org/gsea/msigdb/cards/V$HIF1_Q5.html , merged sets of V$HIF1_Q3 and V$HIF1_Q5).
Similar articles
-
The function of Piezo1 in colon cancer metastasis and its potential regulatory mechanism.J Cancer Res Clin Oncol. 2020 May;146(5):1139-1152. doi: 10.1007/s00432-020-03179-w. Epub 2020 Mar 9. J Cancer Res Clin Oncol. 2020. PMID: 32152662 Free PMC article.
-
Identification and functional validation of FDA-approved positive and negative modulators of the mitochondrial calcium uniporter.Cell Rep. 2021 Jun 22;35(12):109275. doi: 10.1016/j.celrep.2021.109275. Cell Rep. 2021. PMID: 34161774 Free PMC article.
-
The Milk Protein Alpha-Casein Suppresses Triple Negative Breast Cancer Stem Cell Activity Via STAT and HIF-1alpha Signalling Pathways in Breast Cancer Cells and Fibroblasts.J Mammary Gland Biol Neoplasia. 2019 Sep;24(3):245-256. doi: 10.1007/s10911-019-09435-1. Epub 2019 Sep 12. J Mammary Gland Biol Neoplasia. 2019. PMID: 31529195
-
Hypoxia-mediated activation of hypoxia-inducible factor-1α in triple-negative breast cancer: A review.Medicine (Baltimore). 2023 Oct 27;102(43):e35493. doi: 10.1097/MD.0000000000035493. Medicine (Baltimore). 2023. PMID: 37904441 Free PMC article. Review.
-
Targeting hypoxia-inducible factor-1alpha: A new strategy for triple-negative breast cancer therapy.Biomed Pharmacother. 2022 Dec;156:113861. doi: 10.1016/j.biopha.2022.113861. Epub 2022 Oct 10. Biomed Pharmacother. 2022. PMID: 36228375 Review.
Cited by
-
CircZFR functions as a sponge of miR-578 to promote breast cancer progression by regulating HIF1A expression.Cancer Cell Int. 2020 Aug 18;20:400. doi: 10.1186/s12935-020-01492-5. eCollection 2020. Cancer Cell Int. 2020. PMID: 32831653 Free PMC article.
-
Effects of the Tumor Environment on Ion Channels: Implication for Breast Cancer Progression.Rev Physiol Biochem Pharmacol. 2021;181:1-38. doi: 10.1007/112_2020_19. Rev Physiol Biochem Pharmacol. 2021. PMID: 32761457 Review.
-
MCU-dependent negative sorting of miR-4488 to extracellular vesicles enhances angiogenesis and promotes breast cancer metastatic colonization.Oncogene. 2020 Nov;39(46):6975-6989. doi: 10.1038/s41388-020-01514-6. Epub 2020 Oct 16. Oncogene. 2020. PMID: 33067576
-
Cancer metabolism and mitochondria: Finding novel mechanisms to fight tumours.EBioMedicine. 2020 Sep;59:102943. doi: 10.1016/j.ebiom.2020.102943. Epub 2020 Aug 17. EBioMedicine. 2020. PMID: 32818805 Free PMC article. Review.
-
Mitochondrial Calcium Uniporter Drives Metastasis and Confers a Targetable Cystine Dependency in Pancreatic Cancer.Cancer Res. 2022 Jun 15;82(12):2254-2268. doi: 10.1158/0008-5472.CAN-21-3230. Cancer Res. 2022. PMID: 35413105 Free PMC article.
References
-
- Belousov VV, Fradkov AF, Lukyanov KA, Staroverov DB, Shakhbazov KS, Terskikh AV, Lukyanov S (2006) Genetically encoded fluorescent indicator for intracellular hydrogen peroxide. Nat Methods 3: 281–286 - PubMed
-
- Bogeski I, Kappl R, Kummerow C, Gulaboski R, Hoth M, Niemeyer BA (2011) Redox regulation of calcium ion channels: chemical and physiological aspects. Cell Calcium 50: 407–423 - PubMed
Publication types
MeSH terms
Substances
Grants and funding
LinkOut - more resources
Full Text Sources
Other Literature Sources
Research Materials
Miscellaneous
