. 2016 Jun;34(6):637-45.
doi: 10.1038/nbt.3569. Epub 2016 May 2.

Wishbone identifies bifurcating developmental trajectories from single-cell data

Affiliations

Wishbone identifies bifurcating developmental trajectories from single-cell data

Manu Setty et al. Nat Biotechnol. 2016 Jun.

Abstract

Recent single-cell analysis technologies offer an unprecedented opportunity to elucidate developmental pathways. Here we present Wishbone, an algorithm for positioning single cells along bifurcating developmental trajectories with high resolution. Wishbone uses multi-dimensional single-cell data, such as mass cytometry or RNA-Seq data, as input and orders cells according to their developmental progression, and it pinpoints bifurcation points by labeling each cell as pre-bifurcation or as one of two post-bifurcation cell fates. Using 30-channel mass cytometry data, we show that Wishbone accurately recovers the known stages of T-cell development in the mouse thymus, including the bifurcation point. We also apply the algorithm to mouse myeloid differentiation and demonstrate its generalization to additional lineages. A comparison of Wishbone to diffusion maps, SCUBA and Monocle shows that it outperforms these methods both in the accuracy of ordering cells and in the correct identification of branch points.


Conflict of interest statement

Competing financial interests

The authors declare no competing financial interests.

Figures

Figure 1
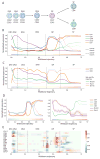
Figure 1. Alignment of cells along bifurcating trajectories
(A) Wishbone aims to achieve high resolution ordering and branching of cells along bifurcating developmental trajectories. The data is represented as a k-nearest neighbor graph where each cell is a node and edges connect each cell to its most phenotypically similar cells. A cartoon depiction of a kNN graph is illustrated. The data depicted in this figure is simulated. (B) Wishbone uses a set of cells called “waypoints” to guide the ordering of cells. An initial ordering is derived using the shortest path distances from the input early cell (top left panel). The distances from waypoints are aligned to the initial ordering to derive waypoint perspectives and the refined trajectory is determined as a weighted average of these perspectives (bottom right panel). The contour lines illustrate bands of cells that are at a similar distance from the corresponding waypoint. (C) Waypoints are also used for branch point identification and branch associations. The difference between the shortest path of waypoint t from early cell and a path that goes through another waypoint i is ≈ 0 if i and t are on the same trajectory (left panel) and ≫ 0 if they are on different branches (middle panel). These disagreements accumulate in the presence of a true branch to create a mutual disagreement matrix Q: observed are two sets of waypoints that agree within the set and disagree between sets (right panel). (D) The second Eigen vector of the Q matrix provides a summary of the disagreements with values ≈ 0 for waypoints on the trunk, > 0 for waypoints on one branch and < 0 for waypoints on the other branch. The branch point and branch associations are used to further refine the trajectory. The resulting trajectory and branches are used to study marker dynamics along differentiation.
Figure 2
Figure 2. Wishbone robustly recovers hallmarks of T cell differentiation
(A) T cell development in the mouse thymus is characterized by progression of DN cells to two SP populations through different stages. (B) Marker trends for DN markers CD44, CD25, CD117 and lineage markers CD4, CD8 and CD3 are consistent with known stages of T cell differentiation. Cells were first binned along Wishbone trajectory and weighted averages were calculated for each bin to determine marker traces (see supplement for computational details). Following bifurcation, markers with different expression patterns in the two SP populations are shown in a dashed line for CD4 lineage and a dotted line for the CD8 lineage. (C) Bcl11b, Runx1 and Notch1 were not used for learning but the dynamics of these markers are consistent with their roles in specific developmental stages. (D) The variance of markers along the trajectory is tight further highlighting the robustness of Wishbone results. (E) Derivative plot, showing the changes in expression of markers in successive bins, is used to time key events along the trajectory: (1) CD8+CD4 Intermediate Single Positive stage in DN to DP transition, (2) Upregulation of CD4 and CD8 establishing DP cells, (3) Stable expression of lineage markers during DP, (4) Downregulation of both CD4 and CD8 accompanied by coordinated upregulation of CD3, TCRβ, CD5, CD69 and CD27 during positive selection, (5) Specific downregulation of CD8 alongside up-regulation of CD4 indicating intermediate thymocytes, (6) Lineage commitment to two SP population and finally (7) Successful completion of negative selection identified by downregulation of CD69 and upregulation of CD62L indicating successful maturation. The branch with the highest expression is shown for markers with different expression patterns in the two SP branches.
Figure 3
Figure 3. Heterogeneity in gated populations is explained in part by variance along trajectory
(A) Plots comparing the dynamics of CD44, CD25, CD117, CD3, CD4 and CD8 across thymses from three independent replicates. Cross correlation was used to align expression dynamics of each marker across the replicates. (B) Gating scheme for identifying CD4+ and CD8+ SP populations to compare variance of gated populations to variance along the differentiation trajectory. (C) Wishbone results after excluding CD3 from the learning are similar to results obtained when CD3 was included. (D) The variance of CD3 and lineage markers CD4 and CD8 along the trajectory (solid line) are substantially lower than the population variance (dotted line) in both branches indicating that heterogeneity in gated populations is a result of comparing cells at different stages along their developmental maturity.
Figure 4
Figure 4. Transcription factors show distinct dynamics in SP populations
(A–B) Plots comparing the dynamics of CD4 lineage commitment factors ThPOK and Gata3 with dynamics of CD8 lineage commitment factor Runx3. (C–D) Derivative plots (left panels) and expression trends (right panels) of key markers in the two SP populations along the trajectory following positive selection (The highlighted region is indicated in A–B) showing the distinct dynamics of lineage commitment factors. CD69 and CD62L were used to identify the landmarks of SP commitment and maturation: CD69hi and CD62Llow for successful commitment and CD69 low and CD62L high for negative selection. (1) ThPOK and Gata3 are both upregulated during positive selection with ThPOK showing a slower upregulation (2). ThPOK shows a marginal upregulation specifically in the CD4 branch following commitment (3). ThPOK and Gata3 show a marginal downregulation in the CD4 branch during negative selection (C(4)). On the other hand, these factors are downregulated in the CD8 branch following commitment (D(4)). This downregulation is accompanied with a CD8 specific upregulation of Runx3 (5). (E) Cells were gated using the scheme defined in Supplementary Fig. 13 and were expected to be placed in the following order indicating CD4 maturity: DP CD69+, CD4+CD8int, CD4SP CD69+, CD4SP CD24int and CD4SP CD24. Instead cells of the three intermediate gates are placed all along the CD4 Wishbone trajectory. These cells were divided into “Early” and “Late” populations based on their position in the Wishbone trajectory. (F) The “Early” cells in the CD4+CD8int gate show significantly higher expression of CD69 and CD24 and lower expression of CD62L compared to “Late” cells (p < 1e-6, Kolmogorov-Smirnov test). This indicates that “Late” cells are more mature than the “Early” cells. (G) mRNA expression of CD69 and CD24 in ImmGen sorted populations are correlated with mean expression in the gated populations demonstrating that the discrepancy between Wishbone and gating is not dataset specific.
Figure 5
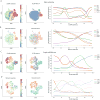
Figure 5. Generalization of Wishbone to branches in human and mouse myeloid development spanning mass cytometry and single-cell RNA-seq
(A) Wishbone was applied to an early step in human myeloid development to track the differentiation of classical monocytes (CD14+CD11b+CD11c+) and erythrocytes (CD235ab+) from hematopoietic stem and progenitor cells (HSPCs). See also Supplementary Fig. 16. (B) tSNE map of the data with each cell colored by the trajectory (left panel) and the branch associations (right panel). Wishbone accurately orders the cells with HSPCs at the start and the differentiated cells towards the end. The inferred branch associations are also consistent with the annotated cell types (Supplementary Fig. 16). (C – D) same as in A–B for tracking differentiation of classical monocytes and CD15+ monocytes, a late step in human myeloid development. (C – D) Wishbone was applied to single-cell RNA-seq data from the hematopoietic precursors from the mouse and accurately recovered the trajectory and branches to track differentiation of myeloid and erythroid precursors from HSPCs.
Figure 6
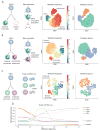
Figure 6. Wishbone outperforms competing methods in both ordering of cells and branch associations
(A) tSNE maps showing SCUBA results for a random sample of 20000 mouse thymic cells (left and middle panels). SCUBA trajectory does not distinguish between the DN and DP stages. While SCUBA recovers the SP branches, it suffers from a loss of resolution in the SP stage (right panel). (B) Plots showing Monocle results for a random sample of 1000 mouse thymus cells. Monocle fails to correctly order the cells and the branches do not correspond to the SP populations. (C) SCUBA accurately recovers the ordering of mouse myeloid cells and the marker dynamics are largely consistent with known biology. SCUBA however results in a large number of incoherent branches. (D) Monocle fails to accurately order the myeloid precursors correctly and also fails to detect a coherent HSPC branch.

Similar articles

Cited by

References

    1. Tang F, et al. mRNA-Seq whole-transcriptome analysis of a single cell. Nat Methods. 2009;6(5):377–82. - PubMed
    1. Bendall SC, et al. Single-cell mass cytometry of differential immune and drug responses across a human hematopoietic continuum. Science. 2011;332(6030):687–96. - PMC - PubMed
    1. Bendall SC, et al. Single-cell trajectory detection uncovers progression and regulatory coordination in human B cell development. Cell. 2014;157(3):714–25. - PMC - PubMed
    1. Shin J, et al. Single-Cell RNA-Seq with Waterfall Reveals Molecular Cascades underlying Adult Neurogenesis. Cell Stem Cell. 2015;17(3):360–72. - PMC - PubMed
    1. Marco E, et al. Bifurcation analysis of single-cell gene expression data reveals epigenetic landscape. 2014;111(52):E5643–50. - PMC - PubMed

Publication types