. 2016 May 19;165(5):1209-1223.
doi: 10.1016/j.cell.2016.04.012. Epub 2016 Apr 28.

Two Conserved Histone Demethylases Regulate Mitochondrial Stress-Induced Longevity

Affiliations

Two Conserved Histone Demethylases Regulate Mitochondrial Stress-Induced Longevity

Carsten Merkwirth et al. Cell. .

Abstract

Across eukaryotic species, mild mitochondrial stress can have beneficial effects on the lifespan of organisms. Mitochondrial dysfunction activates an unfolded protein response (UPR(mt)), a stress signaling mechanism designed to ensure mitochondrial homeostasis. Perturbation of mitochondria during larval development in C. elegans not only delays aging but also maintains UPR(mt) signaling, suggesting an epigenetic mechanism that modulates both longevity and mitochondrial proteostasis throughout life. We identify the conserved histone lysine demethylases jmjd-1.2/PHF8 and jmjd-3.1/JMJD3 as positive regulators of lifespan in response to mitochondrial dysfunction across species. Reduction of function of the demethylases potently suppresses longevity and UPR(mt) induction, while gain of function is sufficient to extend lifespan in a UPR(mt)-dependent manner. A systems genetics approach in the BXD mouse reference population further indicates conserved roles of the mammalian orthologs in longevity and UPR(mt) signaling. These findings illustrate an evolutionary conserved epigenetic mechanism that determines the rate of aging downstream of mitochondrial perturbations.


Figures

Figure 1
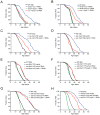
Figure 1. Lifespan Extension by Mitochondrial ETC Perturbation Requires the Histone Demethylases jmjd-1.2 and jmjd-3.1
(A) and (B) Knockdown of jmjd-1.2 (A) or jmjd-3.1 (B) suppresses cco-1-mediated lifespan extension. (C) jmjd-1.2 is partially required for longevity of isp-1(qm150) mutant animals. (D) jmjd-3.1 is required for longevity of isp-1(qm150) mutant animals. (E) and (F) Dietary restriction-mediated longevity of eat-2(ad1116) animals is not affected by jmjd-1.2 (E) or jmjd-3.1 (F) knockdown. (G) Longevity of daf-2(e1370) mutant animals is not affected by jmjd-1.2 knockdown. (H) Longevity of daf-2(e1370) mutant animals partially depends on jmjd-3.1. See also Figure S1 and Table S1 for lifespan statistics.
Figure 2
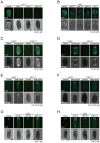
Figure 2. jmjd-1.2 and jmjd-3.1 are Necessary and Specific for Induction of the UPRmt
(A) Fluorescent micrographs of hsp-6p∷gfp UPRmt reporter animals treated with the indicated RNAi at day 1 of adulthood. Knockdown of jmjd-1.2 suppresses cco-1-mediated UPRmt induction in hsp-6p∷gfp reporter animals. (B) Knockdown of jmjd-3 histone demethylase family members suppresses spg-7-mediated UPRmt induction. (C) and (D) Fluorescent micrographs of hsp-4p∷gfp UPRer reporter animals. Induction of the UPRer response in hsp-4p∷gfp UPRer reporter animals by tunicamycin treatment is not affected by neither jmjd-1.2 (C) or jmjd-3.1 (D) RNAi. (E) and (F) Fluorescent micrographs of hsp-16.2p∷gfp reporter animals. Induction of the heat shock response in hsp-16.2p∷gfp reporter animals occurs independently of jmjd-1.2 (E) or jmjd-3.1 (F) RNAi. (G) and (H) Fluorescent micrographs of sod-3∷gfp reporter animals treated with the indicated RNAi. daf-16 RNAi was used as a positive control. See also Figures S2 and S3.
Figure 3
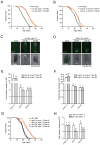
Figure 3. jmjd-1.2 and jmjd-3.1 Overexpression is Sufficient for Lifespan Extension and UPRmt Induction
(A) and (B) Overexpression of jmjd-1.2 and jmjd-3.1 extends C. elegans lifespan. Lifespan analysis of two independent transgenic lines of sur-5p∷jmjd-1.2 (A) or jmjd-3.1p∷jmjd-3.1 (B) expressing animals compared to WT (N2) animals. (C) and (D) Fluorescent micrographs of hsp-6p∷gfp UPRmt reporter animals expressing either sur-5p∷jmjd-1.2 (C) or jmjd-3.1p∷jmjd-3.1 (D) transgenes in two independent lines analyzed at day 1 of adulthood. (E) and (F) Transcript levels in two independent lines of sur-5p∷jmjd-1.2 (E) or jmjd-3.1p∷jmjd-3.1 (F) expressing animals at day 1 of adulthood were measured by qRT-PCR. Results are shown relative to transcript levels in WT (N2) animals, with error bars indicating mean ± SEM. *** denotes p < 0.001, **p < 0.01, *p < 0.05. (G) Neuron-specific overexpression of jmjd-1.2 is sufficient to extend lifespan. Lifespan analysis of two independent lines expressing either pan-neuronal (rgef-1p∷jmjd-1.2) or intestinal (gly-19p∷jmjd-1.2) transgenes compared to WT (N2) animals. (H) Transcript levels in animals expressing either pan-neuronal (rgef-1p∷jmjd-1.2) or intestinal (gly-19p∷jmjd-1.2) transgenes at day 1 of adulthood were measured by qRT-PCR. Results are shown relative to transcript levels in WT (N2) animals, with error bars indicating mean ± SEM. ** denotes p < 0.01, *p < 0.05, n.s. = p > 0.05. See also Figure S4 and Table S1 for lifespan statistics.
Figure 4
Figure 4. The UPRmt is a Genetic Requirement for the Pro-Longevity Response upon jmjd-1.2 and jmjd-3.1 Overexpression
(A), (B) and (C) ubl-5 RNAi suppresses lifespan extension upon jmjd-1.2, jmjd-3.1 or neuronal jmjd-1.2 overexpression. Lifespan analysis of two independent lines of sur-5p∷jmjd-1.2 (A), jmjd-3.1p∷jmjd-3.1 (B), neuronal rgef-1p∷jmjd-1.2 (C) and WT (N2) animals grown on empty vector control or ubl-5 RNAi. (D), (E) and (F) Fluorescent micrographs of hsp-6p∷gfp UPRmt reporter animals expressing the indicated transgenes treated with the indicated RNAi, at day 1 of adulthood. (G), (H) and (I) Transcript levels of canonical UPRmt targets assessed by qRT-PCR in sur-5p∷jmjd-1.2 (G), jmjd-3.1p∷jmjd-3.1 (H) or neuronal rgef-1p∷jmjd-1.2 (I) transgenic animals at day 1 of adulthood treated with the indicated RNAi. Results are shown relative to transcript levels in WT (N2) animals grown on the indicated RNAi, with error bars indicating mean ± SEM. *** denotes p < 0.001, **p < 0.01, *p < 0.05, n.s. = p > 0.05. See also Figure S5 and Table S1 for lifespan statistics.
Figure 5
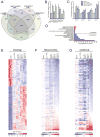
Figure 5. ETC Perturbation and JMJD Overexpression Share Common Lifespan Extension Mechanisms
(A) Venn diagram of differentially expressed genes (DEGs) in cco-1 RNAi treated worms and transgenic overexpression lines jmjd-3.1p∷jmjd-3.1, sur-5p∷jmjd-1.2, rgef-1p∷jmjd-1.2, compared to wild type N2 worms on empty vector control, as measured by RNA-seq (Benjamini-Hochberg adjusted p value < 0.05). See Table S2 for complete list of DEGs. (B) Transcriptional upregulation of jmjd-1.2 and jmjd-3.1 upon cco-1 RNAi. Gene expression analysis of all nine JmjC domain encoding genes in RNA-seq samples, expressed as fold change relative to wild type N2 on empty vector control. Results are expressed as mean ±SEM of normalized count values (n=3, Benjamini-Hochberg adjusted p values (padj) calculated by DESeq2, jmjd-1.2 padj=6.93E-09, jmjd-3.1 padj=0.002, jmjd-3.3 padj=0.452, jmjd-4 padj=0.085. n.d.= not detected, ** denotes p < 0.01, ***p < 0.001). (C) UPRmt gene expression in RNA-seq samples, expressed as fold change relative to wild type N2 on empty vector control. Results are expressed as mean ±SEM of normalized count values. * denotes p < 0.05, **p < 0.01, ***p < 0.001). (D) Representative top GO terms of upregulated and downregulated genes in the 1405 overlapping DEGs (Bonferroni adjusted p value<0.05). See also Table S2. (E) Gene expression heatmap of 1405 overlapping DEGs in all 4 conditions described in(A). DESeq2-normalized count values were used for calculations. The indicated Row Z-scores reflect the number of standard deviations each replicate is apart from the mean gene expression value over all conditions. See also Table S2. (F) Heatmap of 470 mitochondrial genes from GO cellular component category mitochondrion (GO:0005739). Fold change (FC) was calculated by comparing normalized count values of each condition to wild type N2 empty vector control, then transformed to log2 scale. See also Table S2. (G) Heatmap of 111 OXPHOS genes from GO biological process category oxidative phosphorylation (GO:0006119) and manual annotation. See also Table S2.
Figure 6
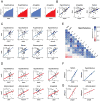
Figure 6. Positive Correlations between Phf8, Jmjd3, Lifespan and UPRmt transcripts in the BXD Mouse Genetic Reference Population
(A) Variation of Phf8 and Jmjd3 mRNA levels in hypothalamus (n=44) and amygdala(n=56) across BXD mouse strains. Each bar represents mRNA levels from a pool of approximately five animals per strain. (B) Positive correlations between Phf8 (y-axis) and Jmjd3 (x-axis) expression in hypothalamus (n=44), amygdala (n=56) and spleen (n=67). (C) Positive correlations between Phf8 (y-axis) and selected UPRmt genes (x-axis) transcripts in various tissues (n=46 for adrenal gland, n=49 for pituitary gland). (D) Positive correlations between Jmjd3 (y-axis) and selected UPRmt genes (x-axis) transcripts in various tissues (n=46 for liver). (E) Spearman's correlation co-expression network for Phf8, Jmjd3 and UPRmt genes in hypothalamus. Blue correlations are positive, red correlations are negative – intensity of the colors corresponds to correlation coefficients. (F) Pearson correlations of Lifespan versus Phf8 transcript levels in either spleen (left) or hypothalamus (right) of BXD mice. (G) Pearson correlations of Lifespan versus Jmjd3 transcript levels in either pituitarygl and (left) or adrenal gland (right) of BXD mice.
Figure 7
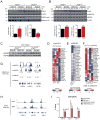
Figure 7. Conserved UPRmt Gene Regulation Mechanisms Through H3K27 Demethylases
(A) and (B) Immunoblot analysis of tissue protein lysates using the indicated antibodies. Increased Phf8 expression correlates with reduced H3K27me2 (A) and higher levels of mitochondrial chaperones (B) in the hypothalamus of the indicated BXD mouse strains. β-actin and Histone H3 were used as loading controls (upper panels). Densitometric quantifications of immunoblot signals normalized to either β-actin or Histone H3 (lower panels). Data represent the mean+ SEM. *** denotes p < 0.001, **p < 0.01. (C) Immunoblot analysis of BXD liver tissue protein lysates using the indicated antibodies. HSP90 was used as a loading control. (D) Heatmap of selected UPRmt transcripts in WT and Jmjd3 KO mice embryos at E9.5 (GSE40332). Low expression is shown in blue, while high expression is in red. (E) Heatmap of fold change in UPRmt transcripts upon shJMJD3 treatment relative to shRenilla in human T-cell lymphoblastic leukemia CEM and CUTLL1 cell lines (GSE56696). (F) Heatmap of selected UPRmt transcripts in the human T-cell lymphoblastic leukemia CUTLL1 cell line upon treatment with the H3K27 demethylase inhibitor GSK-J4 (GSE56696). (G) ChIP-Seq profiles of H3K27me3 enrichment at selected UPRmt genes in the CUTLL1 cell line upon shJMJD3 and shRenilla treatments (GSE56696). (H) ChIP-Seq profiles of PHF8 binding at selected UPRmt gene promoters in HeLa and 293T cells (GSE20725). (I) ChIP-qRT-PCR analysis of H3K27me3 enrichment at UPRmt genes at L3 stage of cco-1 RNAi treated worms compared to empty vector control. IgG antibody was used as a control. Results are expressed as percent of input, with error bars indicating mean ± SEM (n=7, * denotes p < 0.01).

Comment in

Similar articles

Cited by

References

    1. Agger K, Cloos PAC, Christensen J, Pasini D, Rose S, Rappsilber J, Issaeva I, Canaani E, Salcini AE, Helin K. UTX and JMJD3 are histone H3K27 demethylases involved in HOX gene regulation and development. Nature. 2007;449:731–734. - PubMed
    1. Andreux PA, Williams EG, Koutnikova H, Houtkooper RH, Champy MF, Henry H, Schoonjans K, Williams RW, Auwerx J. Systems genetics of metabolism: the use of the BXD murine reference panel for multiscalar integration of traits. Cell. 2012;150:1287–1299. - PMC - PubMed
    1. Baird NA, Douglas PM, Simic MS, Grant AR, Moresco JJ, Wolff SC, Yates JR, 3rd, Manning G, Dillin A. HSF-1-mediated cytoskeletal integrity determines thermotolerance and life span. Science. 2014;346:360–363. - PMC - PubMed
    1. Baker MJ, Tatsuta T, Langer T. Quality control of mitochondrial proteostasis. Cold Spring Harb Perspect Biol. 2011;3 - PMC - PubMed
    1. Bender LB, Cao R, Zhang Y, Strome S. The MES-2/MES-3/MES-6 complex and regulation of histone H3 methylation in C. elegans. Curr Biol CB. 2004;14:1639–1643. - PubMed

Publication types

MeSH terms

Substances