. 2016 Jun 17;291(25):13194-205.
doi: 10.1074/jbc.M115.700534. Epub 2016 Apr 26.

Deletion of Amino Acid Transporter ASCT2 (SLC1A5) Reveals an Essential Role for Transporters SNAT1 (SLC38A1) and SNAT2 (SLC38A2) to Sustain Glutaminolysis in Cancer Cells

Affiliations

Deletion of Amino Acid Transporter ASCT2 (SLC1A5) Reveals an Essential Role for Transporters SNAT1 (SLC38A1) and SNAT2 (SLC38A2) to Sustain Glutaminolysis in Cancer Cells

Angelika Bröer et al. J Biol Chem. .

Abstract

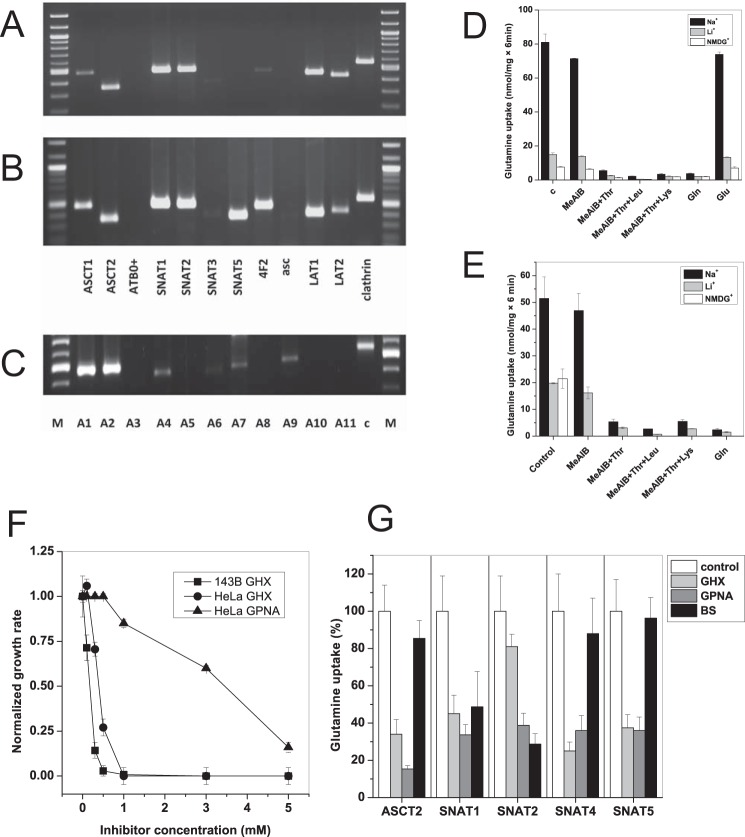
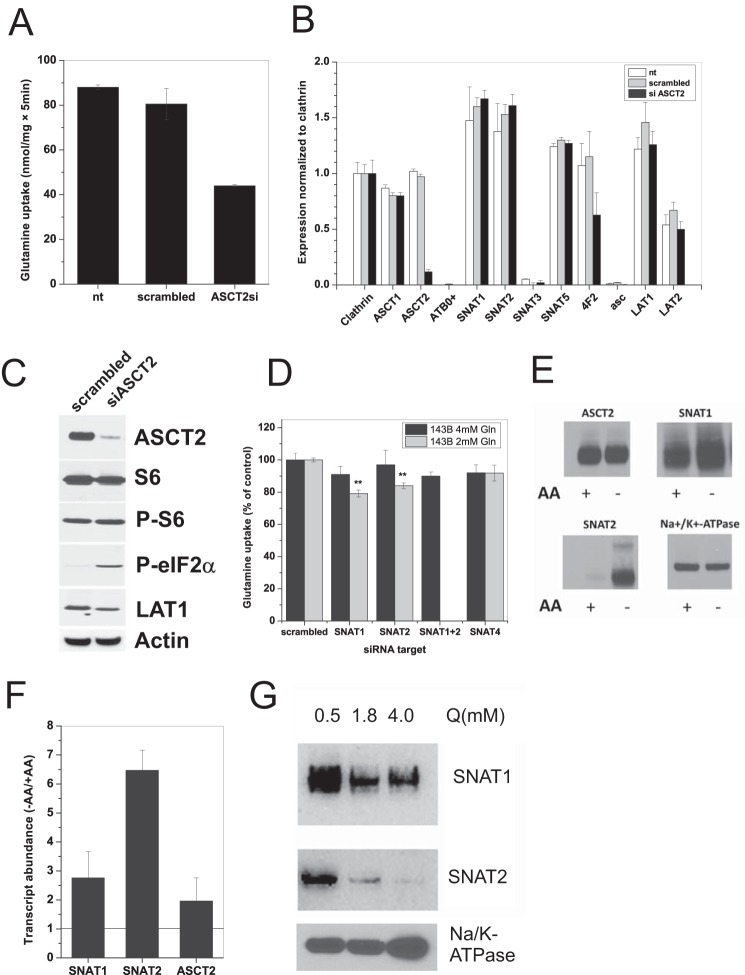
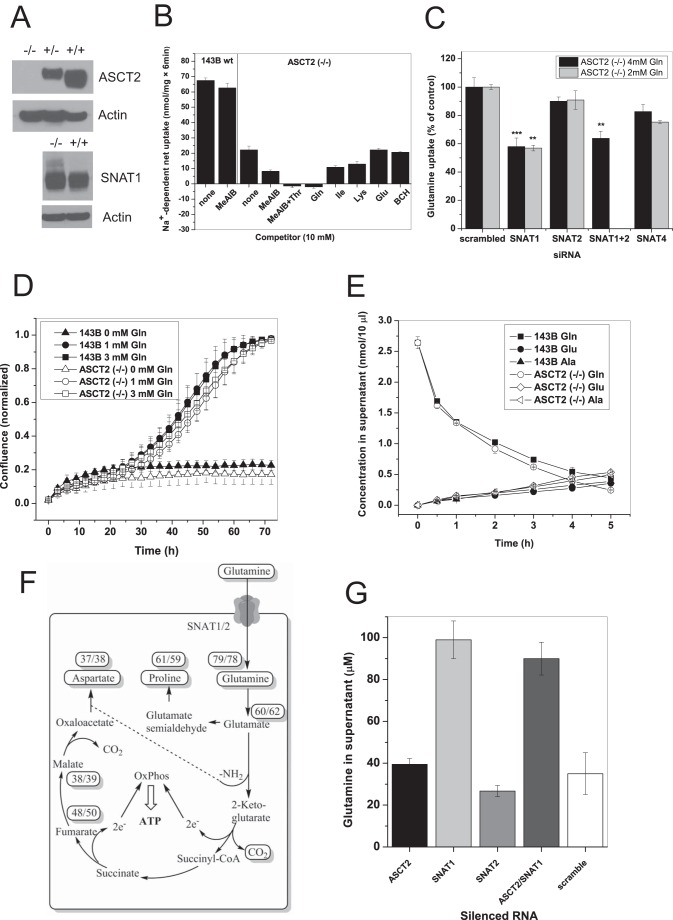
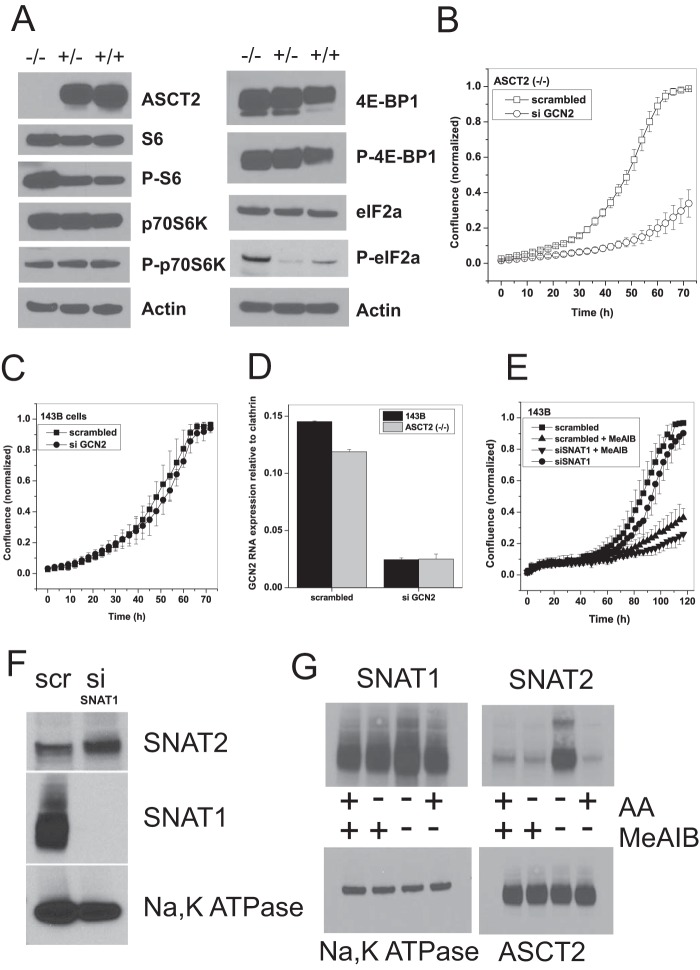
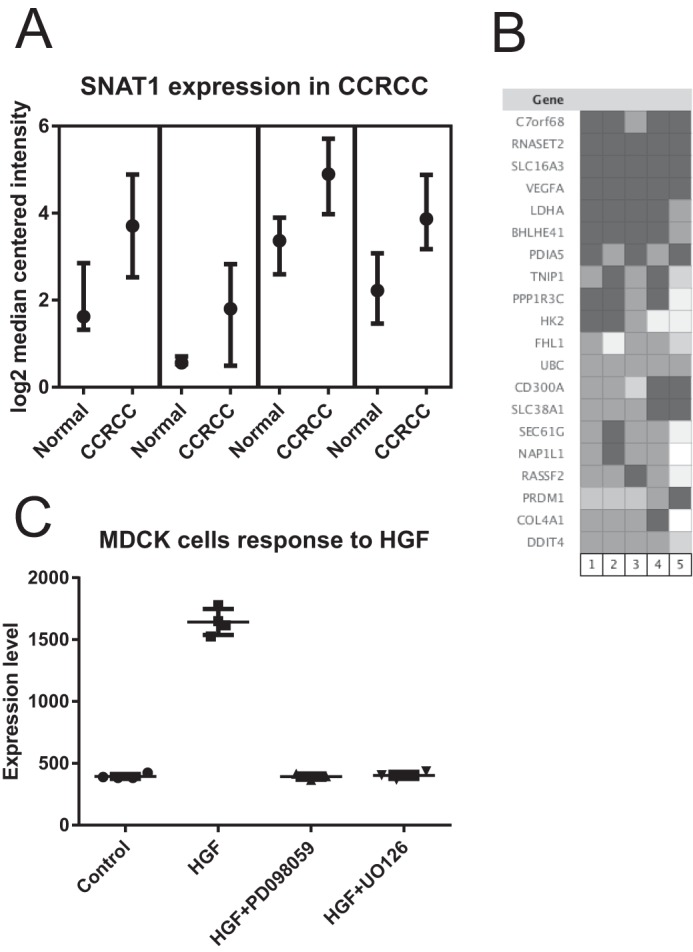
Many cancer cells depend on glutamine as they use the glutaminolysis pathway to generate building blocks and energy for anabolic purposes. As a result, glutamine transporters are essential for cancer growth and are potential targets for cancer chemotherapy with ASCT2 (SLC1A5) being investigated most intensively. Here we show that HeLa epithelial cervical cancer cells and 143B osteosarcoma cells express a set of glutamine transporters including SNAT1 (SLC38A1), SNAT2 (SLC38A2), SNAT4 (SLC38A4), LAT1 (SLC7A5), and ASCT2 (SLC1A5). Net glutamine uptake did not depend on ASCT2 but required expression of SNAT1 and SNAT2. Deletion of ASCT2 did not reduce cell growth but caused an amino acid starvation response and up-regulation of SNAT1 to replace ASCT2 functionally. Silencing of GCN2 in the ASCT2(-/-) background reduced cell growth, showing that a combined targeted approach would inhibit growth of glutamine-dependent cancer cells.

Keywords: amino acid transport; cell growth; glutamine; mammalian target of rapamycin (mTOR); membrane transport.


Figures

FIGURE 1.
FIGURE 1.
Expression of glutamine transporters in cancer cell lines. A panel of glutamine transporter mRNAs was analyzed by RT-PCR in 143B cells (A and C) or HeLa cells (B). Glutamine transporters are listed by their common names in A and B; members of the SNAT family (C) are listed by number, i.e. SNAT1 = A1. c, clathrin; M, marker lane. D and E, uptake of 100 μm [14C]glutamine was measured in 143B (D) or HeLa cells (E) in the presence of competing amino acids or analogues (10 mm). To discriminate between Na+-dependent and Na+-independent amino acid transporters, experiments were performed in Hanks' balanced salt solution containing NaCl or its replacement LiCl or N-methyl-d-glucamine (NMDG) (n = 3, e = 3). The difference between LiCl and N-methyl-d-glucamine condition indicates a possible involvement of SNAT3 or SNAT5. Inhibition of Na+-dependent transport by MeAIB suggests participation of SNAT1 or SNAT2. Inhibition by threonine suggests involvement of ASCT2 or LAT2. Inhibition by leucine suggests involvement of LAT1 or LAT2. Complete inhibition by the combination of MeAIB, threonine, and leucine suggests that no other glutamine transporters are involved. F, inhibition of cell growth (HeLa or 143B cells as indicated) by glutamine analogue l-γ-glutamyl-hydroxamate (GHX) or l-γ-glutamyl-p-nitroanilide (GPNA) (n = 10, e = 3). G, specificity of inhibitors was tested in X. laevis oocytes expressing human isoforms of ASCT2, SNAT1, SNAT2, SNAT4, and SNAT5. Uptake was measured using 100 μm [14C]glutamine in the presence of 3 mm inhibitor (n = 10, e = 3). Error bars in panels represent S.D. BS, benzylserine.
FIGURE 2.
FIGURE 2.
Silencing of ASCT2 reduces glutamine uptake and elicits an amino acid starvation signal. A, siRNA-induced ASCT2 silencing reduced uptake of 100 μm [14C]glutamine by more than 50% (n = 3, e = 4). Scrambled siRNA did not show a significant effect. nt, non-transfected. B, siRNA-induced ASCT2 silencing was specific. Apart from a reduction of 4F2hc mRNA, expression of no other amino acid transporter was affected as measured by RT-PCR (e = 3). C, siRNA-induced ASCT2 silencing was confirmed at the protein level by Western blotting. Immunodetection revealed no change of the total amount of ribosomal protein S6 and its phosphorylated form. However, an increase of P-eIF2α was observed, indicating amino acid starvation. LAT1 protein expression was slightly reduced. Actin was used as a loading control. D, specific siRNA constructs were used to evaluate the contribution of different transporters to glutamine uptake. Silencing experiments were performed in wild-type 143B cells, which were grown in DMEM/Ham's F-12 supplemented with 10% FBS and 4 mm glutamine (black bars) or 2 mm glutamine (gray bars). In the presence of 4 mm glutamine, only small contributions to glutamine uptake by SNAT1, SNAT2, and SNAT4 were observed. The contribution by SNAT1 and SNAT2 became significant when grown in the presence of 2 mm glutamine (n = 3, e = 3). E, amino acid depletion increases SNAT1 and SNAT2 expression. Surface expression of ASCT2, SNAT1, or SNAT2 was determined by immunoblotting after surface biotinylation of 143B cells grown in complete medium (+AA) or after 12-h incubation in Hanks' balanced salt solution supplemented with 5 mm glucose and 200 μm glutamine (−AA). Na+/K+-ATPase was used as a loading control (e = 3). F, quantification of transporter mRNA expression by RT-PCR after amino acid depletion. 143B cells were incubated for 12 h in Hanks' balanced salt solution containing 5 mm glucose and 200 μm glutamine to deplete internal amino acids (−AA). Transcript levels were compared with cells grown in complete medium (+AA) (e = 3). G, SNAT1 and SNAT2 surface expression is glutamine-dependent. Cells were grown in DMEM/Ham's F-12 supplemented with 10% dialyzed FBS and different concentrations of glutamine (Q). All other amino acids were present at standard medium concentrations. Surface biotinylation combined with immunoblotting was used to determine transporter abundance. Na+/K+-ATPase was used as a loading control (e = 2). Error bars in panels represent S.D. AA, amino acids.
FIGURE 3.
FIGURE 3.
Genomic mutation of ASCT2 in 143B cells. A, CRISPR/Cas9 methodology was used to mutate ASCT2, resulting in complete ablation of ASCT2 protein expression. An increase of a higher molecular weight band was observed upon immunodetection of SNAT1 in ASCT2(−/−) cells, most likely representing glycosylated SNAT1. Actin was used as a loading control. B, characterization of 100 μm [14C]glutamine uptake in ASCT2(−/−) cells using amino acids and analogues using the same principles as in Fig. 1D. Glutamine uptake was reduced by 68% when compared with parental cells (column 1 versus column 3). The fraction of glutamine uptake that was inhibited by MeAIB increased in ASCT2(−/−) cells (n = 3, e = 3), indicating an increased contribution by SNAT1/2. Glutamine transport was completely inhibited by the combination of MeAIB and Thr. 2-Aminobicyclo-(2,2,1)-heptane-2-carboxylic acid (BCH), a typical inhibitor of LAT1 and LAT2, did not affect glutamine uptake. C, silencing of SNAT1, SNAT2, and SNAT4 in ASCT2(−/−) cells grown in DMEM/Ham's F-12 supplemented with 10% FBS and 4 mm glutamine (black bars) or 2 mm glutamine (gray bars) (n = 3, e = 3). The experiment was performed under the same condition in 143B parental cells as shown in Fig. 2D. D, growth curve of parental 143B cells and ASCT2(−/−) cells when cultured in DMEM/Ham's F-12 supplemented with dialyzed FBS (10%) and the indicated concentrations of glutamine (n = 10, e = 3). E, glutamine consumption of parental 143B cells and ASCT2(−/−) cells was measured in Hanks' balanced salt solution supplemented with 5 mm glucose and 200 μm glutamine. Samples were removed from the supernatant at the indicated times for amino acid analysis (n = 3, e = 2). F, metabolism of [13C5]glutamine in parental 143B cells and ASCT2(−/−) cells was analyzed by GC-MS. Cells were grown in DMEM/Ham's F-12 supplemented with dialyzed FBS and 4 mm [13C5]glutamine. Enrichment of each metabolite is given in percent (parental/ASCT2(−/−)) (e = 3). G, silencing of glutamine transporters in 143B parental cells showed a significant increase of extracellular glutamine (reduced glutamine consumption) upon silencing of SNAT1. No further increase was observed when SNAT1 and ASCT2 were silenced in combination (n = 3, e = 3). Error bars in growth assays represent S.E.; in all other panels error bars represent S.D. OxPhos, oxidative phosphorylation.
FIGURE 4.
FIGURE 4.
Genomic mutation of ASCT2 induces amino acid starvation. A, signaling through mTOR appeared to be unchanged in ASCT2(−/−) cells as evidenced by immunoblotting of mTOR downstream targets ribosomal protein S6, p70S6 kinase, and 4E-BP-1 and their phosphorylated forms (for phosphorylation sites, see Table 2). However, an increase in phosphorylation of eIF2α was consistently observed (e = 3), indicating amino acid starvation. Actin was used as a loading control. B, silencing of GCN2 severely blunted the growth of ASCT2(−/−) cells (n = 10, e = 3) but had little effect on the growth of parental 143B cells (C) (n = 10, e = 3). D, silencing of GCN2 mRNA in 143B parental and ASCT2(−/−) cells was confirmed by RT-PCR (e = 3). E, combination of SNAT1 silencing with the SNAT1/2 inhibitor MeAIB strongly reduced cell growth in parental cells (n = 10, e = 2). F, silencing of SNAT1 abolished protein expression and induced elevated expression of SNAT2 (e = 2). Na+/K+-ATPase was used as a loading control. scr, scrambled; si, RNA silencing. G, effect of MeAIB on surface expression of SNAT1 or SNAT2 after induction of SNAT2 using 12-h incubation in Hanks' balanced salt solution, 5 mm glucose, 200 μm glutamine (−AA). Incubation of cells in complete medium is indicated as (+AA) (e = 2). Na+/K+-ATPase was used as a loading control. Error bars in growth assays represent S.E.; in all other panels error bars represent S.D. AA, amino acids.
FIGURE 5.
FIGURE 5.
Proposed model of neutral amino acid homeostasis in cancer cells. Amino acid symporters and exchangers work in combination to ensure a homeostatic intracellular mixture of all neutral amino acids. SNAT1 is a major net importer (loader) of neutral amino acids including glutamine as a substrate for glutaminolysis. Amino acid exchangers (harmonizers) quickly harmonize amino acid composition in times of imbalanced amino acid usage. An imbalance of the amino acid composition results in an amino acid starvation response, which increases SNAT2 expression (rescue). AA, amino acid.
FIGURE 6.
FIGURE 6.
Database evaluation of SNAT1 expression in cancer tissue and cells using Oncomine. A, significantly elevated levels of SNAT1 mRNA were detected in four studies of CCRCC. Depending on the study, samples from normal adjacent tissue or matched normal control tissue were used to generate the control microarrays. In all studies, mRNA expression levels were normalized to the median intensity of all spots on the microarray and plotted as log2 median-centered intensity. B, coexpression analysis revealed that SNAT1 (SLC38A1 in the figure) was highly expressed together with HIF1α target genes in clear cell renal cell carcinoma. C, expression of SNAT1 may be driven by the hepatic growth factor (HGF) oncogenic pathway. Overexpression of hepatic growth factor in Madin-Darby canine kidney (MDCK) cells significantly increases expression of SNAT1. The response can be blocked by mitogen-activated protein kinase inhibitors. Data variance is shown as box plots indicating upper limit, median, and lower limit.

Similar articles

Cited by

References

    1. Chandel N. S. (2015) Navigating Metabolism, Cold Spring Harbor Laboratory Press, Cold Spring Harbor, NY
    1. Newsholme E. A., Crabtree B., and Ardawi M. S. (1985) Glutamine metabolism in lymphocytes: its biochemical, physiological and clinical importance. Q. J. Exp. Physiol. 70, 473–489 - PubMed
    1. Wise D. R., and Thompson C. B. (2010) Glutamine addiction: a new therapeutic target in cancer. Trends Biochem. Sci. 35, 427–433 - PMC - PubMed
    1. Kung H. N., Marks J. R., and Chi J. T. (2011) Glutamine synthetase is a genetic determinant of cell type-specific glutamine independence in breast epithelia. PLoS Genet. 7, e1002229. - PMC - PubMed
    1. Vander Heiden M. G., Cantley L. C., and Thompson C. B. (2009) Understanding the Warburg effect: the metabolic requirements of cell proliferation. Science 324, 1029–1033 - PMC - PubMed