. 2016 May 3;7(18):24908-27.
doi: 10.18632/oncotarget.8795.

Type I collagen aging impairs discoidin domain receptor 2-mediated tumor cell growth suppression

Affiliations

Type I collagen aging impairs discoidin domain receptor 2-mediated tumor cell growth suppression

Charles Saby et al. Oncotarget. .

Abstract

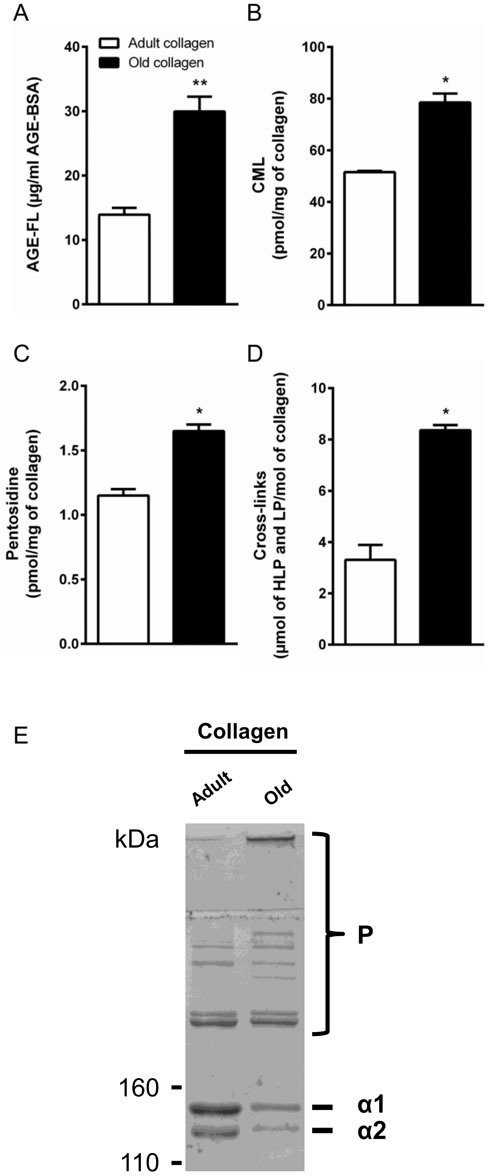
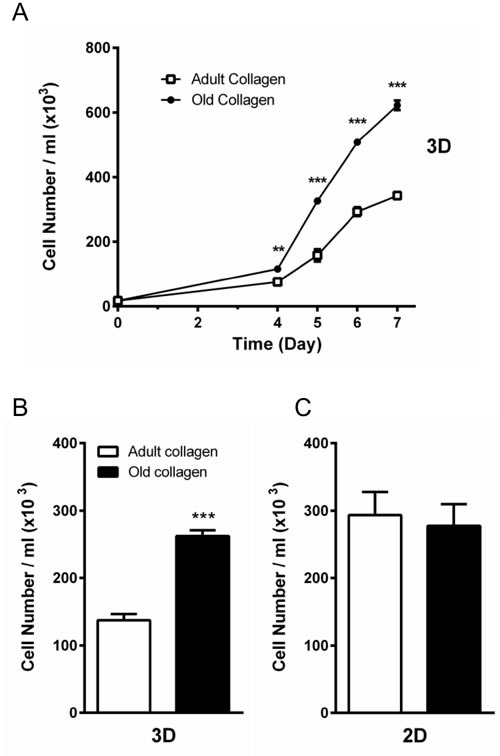
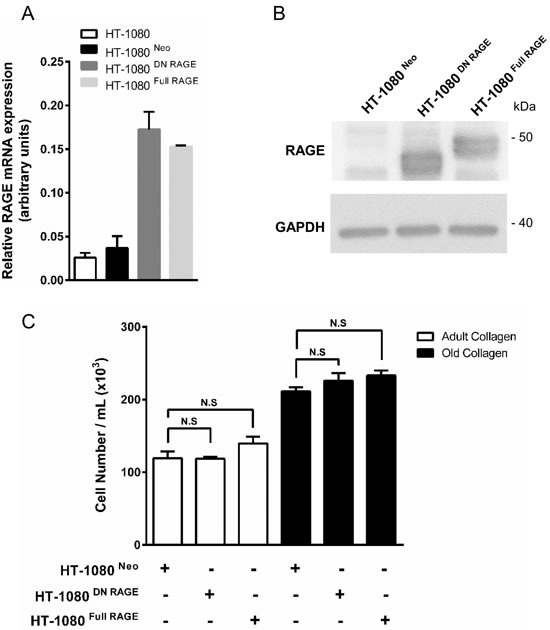
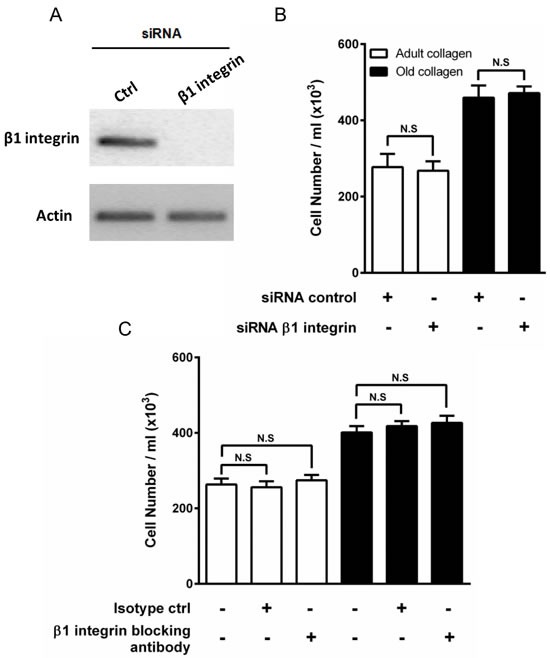
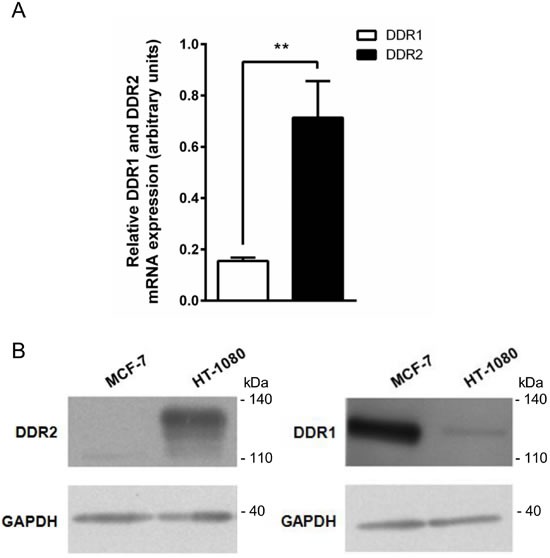
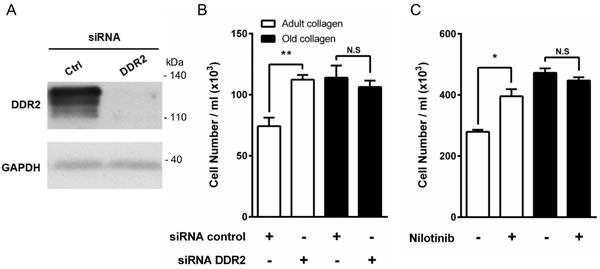
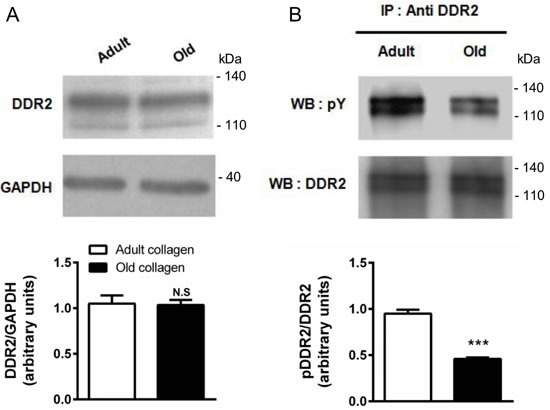
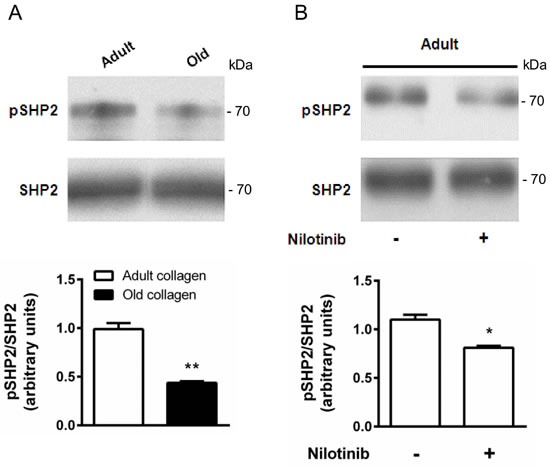
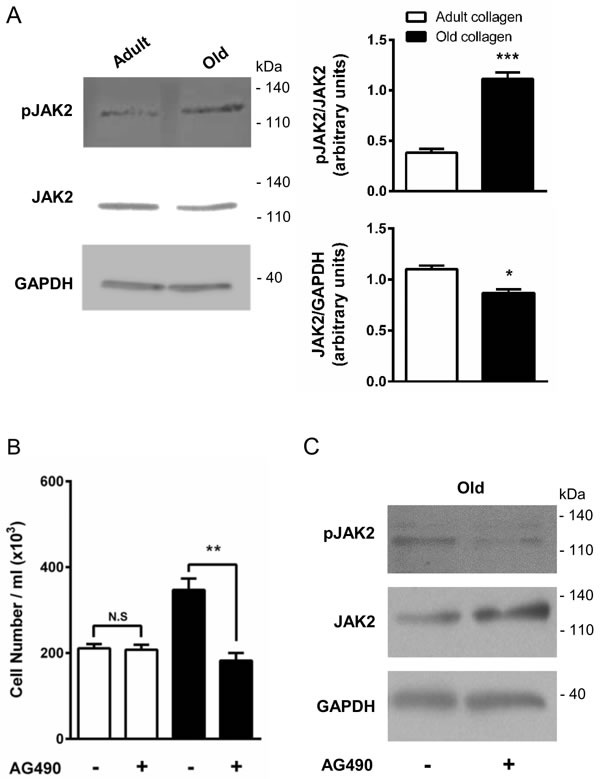
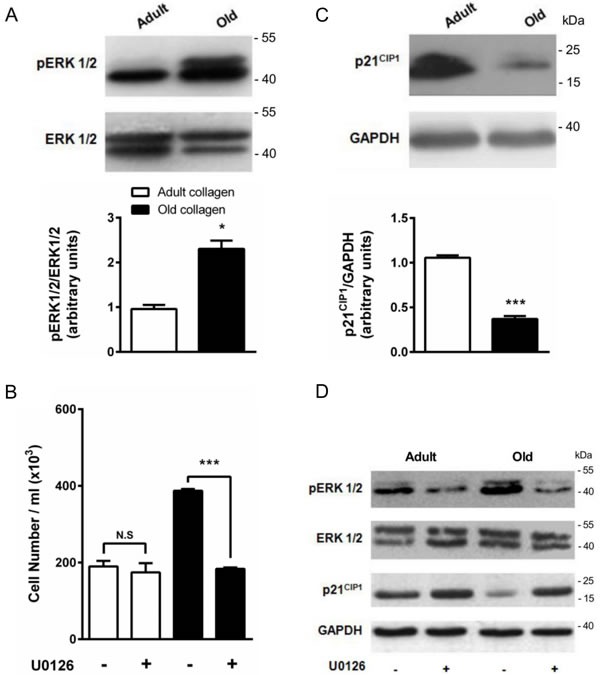
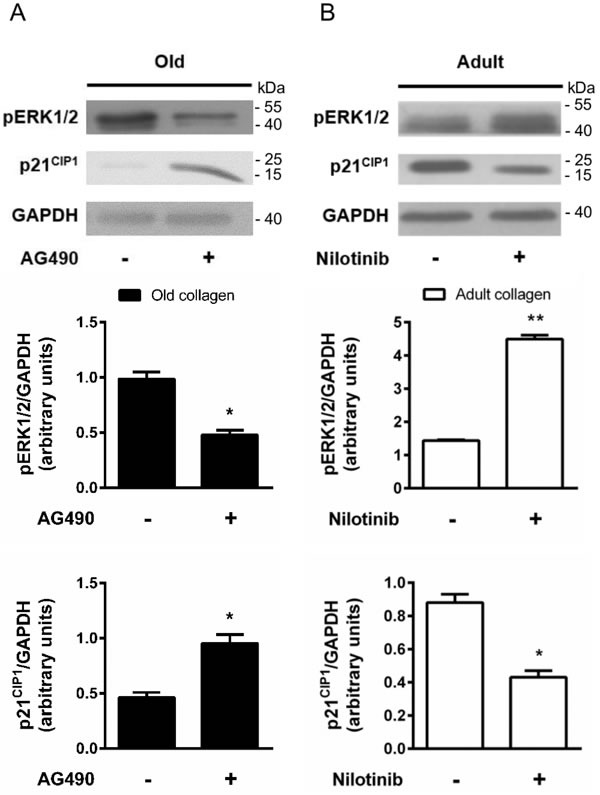
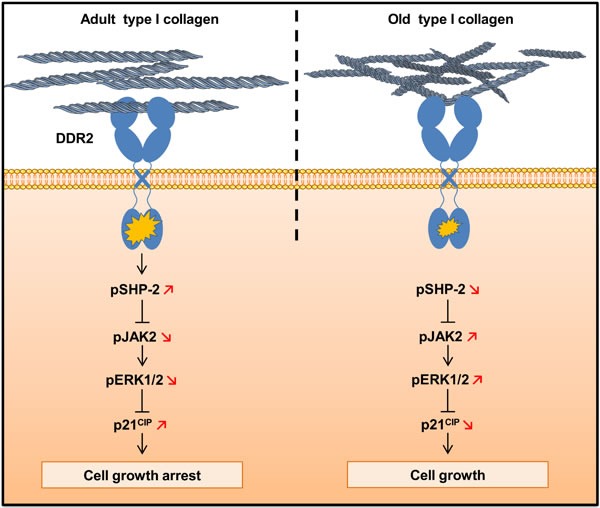
Tumor cells are confronted to a type I collagen rich environment which regulates cell proliferation and invasion. Biological aging has been associated with structural changes of type I collagen. Here, we address the effect of collagen aging on cell proliferation in a three-dimensional context (3D).We provide evidence for an inhibitory effect of adult collagen, but not of the old one, on proliferation of human fibrosarcoma HT-1080 cells. This effect involves both the activation of the tyrosine kinase Discoidin Domain Receptor 2 (DDR2) and the tyrosine phosphatase SHP-2. DDR2 and SHP-2 were less activated in old collagen. DDR2 inhibition decreased SHP-2 phosphorylation in adult collagen and increased cell proliferation to a level similar to that observed in old collagen.In the presence of old collagen, a high level of JAK2 and ERK1/2 phosphorylation was observed while expression of the cell cycle negative regulator p21CIP1 was decreased. Inhibition of DDR2 kinase function also led to an increase in ERK1/2 phosphorylation and a decrease in p21CIP1 expression. Similar signaling profile was observed when DDR2 was inhibited in adult collagen. Altogether, these data suggest that biological collagen aging could increase tumor cell proliferation by reducingthe activation of the key matrix sensor DDR2.

Keywords: Gerotarget; aging; cancer; cell proliferation; discoidin domain receptor 2; type I collagen.


Conflict of interest statement

There is no conflict of interest.

Figures

Figure 1
Figure 1. Characterization of collagens
A. Spectrofluorimetric analysis was performed on adult and old collagen to detect AGEs-specific fluorescence expressed as μg/ml. B. CML and C. Pentosidine were quantified by LC-MS/MS and expressed as pmol/mg of collagen. D. Cross-link content was measured by the quantification of hydroxylysylpyridinoline (HLP) and lysylpyrodinoline (LP) by ion exchange chromatography and expressed as μmol (LHP and LP)/mol of collagen. E. SDS-PAGE of collagen samples, 5 μg of either adult or old rat type I collagens were analyzed on 5% polyacrylamide gels under reducing conditions. Collagen chains (α 1 and α 2), and higher-molecular-weight polymers (P) are indicated. Values represent the mean ± S.E.M. of three independent experiments (*p < 0.05, **p < 0.01).
Figure 2
Figure 2. Effect of collagen aging on HT-1080 cell proliferation in 2D and 3D matrices
A. HT-1080 cells were seeded in adult and old type I collagen 3D matrices at a density of 1.5 × 10⁴ cells/ml. After 4, 5, 6 and 7 days of culture, cell density was evaluated by phase contrast microscopy. B. HT-1080 cells were seeded in adult and old type I collagen 3D matrices at a density of 1.5 × 10⁴ cells/ml. After 5 days of culture, cell density was evaluated. C. HT-1080 cells were seeded on adult and old type I collagen 2D coating at a density of 1.5 × 10⁴ cells/ml. After 5 days of culture, cell density was evaluated by phase contrast microscopy. Values represent the mean ± S.E.M. of three independent experiments (**p < 0.01, ***p < 0.001).
Figure 3
Figure 3. RAGE expression in parental and RAGE-transfected HT-1080 cells, and effect of collagen aging on cell proliferation
Parental HT-1080 and HT-1080 cells stably transfected with empty vector (HT-1080 Neo), human full length RAGE (HT-1080 Full RAGE) and dominant negative RAGE (HT-1080 DN RAGE) were cultured on plastic. A. RAGE transcripts contents in each cell lines were evaluated by real-time quantitative polymerase chain reaction. B. RAGE protein expression was analyzed by western blot. Glyceraldehyde 3-phosphate deshydrogenase (GAPDH) was used as a loading control. C. Parental and transfected HT-1080 cells were seeded in adult and old type I collagen 3D matrices at a density of 1.5 × 10⁴ cells/ml. After 5 days of culture, cell density was evaluated by phase contrast microscopy. Data shown are representative of three independent experiments (N.S. = not significant).
Figure 4
Figure 4. Effect of β1 integrin inhibition on HT-1080 cell proliferation
A. HT-1080 cells were transfected with control siRNA (Ctrl) or β1 integrin siRNA. β1 integrin expression was analyzed by RT-PCR. Actin was used as a control. HT-1080 cells were seeded in adult and old type I collagen 3D matrices at a density of 5 × 10⁴ cells/ml, with or without B. siRNA directed against β1 integrin, or C. blocking antibody against β1 integrin (10 μg/ml). After 5 days of culture, cell density was evaluated by phase contrast microscopy. Values represent the mean ± S.E.M. of three independent experiments (N.S. = not significant).
Figure 5
Figure 5. DDR1 and DDR2 expression in HT-1080 and MCF-7 cells
HT-1080 and MCF-7 cells were cultured on plastic. A. DDR2 and DDR1 transcripts contents in HT-1080 cells were evaluated by real-time quantitative polymerase chain reaction. B. DDR2 (left panel) and DDR1 (right panel) protein expression was analyzed by western blot. Glyceraldehyde 3-phosphate dehydrogenase (GAPDH) was used as a loading control. Data shown are representative of three independent experiments (**p < 0.01, ***p < 0.001).
Figure 6
Figure 6. Effect of DDR2 inhibition on HT-1080 cell proliferation
A. HT-1080 cells were transfected with control siRNA (Ctrl) or DDR2 siRNA. DDR2 expression was analyzed by immunoblotting. GAPDH was used as a loading control. B. HT-1080 cells were seeded in adult and old type I collagen 3D matrices at a density of 1.5 × 10⁴ cells/ml, with or without siRNA directed against DDR2. After 5 days of culture, cell density was evaluated by phase contrast microscopy. C. HT-1080 cells were seeded in adult and old type I collagen 3D matrices at a density of 5 × 10⁴ cells/ml, with or without DDR2 inhibitor nilotinib at 100 nM. After 5 days of culture, cell density was evaluated by phase contrast microscopy. Values represent the mean ± S.E.M. of three independent experiments (*p < 0.05, **p < 0.01, N.S. = not significant).
Figure 7
Figure 7. Effect of collagen aging on DDR2 expression and activation
HT-1080 cells were serum starved during 12 hours, then cultured 6 hours in adult and old type I collagen 3D matrices. A. Western blot analysis was performed using anti-DDR2 specific antibody. The histogram shows the ratio of DDR2 expression relative to the loading control GAPDH. B. Immunoprecipitation was performed using anti-DDR2 specific antibody, and DDR2 activation was measured by western blot using anti-phosphotyrosine specific antibody. The histogram shows the ratio of pDDR2 expression relative to DDR2. Values represent the mean ± S.E.M. of three independent experiments (***p < 0.001, N.S. = not significant).
Figure 8
Figure 8. Effect of collagen aging on SHP-2 activation
A. HT-1080 cells were serum starved during 12 hours, then cultured 6 hours in adult and old type I collagen 3D matrices. Western blot analysis was performed using anti-pSHP-2 and SHP-2 specific antibodies. The histogram shows the ratio of pSHP-2 expression relative to SHP-2. B. HT-1080 cells were serum starved during 12 hours, then cultured 6 hours in adult type I collagen 3D matrices, with or without 100 nM of nilotinib. Western blot analysis was performed using anti-pSHP-2 and SHP-2 specific antibodies. The histogram shows the ratio of pSHP-2 expression relative to total SHP-2. Values represent the mean ± S.E.M. of three independent experiments (*p < 0.05, **p < 0.01).
Figure 9
Figure 9. Effect of collagen aging on JAK2 activation and HT-1080 cell proliferation
HT-1080 cells were cultured 5 days in adult and old type I collagen 3D matrices. A. Western blot analysis was performed using pJAK2 and JAK2 specific antibodies. The histogram shows the ratio of pJAK2 and JAK2 expression relative to JAK2 and GAPDH respectively. B. HT-1080 cells were seeded in adult and old type I collagen 3D matrices at a concentration of 1.5 × 10⁴ cells/ml, with or without 10 μM of the JAK2 inhibitor AG490. After 5 days of culture, cell density was evaluated by phase contrast microscopy and C. western blot analysis was performed using pJAK2 and JAK2 specific antibodies. Values represent the mean ± S.E.M. of three independent experiments (*p < 0.05, **p < 0.01, ***p < 0.001).
Figure 10
Figure 10. Effect of collagen aging on ERK1/2 activation and p21CIP1 expression
A. ERK1/2 western blot analysis of HT-1080 cells after 5 days culture in adult and old type I collagen 3D matrices. The histograms show the ratio of pERK1/2 expression relative to total ERK1/2. B. Effect of ERK1/2 inhibitor U0126 on cell proliferation. HT-1080 cells were seeded in adult and old type I collagen 3D matrices at a density of 1.5 × 10⁴ cells/ml, with or without 5 μM U0126. After 5 days of culture, cell density was evaluated by phase contrast microscopy. C. p21CIP1 western blot analysis of HT-1080 cells after 5 days culture in adult and old type I collagen 3D matrices. The histograms show the ratio of p21CIP1 expression relative to GAPDH. D. Effect of U0126 on pERK1/2 and p21CIP1 expression. HT-1080 cells were seeded in adult and old type I collagen 3D matrices at a density of 1.5 × 10⁴ cells/ml, with or without 5 μM U0126. After 5 days of culture, western blot analysis was performed using pERK1/2 and p21CIP1 specific antibodies. Values represent the mean ± S.E.M. of three independent experiments (*p < 0.05, ***p < 0.001).
Figure 11
Figure 11. Effect of DDR2 and JAK2 inhibition on ERK1/2 activation and p21CIP1 expression
A. HT-1080 cells were cultured 5 days in old type I collagen 3D matrices, with or without 10 μM of AG490. Western blot analysis was performed using pERK1/2 and p21CIP1 specific antibodies. The histograms show the ratio of pERK1/2 and p21CIP1 expression relative to GAPDH. B. HT-1080 cells were cultured 5 days in adult type I collagen 3D matrices, with or without 100 nM of nilotinib. Western blot analysis was performed using pERK1/2 and p21CIP1 specific antibodies. The histograms show the ratio of pERK1/2 and p21CIP1 expression relative to GAPDH. Values represent the mean ± S.E.M. of three independent experiments (*p < 0.05, **p < 0.01).
Figure 12
Figure 12. Schematic drawing of DDR2-induced cell growth regulation by type I collagen aging

Similar articles

Cited by

References

    1. Quail DF, Joyce JA. Microenvironmental regulation of tumor progression and metastasis. Nat Med. 2013;19:1423–1437. - PMC - PubMed
    1. Wolf K, Alexander S, Schacht V, Coussens LM, von Andrian UH, van Rheenen J, Deryugina E, Friedl P. Collagen-based cell migration models in vitro and in vivo. Semin Cell Dev Biol. 2009;20:931–941. - PMC - PubMed
    1. Bailey AJ, Paul RG, Knott L. Mechanisms of maturation and ageing of collagen. Mech Ageing Dev. 1998;106:1–56. - PubMed
    1. Logsdon CD, Fuentes MK, Huang EH, Arumugam T. RAGE and RAGE ligands in cancer. Curr Mol Med. 2007;7:777–789. - PubMed
    1. Bartling B, Desole M, Rohrbach S, Silber RE, Simm A. Age-associated changes of extracellular matrix collagen impair lung cancer cell migration. FASEB J. 2009;23:1510–1520. - PubMed

LinkOut - more resources