. 2016 Apr 21:15:232.
doi: 10.1186/s12936-016-1291-9.

An ultrasensitive NanoLuc-based luminescence system for monitoring Plasmodium berghei throughout its life cycle

Affiliations

An ultrasensitive NanoLuc-based luminescence system for monitoring Plasmodium berghei throughout its life cycle

Mariana De Niz et al. Malar J. .

Abstract

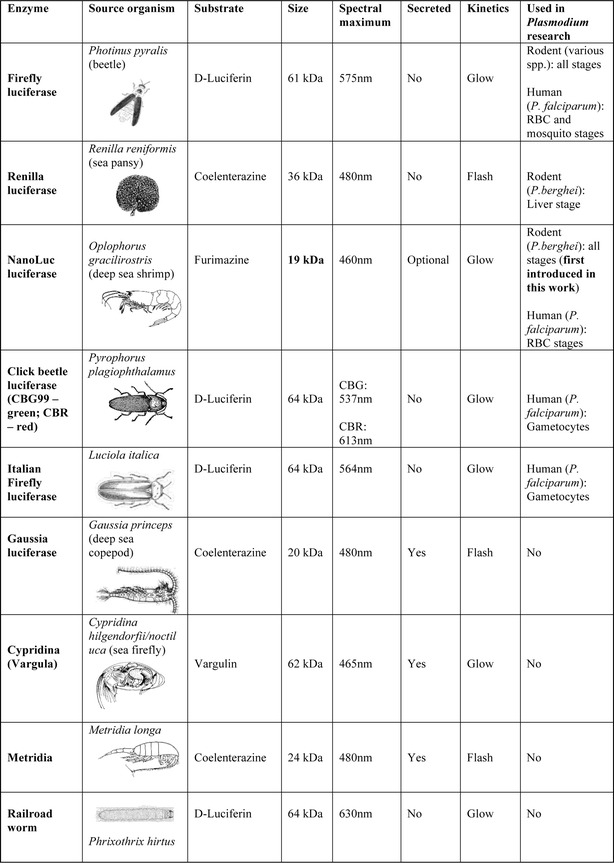
Background: Bioluminescence imaging is widely used for cell-based assays and animal imaging studies, both in biomedical research and drug development. Its main advantages include its high-throughput applicability, affordability, high sensitivity, operational simplicity, and quantitative outputs. In malaria research, bioluminescence has been used for drug discovery in vivo and in vitro, exploring host-pathogen interactions, and studying multiple aspects of Plasmodium biology. While the number of fluorescent proteins available for imaging has undergone a great expansion over the last two decades, enabling simultaneous visualization of multiple molecular and cellular events, expansion of available luciferases has lagged behind. The most widely used bioluminescent probe in malaria research is the Photinus pyralis firefly luciferase, followed by the more recently introduced Click-beetle and Renilla luciferases. Ultra-sensitive imaging of Plasmodium at low parasite densities has not been previously achieved. With the purpose of overcoming these challenges, a Plasmodium berghei line expressing the novel ultra-bright luciferase enzyme NanoLuc, called PbNLuc has been generated, and is presented in this work.

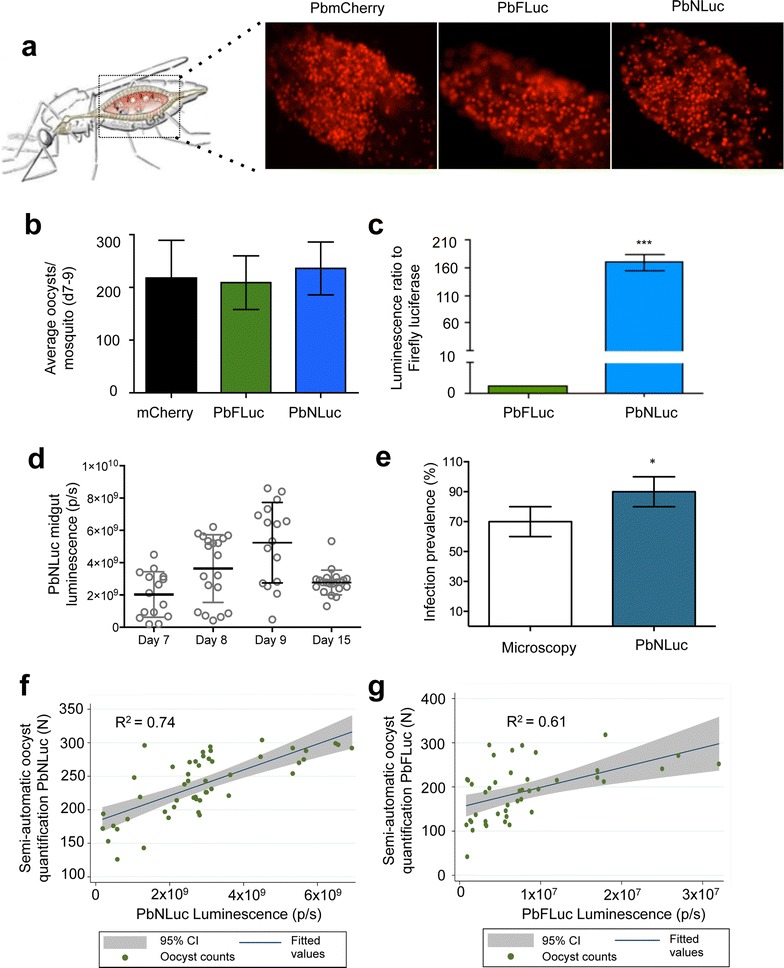
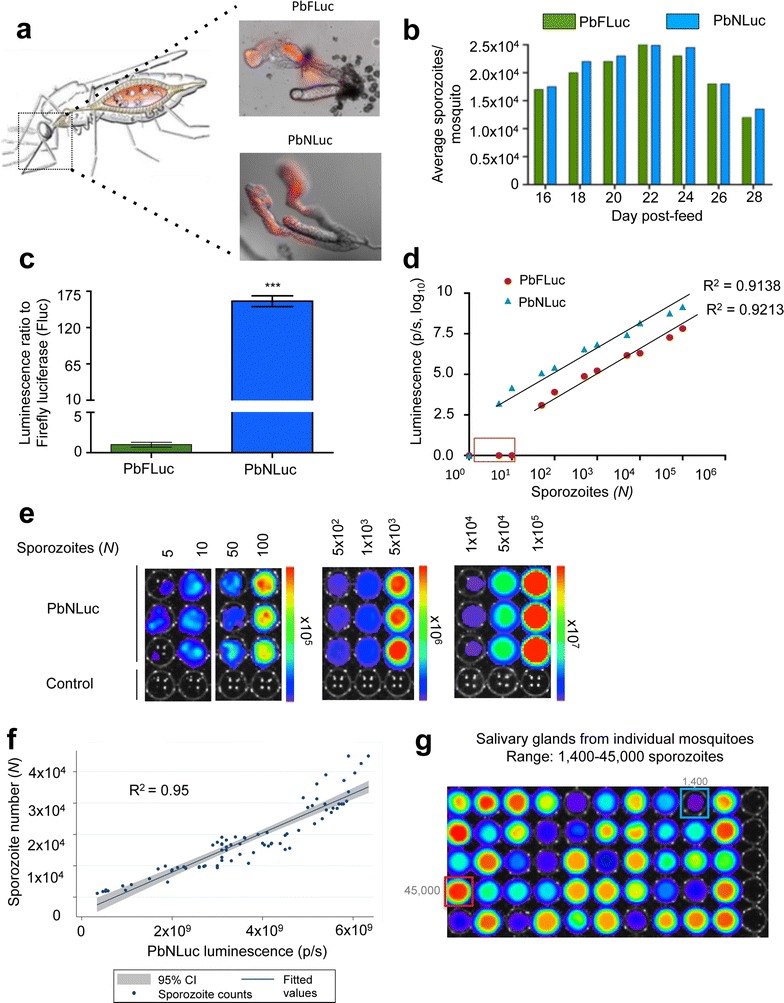
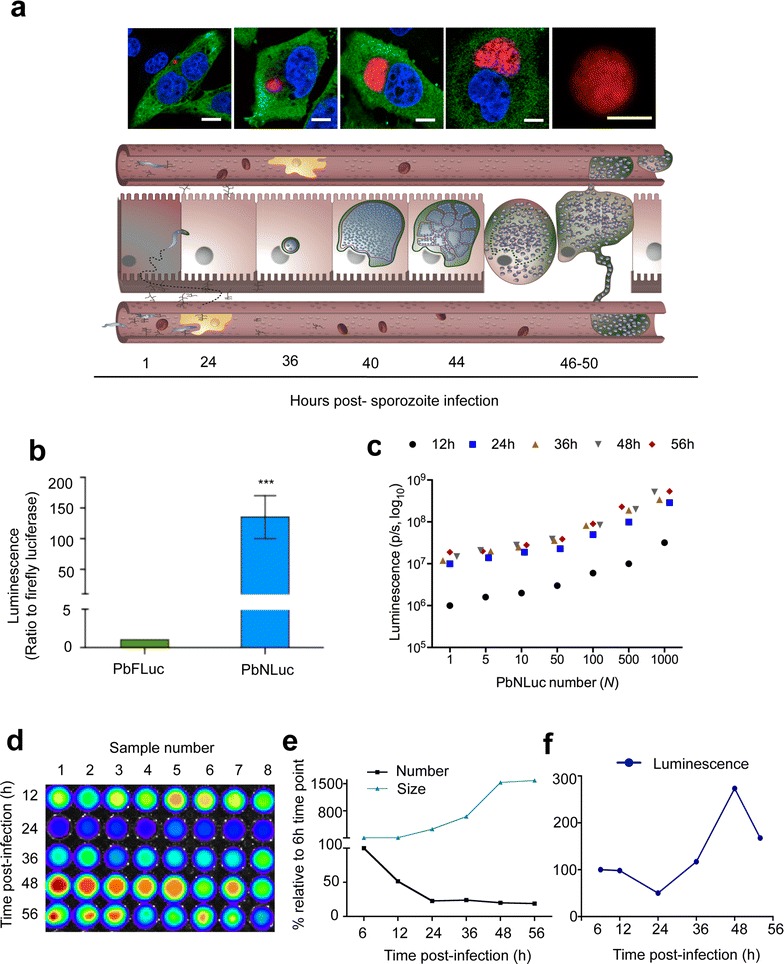
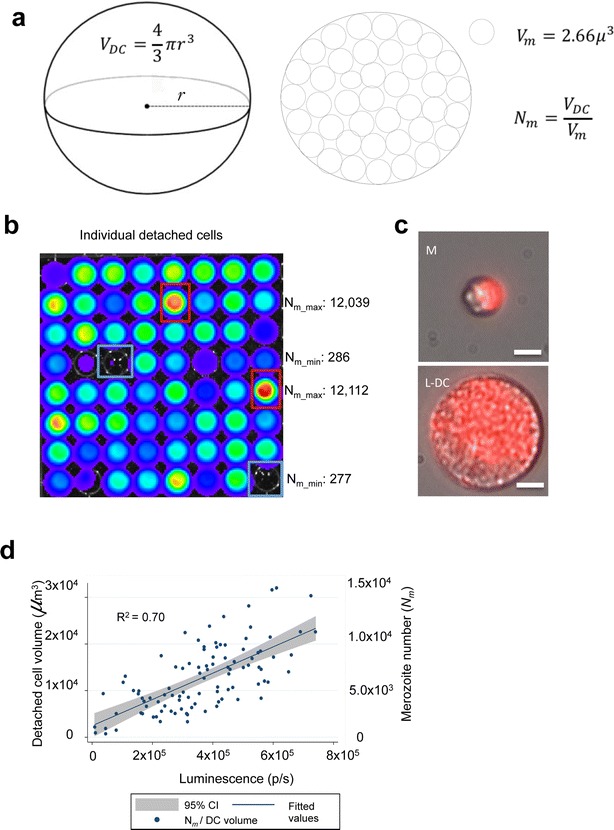
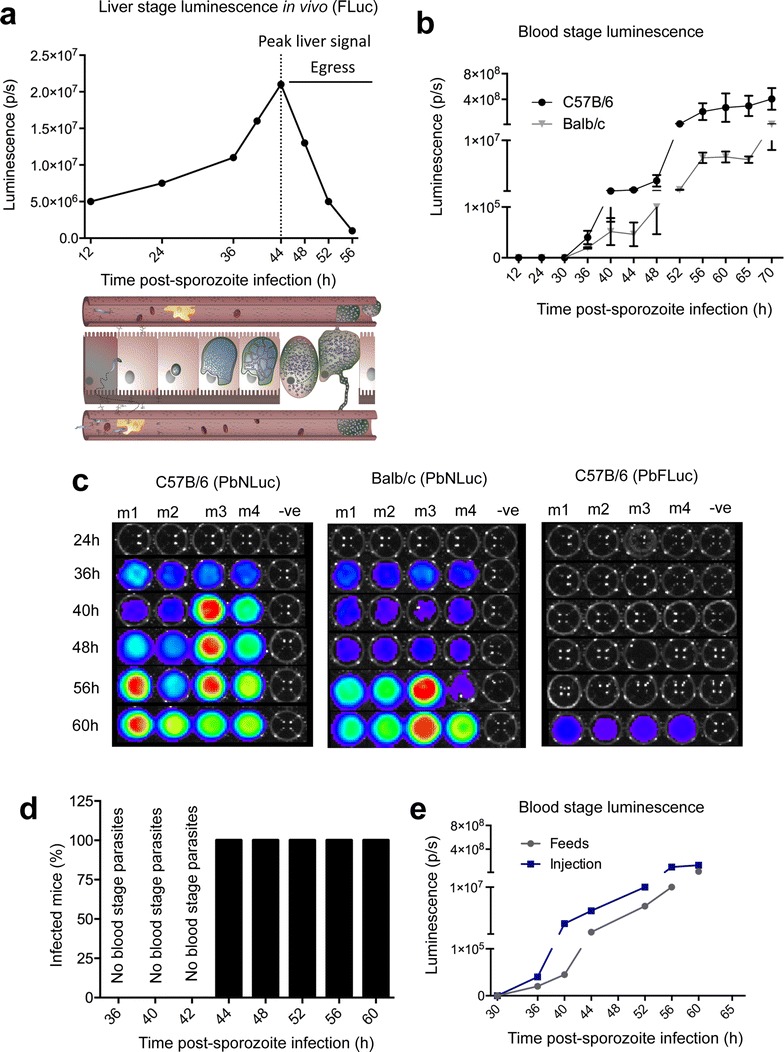
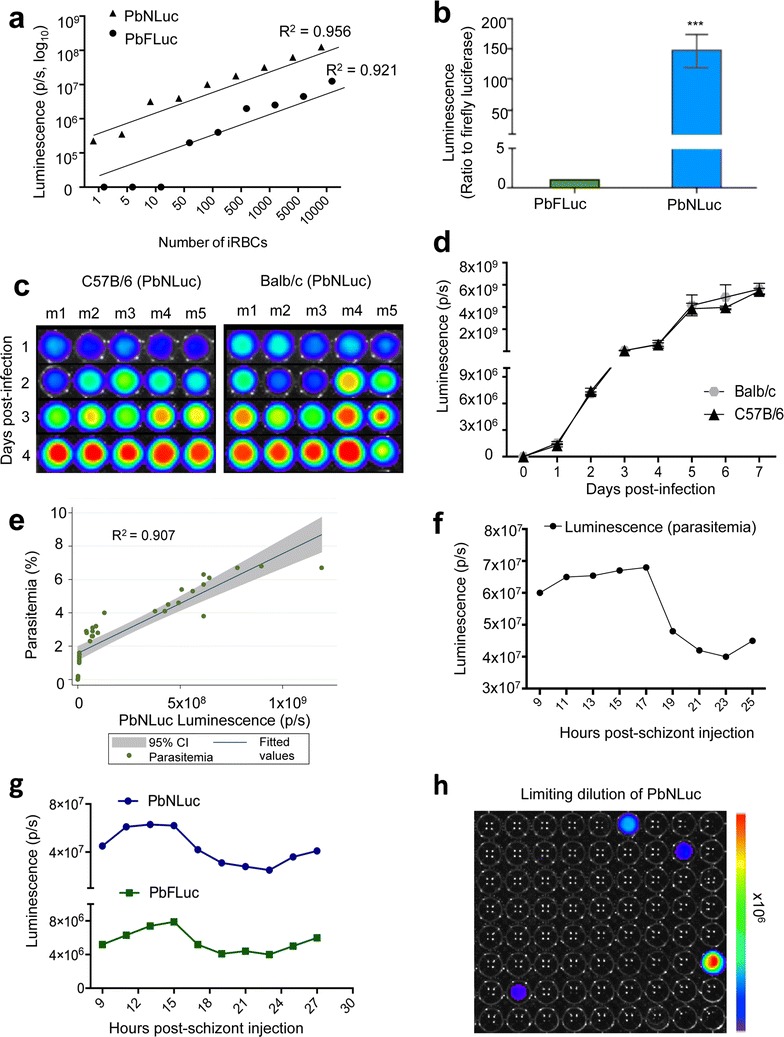
Results: NanoLuc shows at least 150 times brighter signal than firefly luciferase in vitro, allowing single parasite detection in mosquito, liver, and sexual and asexual blood stages. As a proof-of-concept, the PbNLuc parasites were used to image parasite development in the mosquito, liver and blood stages of infection, and to specifically explore parasite liver stage egress, and pre-patency period in vivo.

Conclusions: PbNLuc is a suitable parasite line for sensitive imaging of the entire Plasmodium life cycle. Its sensitivity makes it a promising line to be used as a reference for drug candidate testing, as well as the characterization of mutant parasites to explore the function of parasite proteins, host-parasite interactions, and the better understanding of Plasmodium biology. Since the substrate requirements of NanoLuc are different from those of firefly luciferase, dual bioluminescence imaging for the simultaneous characterization of two lines, or two separate biological processes, is possible, as demonstrated in this work.

Keywords: Bioluminescence; NanoLuc luciferase; PbNLuc; Plasmodium berghei; Ultrabright; Ultrasensitive.


Figures

Fig. 1
Fig. 1
Luminescent proteins used in biomedical research
Fig. 2
Fig. 2
Bioluminescence imaging of oocysts in mosquito midguts. a Representative fluorescence images of dissected midguts from PbmCherry, PbFLuc, and PbNLuc-infected mosquitoes. b Average oocyst numbers in PbmCherry, PbFLuc and PbNLuc-infected midguts at days 7–9 post-feed. c Luminescence ratio obtained from 50 mosquitoes infected with PbFLuc or PbNLuc lines (PbFLuc set as 1). d Comparative analysis of prevalence of PbNLuc infection in mosquitoes. Luminescence values of PbNLuc-infected mosquitoes at days 7–9 post-feed, prior to oocyst rupture and sporozoite egress, and at day 15 post-feed, following initial sporozoite egress events. e At day 9 post-feed, 200 mosquitoes were sorted by fluorescence into ‘infected’ and ‘uninfected’. Based on these data, the prevalence of infection was calculated. The same mosquitoes were dissected and the midguts lysed for bioluminescence assays and infection prevalence calculation. f Scatter plot showing correlation and 95 % confidence interval range (CI) of PbNLuc bioluminescence values to fluorescence-based semi-automated counts. 100 individual PbNLuc-infected mosquitoes (represented by each dot) were dissected, and their midguts extracted. Oocyst numbers for each individual midgut were quantified using a semi-automated fluorescence-based macro (y-axis). Midguts were then lysed and imaged by luminescence (x-axis). g Scatter plot showing correlation and 95 % CI range of PbFLuc bioluminescence values to fluorescence-based semi-automated counts. Experimental setup as described for (f). [Graphs are the result of triplicate experiments. Luminescence values are expressed as photons per second (p/s); *p < 0.05; ***p < 0.001; error bars in graphs represent standard deviations (SD)]
Fig. 3
Fig. 3
Bioluminescence imaging of sporozoites in mosquito salivary glands. a Representative images obtained by fluorescence microscopy, of dissected salivary glands from PbFLuc, and PbNLuc-infected mosquitoes. b Average sporozoite numbers per mosquito at days 16–28 post-feed, in groups of PbFLuc and PbNLuc-infected mosquitoes. c Luminescence ratio of PbFLuc and PbNLuc sporozoites. Four sets of 50,000 sporozoites from 10 separate mosquitoes each, for either PbFLuc or PbNLuc, were isolated from the salivary glands, and their luminescence acquired. The value for PbFLuc luminescence was set to a value of 1, and the value of PbNLuc luminescence expressed in relation to the PbFLuc value. d Correlation of luminescence values of PbNLuc and PbFLuc, and detection limit obtained by imaging 1–106 sporozoites (Square at axis shows no signal from PbFLuc at low sporozoite densities). 20 independent mosquitoes were dissected, and their sporozoites diluted to the specific values shown in the figure. R2 corresponds to values over the detection limit of each respective parasite line. e Images from 3 independent dilutions of sporozoites (obtained from pools of 20 independent mosquitoes each). Measurements of different sporozoite concentrations were made in separate plates to avoid under-detection, or signal saturation in the presence of extremely high luminescence values. f Scatter plot showing correlation and 95 % CI range of PbNLuc luminescence values of 100 individual mosquitoes to manual counts in a Neubauer chamber. 100 individual PbNLuc-infected mosquitoes (represented by each dot) were dissected, and their salivary glands extracted. Sporozoite numbers for each individual mosquito dissected were quantified manually using a Neubauer chamber (y-axis). Sporozoites were then lysed and imaged by luminescence (x-axis). g Representative IVIS image of individual dissected and disrupted salivary glands (salivary glands from one uninfected mosquito is used as control in every row) Blue and red outlines show, respectively, minimum and maximum detected sporozoite loads. (luminescence values are expressed as photons per second (p/s) (linear or logarithmic) [***p < 0.001; error bars in all graphs represent standard deviations (SD)]
Fig. 4
Fig. 4
Bioluminescence imaging of P. berghei pre-erythrocytic stages. a Fluoresence images of liver cells infected with PbNLuc, showing parasite development from 2 h to egress. Scale bar is equal to 15 μm. The lower panel shows a schematic representation of liver stage development at the corresponding time points. b Ratio of luminescence between PbFLuc and PbNLuc signal arising from 6 independent sets of HepG2 cells infected with 10,000 sporozoites each, and lysed at 40 h post-infection. The value for PbFLuc luminescence was set to a value of 1, and the value of PbNLuc luminescence expressed in relation to the PbFLuc value. c Curve of serial dilutions of parasites (1–1000) at 12, 24, 36, 48 and 56 h of development in HepG2 cells. Six sets of 30,000 HepG2 cells were infected with 5000 sporozoites. Parasite numbers were calculated based on mCherry fluorescence, and total parasite load per well calculated. Cells were detached at each indicated time post-infection, and diluted to each indicated values. d Representative IVIS image of luminescence following the kinetics of infection at 12, 24, 36, 48 and 56 h post-infection following infection of HepG2 cells with an initial inoculum of 10,000 sporozoites. e Curve showing kinetics based on fluorescence measurements of total numbers, and sizes of at least 300 parasites at 6, 12, 24, 36, 48 and 56 h post-infection. e, f Represent the fluorescence-based quantification of (d). Parasite sizes (areas, μm2) were calculated based on acquired fluorescence images. f Curve showing kinetics of luminescence alone, corresponding to cells measured in (e) [luminescence measured in photons per second (p/s); ***p < 0.001; error bars in all graphs represent standard deviations (SD)]
Fig. 5
Fig. 5
NanoLuc imaging of P. berghei detached cells allows calculation of merozoite numbers. a Schematic representation of a detached cell. The calculation of merozoite numbers within a detached cell is derived from measurement of the detached cell volume. b Representative bioluminescent image of 64 individual detached cells. c Fluorescence images of 2 types of detached cell accounting for variability in luminescent measurements. The top panel shows a merosome (M) with even distribution of merozoites within the cell body. The bottom panel shows a large detached cell (L-DC) with even distribution of merozoites within the cell body. Scale bar corresponds to 10 μm. d Scatter plot showing significant correlation of detached cell volumes and merozoite numbers (y-axis), with and PbNLuc luminescence (x-axis). 100 individual detached cells symbolizing successful completion of PbNLuc liver infections (represented by each dot) were detected by mCherry-based fluorescence microscopy, imaged, and then individually captured and lysed for luminescence imaging. The radius of the detached cell was measured, and the volume of the detached cell thereby estimated as described in (a) [luminescence measured in photons per second (p/s)]
Fig. 6
Fig. 6
Bioluminescence imaging of P. berghei liver stage egress. a Luminescence values obtained from in vivo imaging of C57BL/6 mice infected with 5000 sporozoites of PbFLuc. Dotted line shows the peak of luminescence after which the first obvious decrease in signal from the mouse liver in vivo after around 48 h occurs. b Egress measured by first appearance of parasites in the periphery. 2 μl of blood were obtained via tail vein puncture and lysed in 20 μl of 1 × PLB for bioluminescence measurement. Luminescence values of peripheral blood from C57BL/6 and Balb/c mice infected with 5000 PbNLuc sporozoites obtained at the indicated time points post-sporozoite injection until 70 h, showing the kinetics of egress as measured by PbNLuc. c Representative luminescence-based assay of egress at the indicated time points in 4 separate C57BL/6 and Balb/c mice. 2 μl of blood were obtained via tail vein puncture and lysed in 20 μl of 1 × PLB for bioluminescence measurement. While egress of PbNLuc is detected earliest at 36 h post-infection, egress of PbFLuc is detected for the first time at 60 h post-infection. d Success of passages of liver-egressed parasites from 36 h onwards into naïve mice. Six C57BL/6 mice were infected with 5000 sporozoites each, and at 36, 40, 42 44, 52, 56 and 60 h post-sporozoite injection, 20 μl of blood removed, diluted in 200 μl of 1 × PBS and the 220 μl intravenously injected into 3 naïve mice. It was later (at 70–90 h post-infection) assessed whether the inoculum had produced an infection in these recipient mice. e Comparative kinetics of egress as measured by luminescence in the blood, in mice infected by intravenous injection of 5000 sporozoites, or by mosquito feeds (5 mosquitoes) [luminescence measured in photons per second (p/s); ***p < 0.001; error bars in all graphs represent standard deviations (SD)]
Fig. 7
Fig. 7
Bioluminescence imaging of P. berghei blood stages. a Luminescence values from various concentrations of iRBCs from PbNLuc- and PbFluc-infected mice, ranging from 1 to 10,000 iRBCs (values shown in logarithmic scale). b Ratio of luminescence of PbNLuc iRBCs compared to PbFLuc iRBCs showing a 150-fold higher signal. 1000 parasites were isolated from a drop of blood of synchronously infected mice at 18 h post-infection. The value for PbFLuc luminescence was set to a value of 1, and the value of PbNLuc luminescence expressed in relation to the PbFLuc value. c, d Parasitaemia curve as measured by bioluminescence, in Balb/c and C57BL/6 mice. 9 Balb/c and C57BL/6 mice were infected with 105 parasites, and their parasitaemia followed daily. At every time post-infection, 20μl of blood were taken by tail vein puncture, and luminescence was assessed; c shows representative images of 5 mice followed in (d). e Correlation between parasitaemia and luminescence at various times post-infection and various parasite burdens. Following injection of 105 parasites into mice, 25 μl of blood were obtained by tail vein puncture for measurement either by luminescence (x-axis) or Giemsa stain of thin blood smears from which parasitaemia was quantified using a light microscope (y-axis). f Bioluminescence signal from PbNLuc synchronous infections. 106 schizonts were injected into C57BL/6 mice, and 20 μl of blood collected bi-hourly from 9 to 27 h post-infection, showing sequestration from 18 to 25 h post-infection. g Bioluminescence signal from blood of PbNLuc and PbFLuc co-infected mice, as measured bi-hourly from 9 to 27 h post-synchronous infections, showing marked schizont sequestration of both parasite lines from 18 to 25 h. h Graphical representation of a limiting dilution leading to isolation of single parasites. The graph shows 5.5 % positivity. [***p < 0.001; error bars in all graphs represent standard deviations (SD)]

Similar articles

Cited by

References

    1. WHO . World Malaria Report. Geneva: World Health Organization; 2015.
    1. Waheed AA, Ghanchi NK, Rehman KA, Raza A, Mahmood SF, Beg MA. Vivax malaria and chloroquine resistance: a neglected disease as an emerging threat. Malar J. 2015;14:146. doi: 10.1186/s12936-015-0660-0. - DOI - PMC - PubMed
    1. Tanner M, Greenwood B, Whitty CJ, Ansah EK, Price RN, Dondorp AM, et al. Malaria eradication and elimination: views on how to translate a vision into reality. BMC Med. 2015;13:167. doi: 10.1186/s12916-015-0384-6. - DOI - PMC - PubMed
    1. Craig AG, Grau GE, Janse C, Kazura JW, Milner D, Barnwell JW, et al. The role of animal models for research on severe malaria. PLoS Pathog. 2012;8:e1002401. doi: 10.1371/journal.ppat.1002401. - DOI - PMC - PubMed
    1. Goodman AL, Forbes EK, Williams AR, Douglas AD, de Cassan SC, Bauza K, et al. The utility of Plasmodium berghei as a rodent model for anti-merozoite malaria vaccine assessment. Sci Rep. 2013;3:1706. doi: 10.1038/srep01706. - DOI - PMC - PubMed

Publication types

MeSH terms