

Genotype tunes pancreatic ductal adenocarcinoma tissue tension to induce matricellular fibrosis and tumor progression
- PMID: 27089513
- PMCID: PMC4860133
- DOI: 10.1038/nm.4082
Genotype tunes pancreatic ductal adenocarcinoma tissue tension to induce matricellular fibrosis and tumor progression
Erratum in
-
Author Correction: Genotype tunes pancreatic ductal adenocarcinoma tissue tension to induce matricellular fibrosis and tumor progression.Nat Med. 2024 Mar;30(3):908. doi: 10.1038/s41591-023-02694-w. Nat Med. 2024. PMID: 38017076 No abstract available.
Abstract
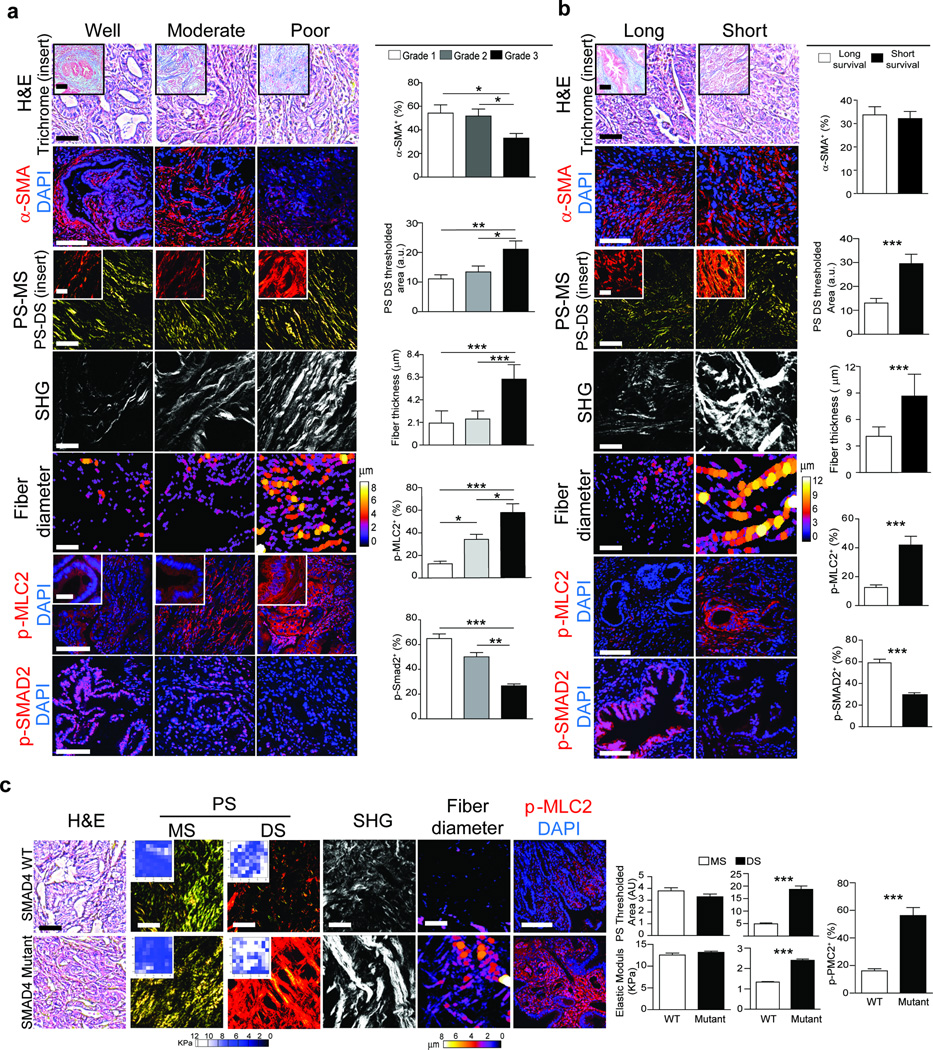
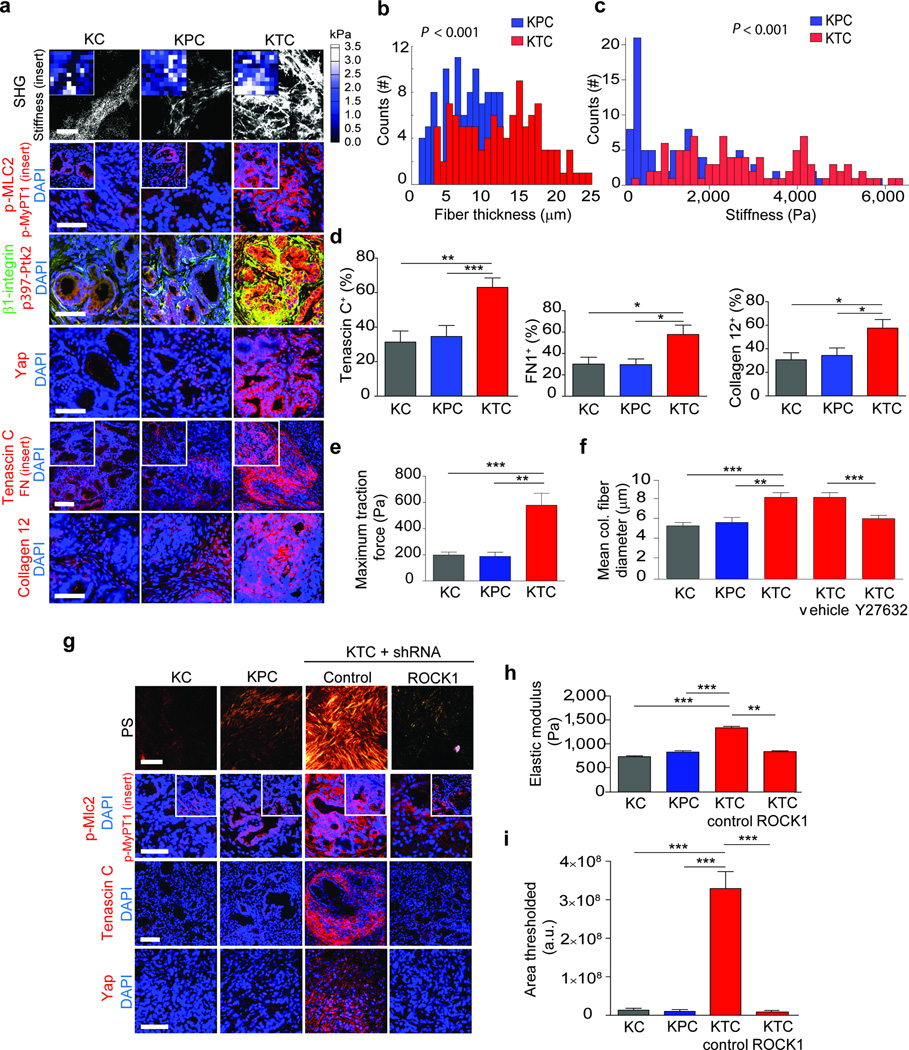
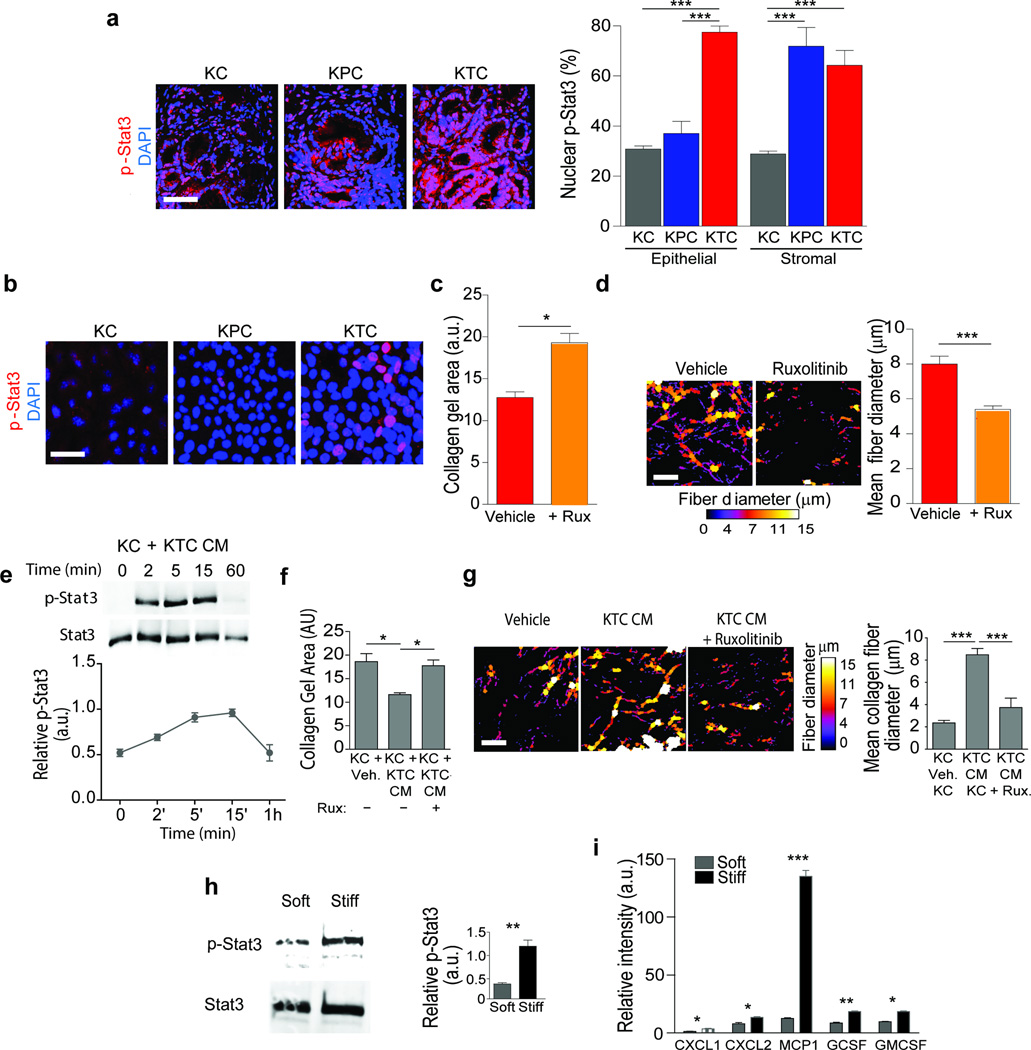
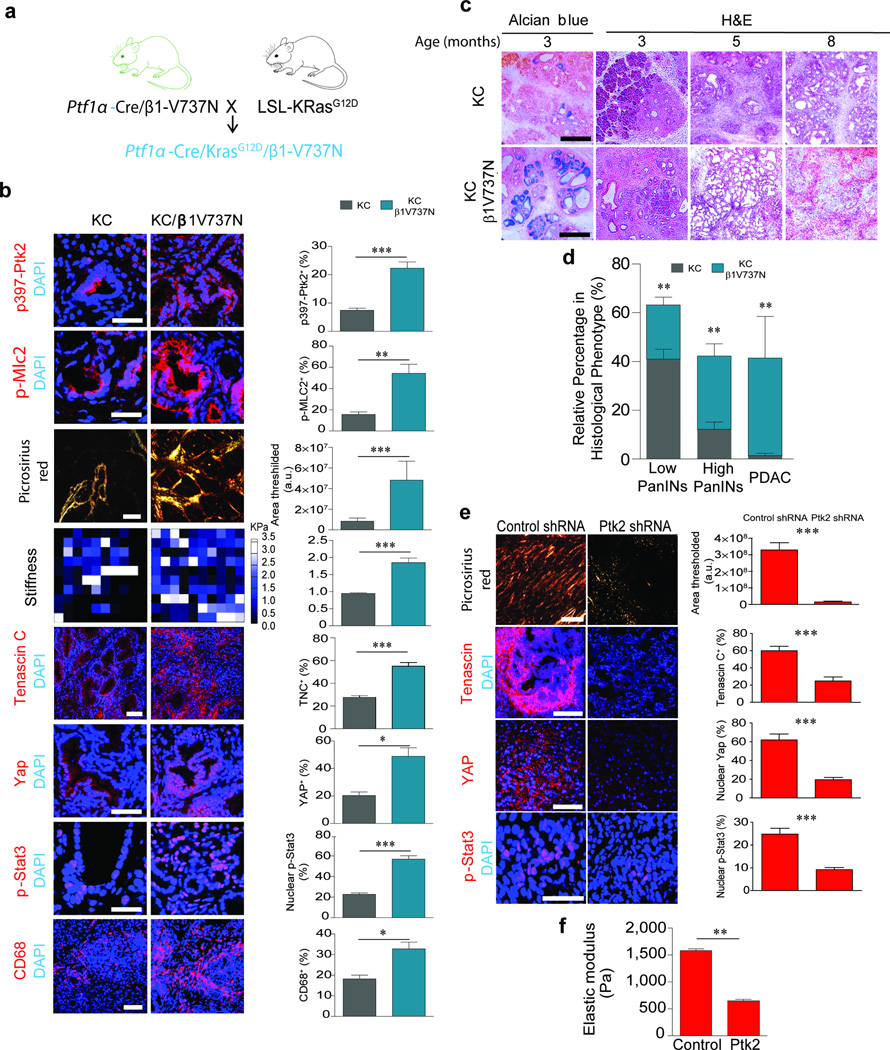
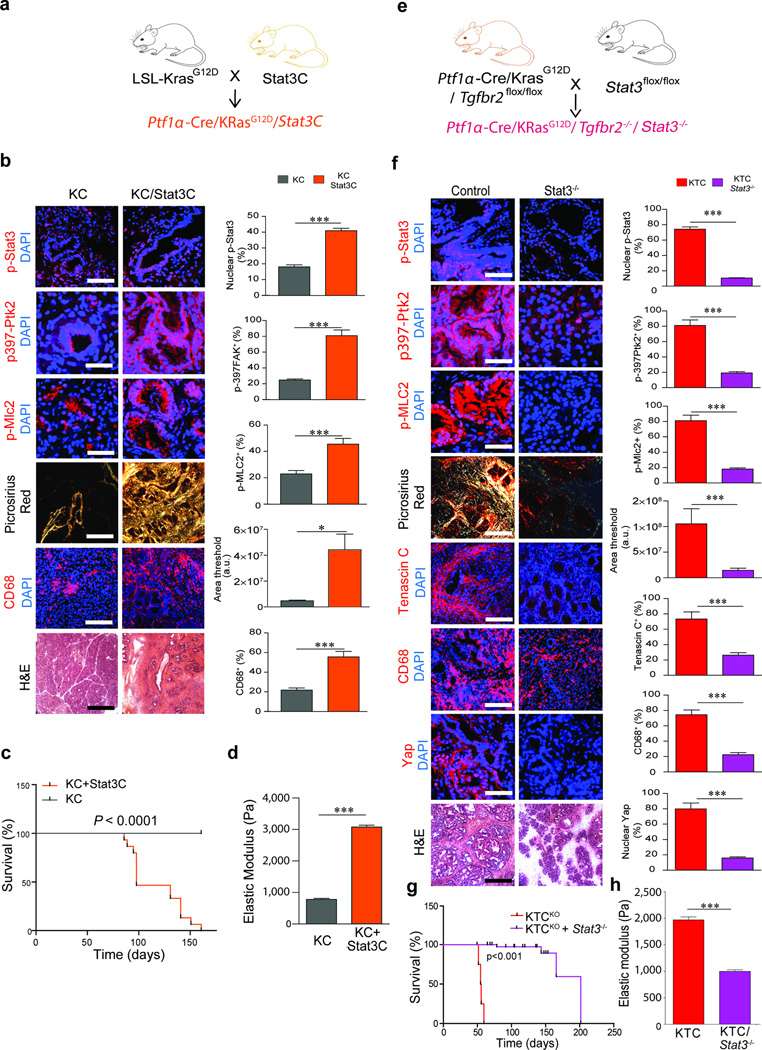
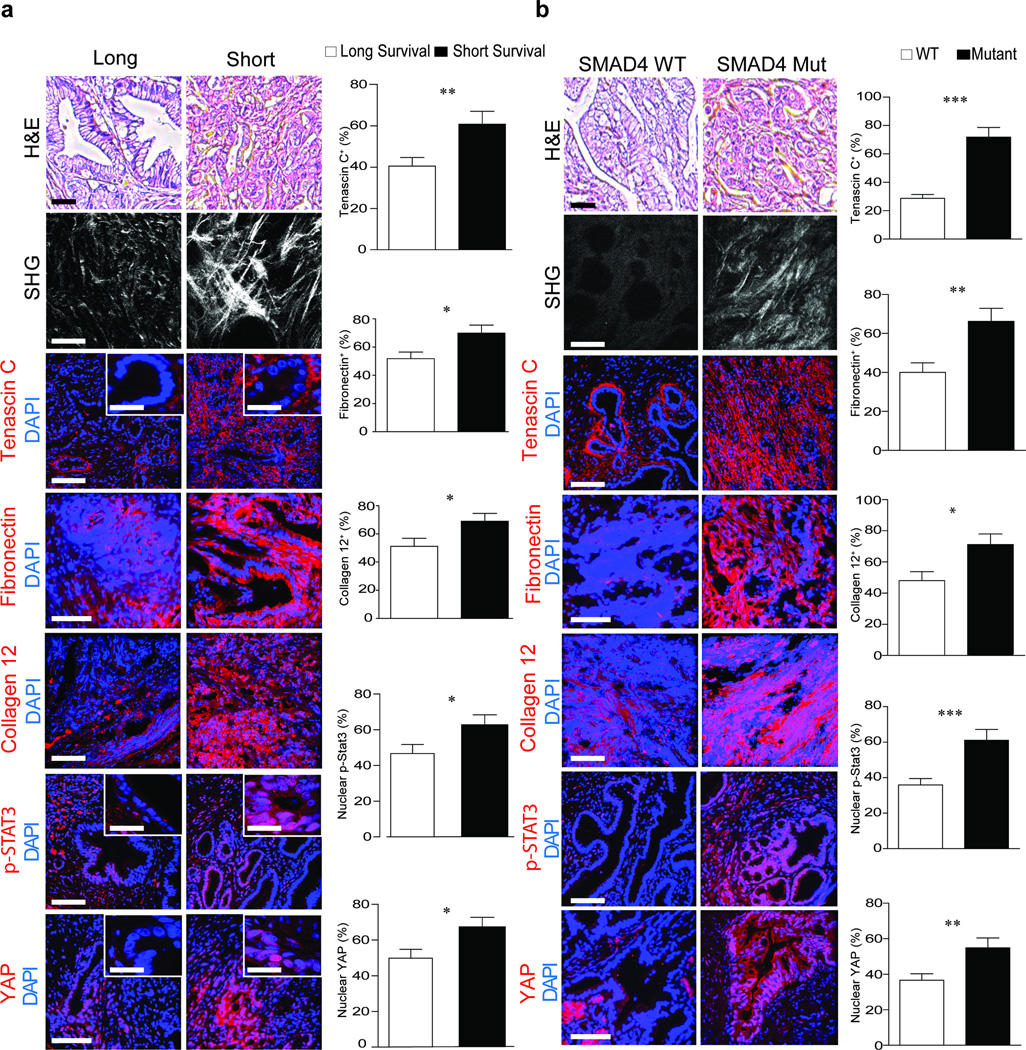
Fibrosis compromises pancreatic ductal carcinoma (PDAC) treatment and contributes to patient mortality, yet antistromal therapies are controversial. We found that human PDACs with impaired epithelial transforming growth factor-β (TGF-β) signaling have high epithelial STAT3 activity and develop stiff, matricellular-enriched fibrosis associated with high epithelial tension and shorter patient survival. In several KRAS-driven mouse models, both the loss of TGF-β signaling and elevated β1-integrin mechanosignaling engaged a positive feedback loop whereby STAT3 signaling promotes tumor progression by increasing matricellular fibrosis and tissue tension. In contrast, epithelial STAT3 ablation attenuated tumor progression by reducing the stromal stiffening and epithelial contractility induced by loss of TGF-β signaling. In PDAC patient biopsies, higher matricellular protein and activated STAT3 were associated with SMAD4 mutation and shorter survival. The findings implicate epithelial tension and matricellular fibrosis in the aggressiveness of SMAD4 mutant pancreatic tumors and highlight STAT3 and mechanics as key drivers of this phenotype.
Figures
Comment in
-
Regulation of pancreatic cancer aggressiveness by stromal stiffening.Nat Med. 2016 May 5;22(5):462-3. doi: 10.1038/nm.4099. Nat Med. 2016. PMID: 27149218 No abstract available.
-
Building up the tension between the epithelial and stromal compartment in pancreatic ductal adenocarcinoma.Cell Death Differ. 2016 Aug;23(8):1265-6. doi: 10.1038/cdd.2016.50. Epub 2016 Jun 10. Cell Death Differ. 2016. PMID: 27285108 Free PMC article. No abstract available.
Similar articles
-
Signal Transducer and Activator of Transcription 3, Mediated Remodeling of the Tumor Microenvironment Results in Enhanced Tumor Drug Delivery in a Mouse Model of Pancreatic Cancer.Gastroenterology. 2015 Dec;149(7):1932-1943.e9. doi: 10.1053/j.gastro.2015.07.058. Epub 2015 Aug 7. Gastroenterology. 2015. PMID: 26255562 Free PMC article.
-
Interleukin 22 Signaling Regulates Acinar Cell Plasticity to Promote Pancreatic Tumor Development in Mice.Gastroenterology. 2020 Apr;158(5):1417-1432.e11. doi: 10.1053/j.gastro.2019.12.010. Epub 2019 Dec 14. Gastroenterology. 2020. PMID: 31843590 Free PMC article.
-
TGIF1 functions as a tumor suppressor in pancreatic ductal adenocarcinoma.EMBO J. 2019 Jul 1;38(13):e101067. doi: 10.15252/embj.2018101067. Epub 2019 May 31. EMBO J. 2019. PMID: 31268604 Free PMC article.
-
The Roles of Frequently Mutated Genes of Pancreatic Cancer in Regulation of Tumor Microenvironment.Technol Cancer Res Treat. 2020 Jan-Dec;19:1533033820920969. doi: 10.1177/1533033820920969. Technol Cancer Res Treat. 2020. PMID: 32372692 Free PMC article. Review.
-
Localisation of PGK1 determines metabolic phenotype to balance metastasis and proliferation in patients with SMAD4-negative pancreatic cancer.Gut. 2020 May;69(5):888-900. doi: 10.1136/gutjnl-2018-317163. Epub 2019 Oct 14. Gut. 2020. PMID: 31611300 Review.
Cited by
-
Single-cell analysis of pancreatic ductal adenocarcinoma identifies a novel fibroblast subtype associated with poor prognosis but better immunotherapy response.Cell Discov. 2021 May 25;7(1):36. doi: 10.1038/s41421-021-00271-4. Cell Discov. 2021. PMID: 34035226 Free PMC article.
-
Liver epithelial focal adhesion kinase modulates fibrogenesis and hedgehog signaling.JCI Insight. 2020 Oct 15;5(20):e141217. doi: 10.1172/jci.insight.141217. JCI Insight. 2020. PMID: 32910808 Free PMC article.
-
Targeting FAK in anticancer combination therapies.Nat Rev Cancer. 2021 May;21(5):313-324. doi: 10.1038/s41568-021-00340-6. Epub 2021 Mar 17. Nat Rev Cancer. 2021. PMID: 33731845 Free PMC article. Review.
-
Focal adhesion kinase inhibition synergizes with nab-paclitaxel to target pancreatic ductal adenocarcinoma.J Exp Clin Cancer Res. 2021 Mar 9;40(1):91. doi: 10.1186/s13046-021-01892-z. J Exp Clin Cancer Res. 2021. PMID: 33750427 Free PMC article.
-
Quantifying in vivo collagen reorganization during immunotherapy in murine melanoma with second harmonic generation imaging.Biophotonics Discov. 2024 May;1(1):015004. doi: 10.1117/1.bios.1.1.015004. Epub 2024 May 20. Biophotonics Discov. 2024. PMID: 39011049 Free PMC article.
References
-
- Swartz MA, Lund AW. Lymphatic and interstitial flow in the tumour microenvironment: linking mechanobiology with immunity. Nature Reviews Cancer. 2012;12:210–219. - PubMed
-
- Yu M, Tannock IF. Targeting Tumor Architecture to Favor Drug Penetration: A New Weapon to Combat Chemoresistance in Pancreatic Cancer? Cancer Cell. 2012;21:327–329. - PubMed
MeSH terms
Substances
Grants and funding
- U01 CA151925/CA/NCI NIH HHS/United States
- U54 CA143836/CA/NCI NIH HHS/United States
- TL1 TR001081/TR/NCATS NIH HHS/United States
- R01 CA138818/CA/NCI NIH HHS/United States
- R01 CA180769/CA/NCI NIH HHS/United States
- R01 CA172045/CA/NCI NIH HHS/United States
- T32 CA108462/CA/NCI NIH HHS/United States
- UL1 TR001082/TR/NCATS NIH HHS/United States
- R01 CA178015/CA/NCI NIH HHS/United States
- R01 CA192914/CA/NCI NIH HHS/United States
- F31 CA180422/CA/NCI NIH HHS/United States
- R33 CA183685/CA/NCI NIH HHS/United States
- R01 CA102310/CA/NCI NIH HHS/United States
- U01 CA202241/CA/NCI NIH HHS/United States
LinkOut - more resources
Full Text Sources
Other Literature Sources
Medical
Molecular Biology Databases
Miscellaneous
