. 2016 Apr 13:7:11266.
doi: 10.1038/ncomms11266.

The cell adhesion molecule Fasciclin2 regulates brush border length and organization in Drosophila renal tubules

Affiliations

The cell adhesion molecule Fasciclin2 regulates brush border length and organization in Drosophila renal tubules

Kenneth A Halberg et al. Nat Commun. .

Abstract

Multicellular organisms rely on cell adhesion molecules to coordinate cell-cell interactions, and to provide navigational cues during tissue formation. In Drosophila, Fasciclin 2 (Fas2) has been intensively studied due to its role in nervous system development and maintenance; yet, Fas2 is most abundantly expressed in the adult renal (Malpighian) tubule rather than in neuronal tissues. The role Fas2 serves in this epithelium is unknown. Here we show that Fas2 is essential to brush border maintenance in renal tubules of Drosophila. Fas2 is dynamically expressed during tubule morphogenesis, localizing to the brush border whenever the tissue is transport competent. Genetic manipulations of Fas2 expression levels impact on both microvilli length and organization, which in turn dramatically affect stimulated rates of fluid secretion by the tissue. Consequently, we demonstrate a radically different role for this well-known cell adhesion molecule, and propose that Fas2-mediated intermicrovillar homophilic adhesion complexes help stabilize the brush border.


Figures

Figure 1
Figure 1. Transcriptomic profiling of Fas2 expression.
(a) Mean normalized Affymetrix signal±s.e.m. (N=4 tissue samples) showing the Fas2 spatial expression pattern across major tissues from both larval and adult Drosophila (flyatlas.org). (b) Overview of Drosophila anatomy with superimposed heat maps of the spatial expression pattern of Fas2. (c) Microarray and qPCR analyses of the dominant Fas2 isoforms across different tissues. The Affymetrix whole fly signal (dark grey bars) was set to an a.u. of 1, with head and tubule signals being expressed as a ratio to whole fly. The mean±s.d. qPCR expression ratios (light grey bars) largely reiterate the microarray data, albeit show much higher Fas2-RB transcript enrichment in MTs compared with the Affymetrix signal. *Significantly different (one-way ANOVA, P<0.05) compared with whole fly. (d) RNA-Seq data comparing Fas2 transcript levels across different tissues. The combined transcriptomic meta-analysis reveal that Fas2-RA, RB and RC are the main isoforms expressed in Drosophila, with isoform Fas2-RB being the dominant splice variant expressed in the MTs.
Figure 2
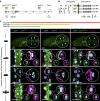
Figure 2. Fas2 is dynamically expressed during tubule development.
(a) Fas2 genomic region illustrating the positions of the GFPCB03613, GFP397 and GFP778 exon trap insertions. (b) Fas2 is expressed in multiple isoforms that all comprise five immunoglobulin (Ig) and two fibronectin type III (FNIII) domains, yet have distinct C-termini. Arrows indicate splice variants recognized by each exon trap insertion line. The differences between transcripts Fas2-RA, -RB and -RC are highlighted in a,b using the same colour code. PEST, PEST domain; SP, signal peptide. (c) In stage 16 embryos, Fas2 localizes to cell junctions of the developing MTs; however, Fas2 switches abruptly to the apical brush border prior to eclosion of the first instar larva, where it remains throughout larval development. As the third instar larva pupates, the MTs become transport incompetent, the microvilli shorten, tubule lumen is reduced and Fas2 is no longer expressed. As the brush border reform in the adult tubule, Fas2 is again abundantly expressed in the MT, where it localizes to the apical brush border (area between arrows). This expression pattern is consistently reported by each fusion protein, and is commensurate with the transcription profile of each Fas2 isoform. Inserts: single optical section of the selected region shown as separate (small circle) and merged (large circle) signals. Scale bars, 25 μm.
Figure 3
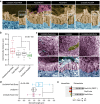
Figure 3. Genetic manipulation of Fas2 impacts microvilli length.
(a) Super-resolution confocal microscopy (Airyscan) on MT from Fas2–GFP778 stained with anti-GFP, suggests that Fas2 localizes to the brush border, where it appears concentrated distally. Zoom: single optical section of the indicated region shown as separate and merged signals. Arrows indicate base (solid) and tip (line) orientations of the brush border. PC, principal cell; SC, stellate cell. Scale bar, 25 μm. (b) Mean normalized fluorescent intensity profiles for F-actin and Fas2 signals from N=12 brush border regions confirm that Fas2 is concentrated at the distal tip of the F-actin-based protrusions. (c) Magnification of the white square in ‘a zoom', and a perpendicular view (‘90°') on the brush border, suggests that Fas2 does not strictly colocalize with intracellular F-actin (phalloidin), but is positioned extracellularly between individual microvilli. Scale bar, 0.5 μm. (d) Inverse coloured optical sections of Alexa-488-phalloidin (black) stained MTs from Fas2 knockdown flies (Fas2-RNAi and Fas2EB112) showed a marked decrease in length and density of the microvillar brush border compared with WT (Canton S) tubules. Conversely, overexpression of Fas2 (Fas2-EP) produced notably longer and denser microvilli. Scale bars, 15 μm. (e) Scanning electron microscopy (SEM) analysis of MT cross-sections (brush border pseudo-coloured in cyan) from adult Drosophila using the principal cell-specific UroGAL4 driver to drive both RNAi and overexpressor constructs confirmed these results. Individual microvilli were measured (see inserts) from (N=10–13) cross-sections with (N=400–520) microvilli measured in total for each Fas2 genetic background. Scale bars, 20 μm. (f,g) Tukey box and whisker plots of microvilli length from the different Fas2 genetic backgrounds. Genetic manipulations of Fas2 expression levels significantly reduced or increased (*, one-way ANOVA, P<0.05) microvilli length compared with parentals or WT. Solid squares indicate mean values; open circles symbolize data outliers.
Figure 4
Figure 4. Genetic manipulation of Fas2 impacts microvilli organization.
(a) Scanning electron microscopy (SEM) analysis of microvillar organization. Microvilli (pseudo-coloured light brown) from parentals (Fas2-RNAi/+ and Fas2-EP/+) show distinct well-organized bundles of microvilli, whereas in Fas2 knockdown flies (UroGAL4>Fas2-RNAi) the microvilli tend to appear as single distinct protrusions. Overexpressing Fas2 makes the bundles more obvious, and the microvilli often appearing more densely packed (UroGAL4>Fas2-EP). Inter-microvilli distances were measured (see inserts) from (N=6–10) cross-sections with (N=90–150) microvilli measured in total for each Fas2 genetic background. Scale bars, 1 μm. (b) Tukey box and whisker plot of intermicrovillar distances from the different fas2 genetic backgrounds. Genetic manipulations of Fas2 expression levels significantly change (*, one-way ANOVA, P<0.05) the average distance between the individual microvillar protrusions compared with parental controls. Intermicrovillar distance was measured (see inserts) from (N=6–10) cross-sections with (N=90–150) distances measured in total for each Fas2 genetic background. Solid squares indicate mean values; open circles symbolize data outliers. (c) Independent overexpression of the Fas2 extracellular domain (Fas2-Extra–YFP) results in a phenotype comparable to overexpressing the full-length transcript (although areas of the brush border showed an excess of adhesion-activity compared with parental controls), whereas overexpression of the Fas2 intracellular domain (Fas2-Intra–YFP) results in microvilli being indistinguishable from controls. Top tier images represent face-on views, whereas bottom tier images are cross-sectional views of the brush border from the various genetic backgrounds. SC, stellate cell (yellow). Scale bars, 5 μm and 1 μm, respectively. (d) Tukey box and whisker plot of microvilli length from the selective overexpression of the Fas2 extracellular and intracellular domains, respectively. Overexpression of the extracellular domain significantly changes (*, one-way ANOVA, P<0.05) the average microvillar length compared with overexpression of the intracellular domain and parental controls. Individual microvilli were measured from (N=5–10) cross-sections with (N=90–520) microvilli measured in total for each Fas2 genetic background. Solid squares indicate mean values; open circles symbolize data outliers. (e) Schematic diagram of native full-length Fas2-RA (PEST-) and the YFP-tagged Fas2-Intra and Fas2-Extra constructs (adapted from ref. 7).
Figure 5
Figure 5. Genetic manipulation of Fas2 impacts renal function.
(a) Knock down (red) of Fas2 results in a significant reduction, while (b) overexpression (green) of Fas2 causes a significant increase, in cAMP-stimulated rates of fluid secretion compared with parental controls (*, one-way ANOVA, P<0.05). (c) Overexpression of only the Fas2 intracellular domain (magenta) has no significant effect on the cAMP-induced secretion rates (NS, one-way ANOVA, P<0.05), while (d) overexpression of the extracellular domain alone (blue) significantly increased (*, one-way ANOVA, P<0.05) stimulated fluid secretion rates compared with parental lines. Arrows indicate point of cAMP (10−4 M) addition. Data are expressed as mean±s.e.m. of N=6–7.
Figure 6
Figure 6. Hypothesis for Fas2 function in the Drosophila MT.
(a) Schematic representation of the spatio-temporal expression pattern of Fas2 (green) during tubule development. Fas2 does not localize to the microvilli when the tubules are transport incompetent, but are abruptly recruited to the microvillar brush border when the tissue develops transport competence (blue). (b) Schematic representation of how Fas2 is proposed to provide attractive forces through homophilic adhesion on the axon relative to the environment that promotes axon fasciculation and growth cone guidance (based on ref. 11). (c) Proposed model for Fas2 function in the adult Drosophila MT. By contrast to the Drosophila nervous system and neuromuscular junction, where Fas2 mediates intercellular interactions, we hypothesize that Fas2 acts as homotypic bridging protein within the same cell of the renal tubule, where it stabilizes the microvillar brush border against shear stress caused by uniquely high flux rates. Knockdown of Fas2 results in shorter and disorganized microvilli with the opposite being the case when Fas2 is overexpressed.

Similar articles

Cited by

References

    1. Su A. I. et al.. A gene atlas of the mouse and human protein-encoding transcriptomes. Proc. Natl Acad. Sci. USA 101, 6062–6067 (2004). - PMC - PubMed
    1. Chintapalli V. R., Wang J. & Dow J. A. T. Using FlyAtlas to identify better Drosophila models of human disease. Nat. Genet. 39, 715–720 (2007). - PubMed
    1. Sekhon R. S. et al.. Maize gene atlas developed by RNA sequencing and comparative evaluation of transcriptomes based on RNA sequencing and microarrays. PLoS ONE 8, e61005 (2013). - PMC - PubMed
    1. Robinson S. W., Herzyk P., Dow J. A. T. & Leader D. P. FlyAtlas: database of gene expression in the tissues of Drosophila melanogaster. Nucleic Acids Res. 41, D744–D750 (2013). - PMC - PubMed
    1. Grenningloh G., Jay Rehm E. & Goodman C. S. Genetic analysis of growth cone guidance in Drosophila: fasciclin II functions as a neuronal recognition molecule. Cell 67, 45–57 (1991). - PubMed

Publication types

MeSH terms

Substances

LinkOut - more resources