. 2016 Apr 26;113(17):E2363-72.
doi: 10.1073/pnas.1517066113. Epub 2016 Apr 11.

Function and regulation of TRPP2 ion channel revealed by a gain-of-function mutant

Affiliations

Function and regulation of TRPP2 ion channel revealed by a gain-of-function mutant

Mahmud Arif Pavel et al. Proc Natl Acad Sci U S A. .

Abstract

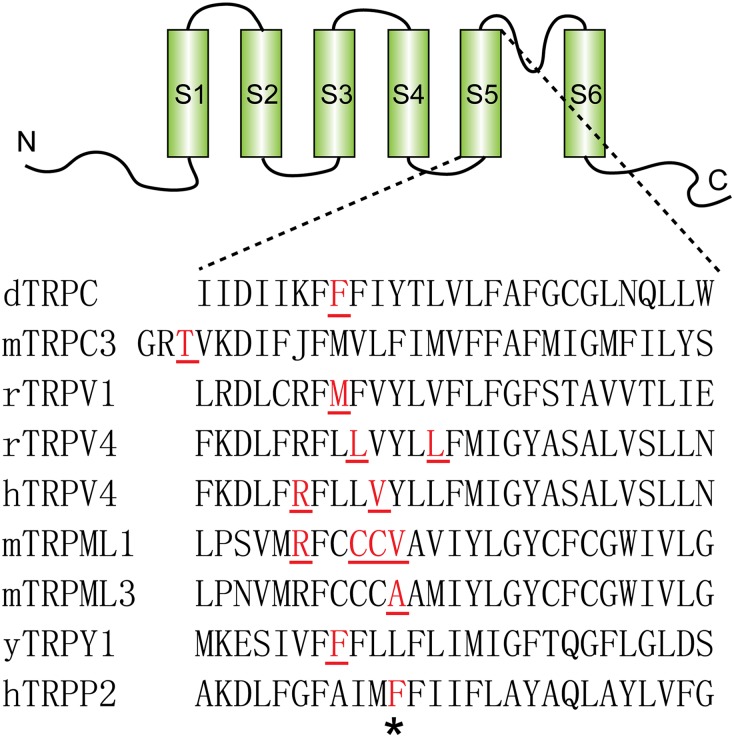
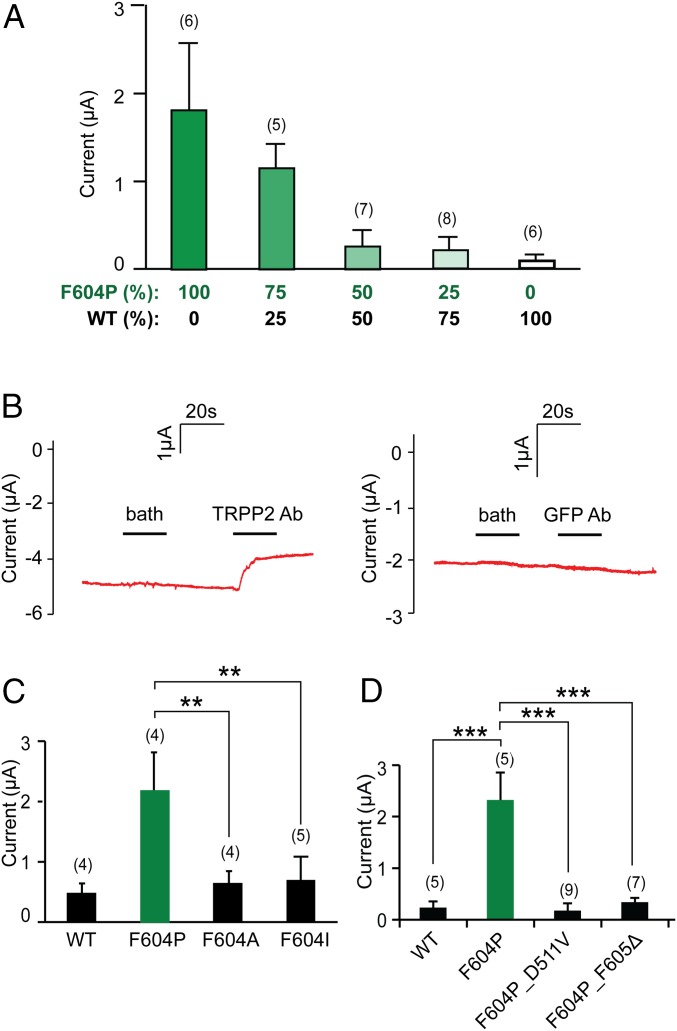
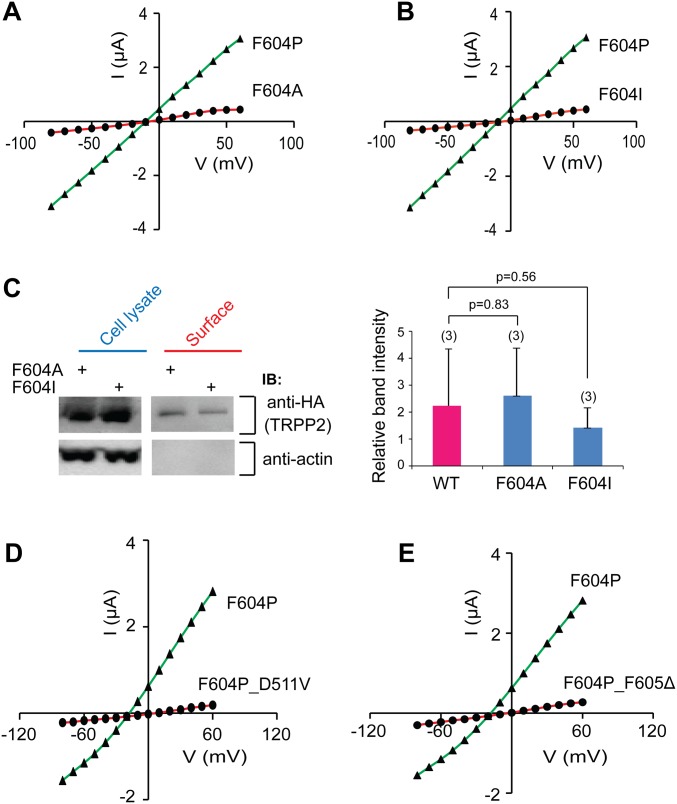
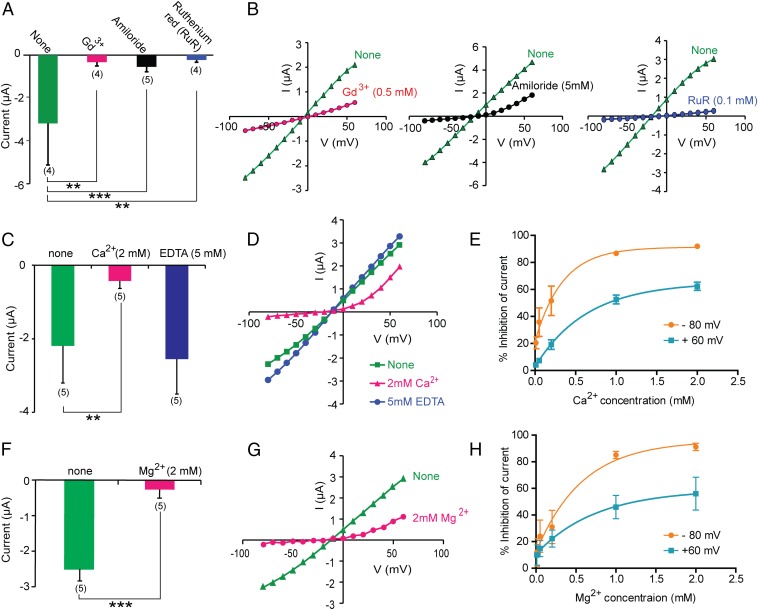
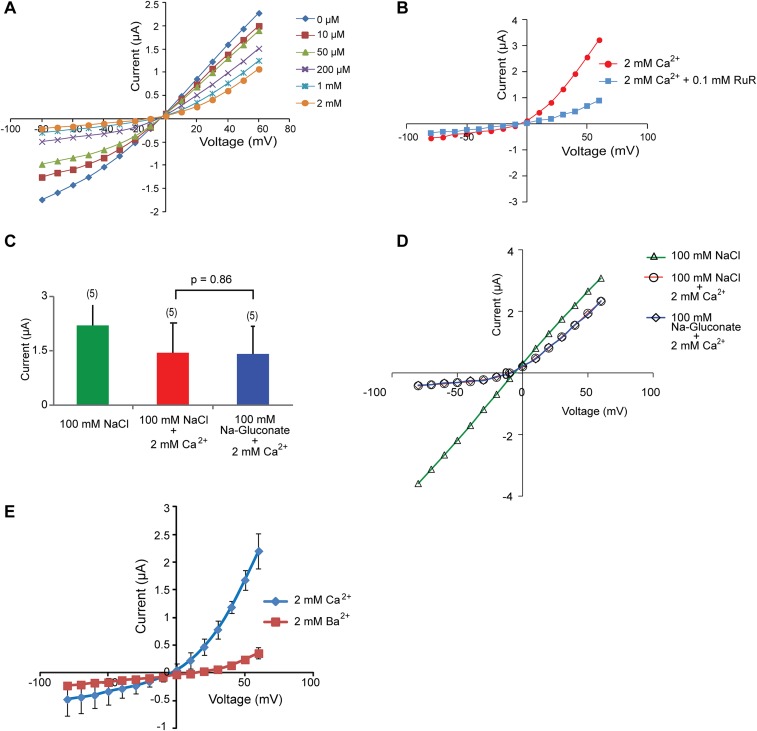
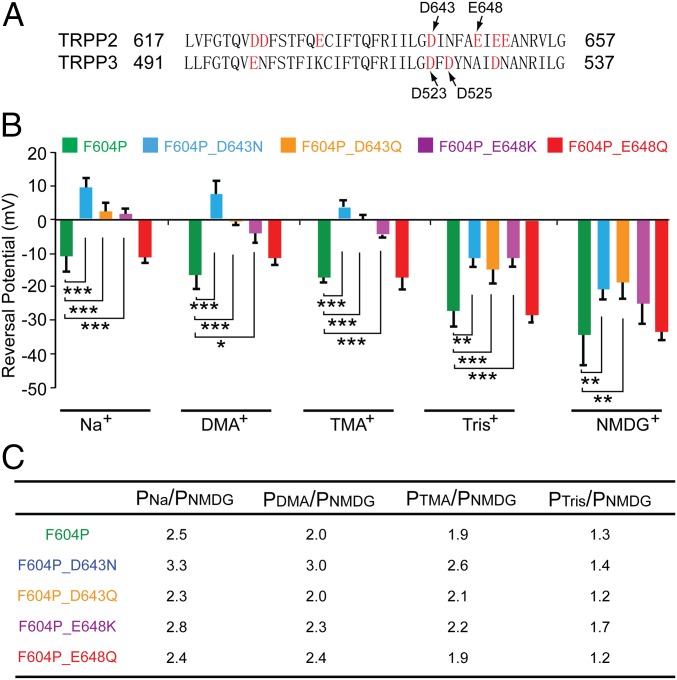
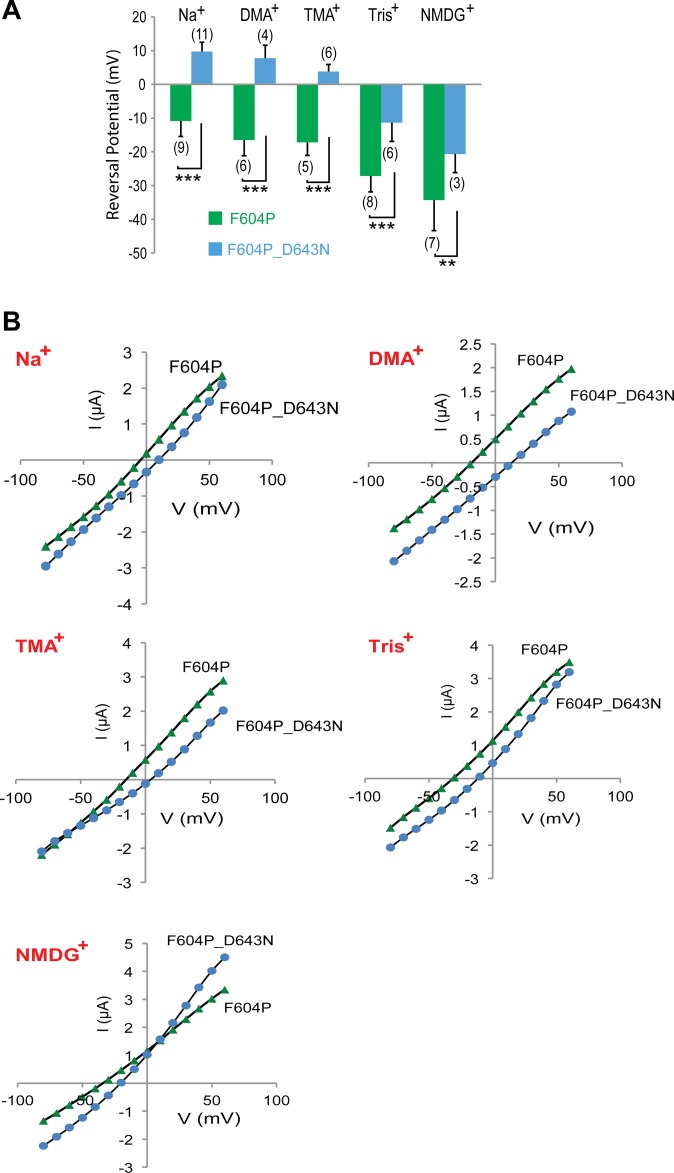
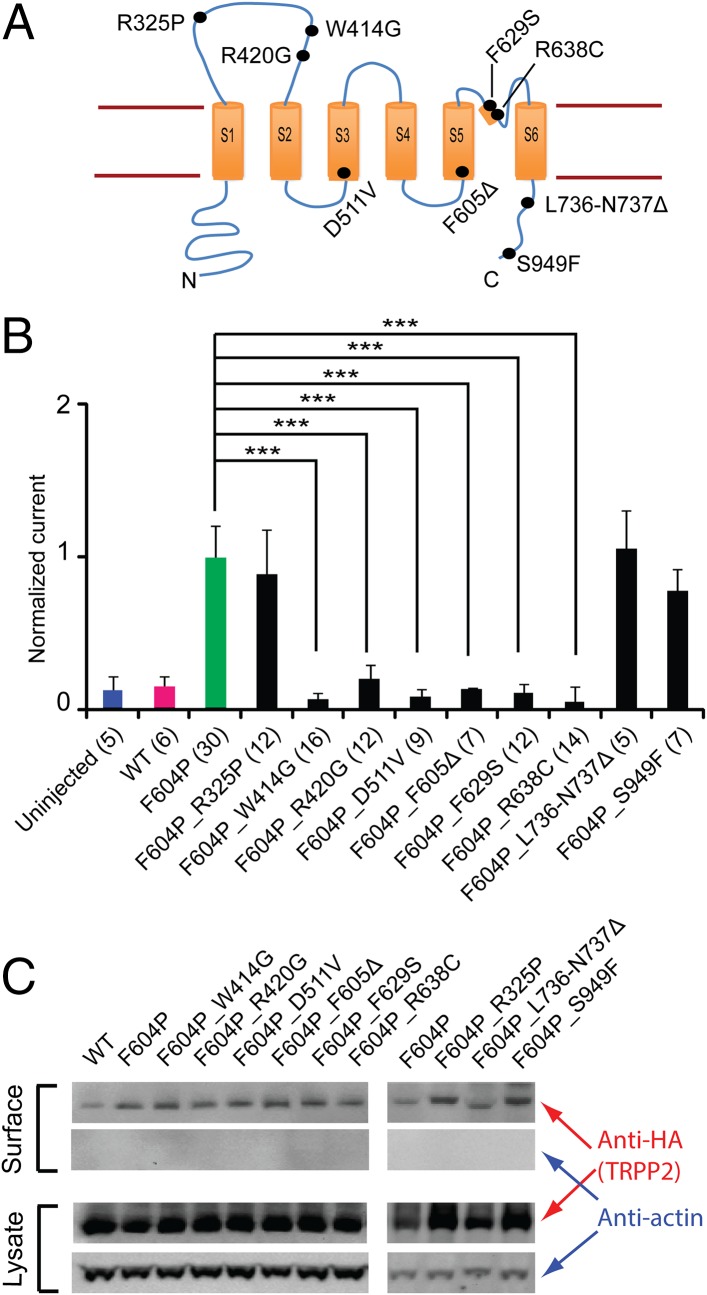
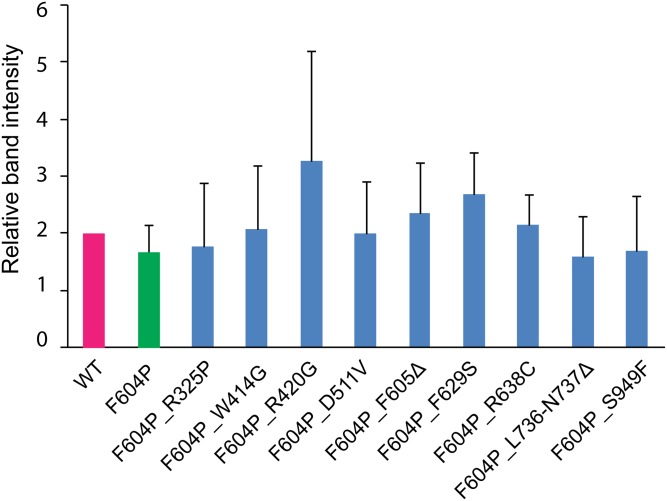
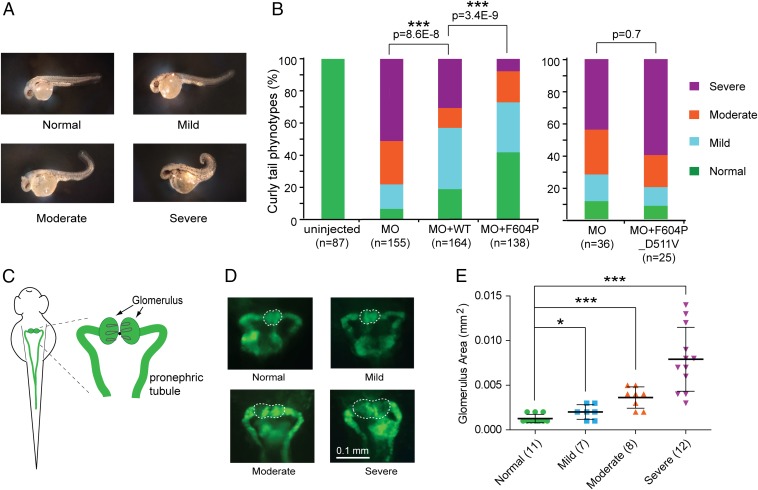
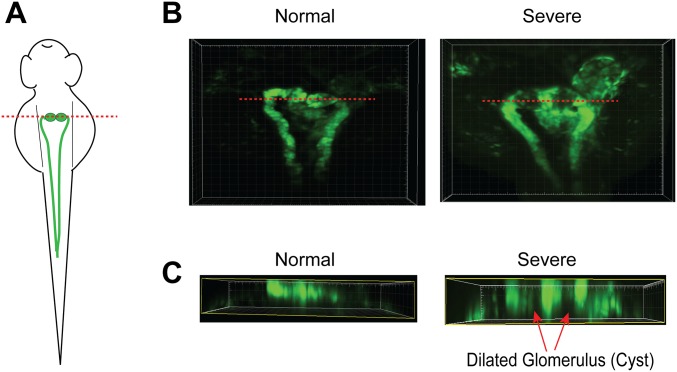
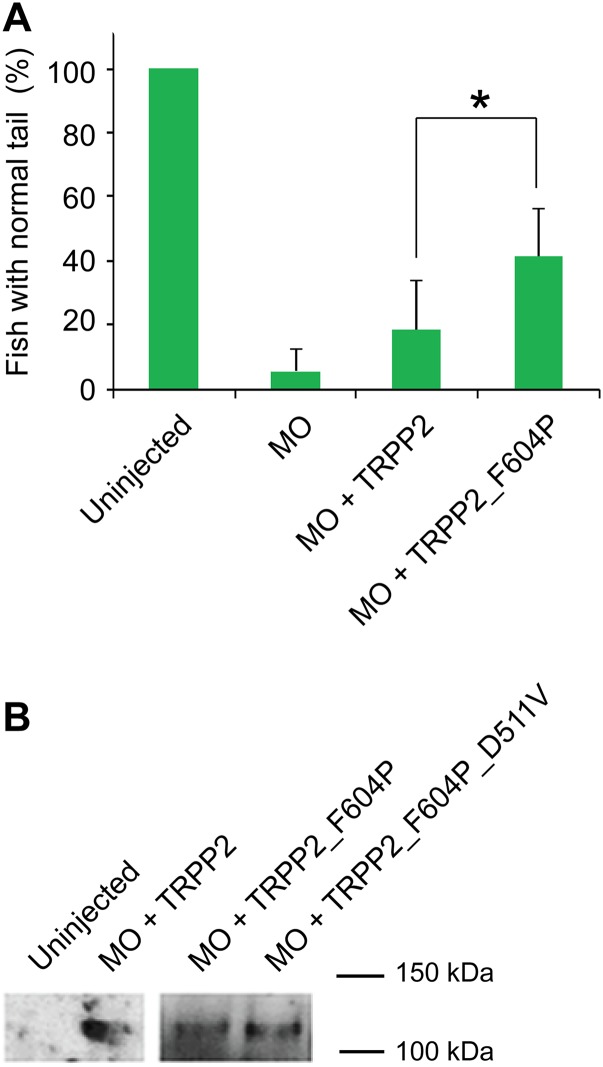
Mutations in polycystin-1 and transient receptor potential polycystin 2 (TRPP2) account for almost all clinically identified cases of autosomal dominant polycystic kidney disease (ADPKD), one of the most common human genetic diseases. TRPP2 functions as a cation channel in its homomeric complex and in the TRPP2/polycystin-1 receptor/ion channel complex. The activation mechanism of TRPP2 is unknown, which significantly limits the study of its function and regulation. Here, we generated a constitutively active gain-of-function (GOF) mutant of TRPP2 by applying a mutagenesis scan on the S4-S5 linker and the S5 transmembrane domain, and studied functional properties of the GOF TRPP2 channel. We found that extracellular divalent ions, including Ca(2+), inhibit the permeation of monovalent ions by directly blocking the TRPP2 channel pore. We also found that D643, a negatively charged amino acid in the pore, is crucial for channel permeability. By introducing single-point ADPKD pathogenic mutations into the GOF TRPP2, we showed that different mutations could have completely different effects on channel activity. The in vivo function of the GOF TRPP2 was investigated in zebrafish embryos. The results indicate that, compared with wild type (WT), GOF TRPP2 more efficiently rescued morphological abnormalities, including curly tail and cyst formation in the pronephric kidney, caused by down-regulation of endogenous TRPP2 expression. Thus, we established a GOF TRPP2 channel that can serve as a powerful tool for studying the function and regulation of TRPP2. The GOF channel may also have potential application for developing new therapeutic strategies for ADPKD.

Keywords: TRP channels; TRPP2; autosomal dominant polycystic kidney disease; gain of function; polycystin.


Conflict of interest statement

The authors declare no conflict of interest.

Figures

Fig. S1.
Fig. S1.
Alignment of the fifth transmembrane segments of different TRP proteins showing the mutations in this region that lead to GOF. Red and underlined amino acids show the GOF mutation sites that were identified in disease or random mutagenesis studies. In addition to the F604P in TRPP2 (indicated with asterisk) that was found in this study, mutations shown in the figure are as follows: F550I in Drosophila TRPC1 channel (fTRPC) (84); T635A in mouse TRPC3 (85); M581T in rat TRPV1 (86); L619P and L623P in rat TRPV4 (87); R616Q and V620I in human TRPV4 (88); R427P, C430P, C431P, and V432P in mouse TRPML1 (36); A419P in mouse TRPML3 (89, 90); and F380L in yeast TRPY1 (91). Adapted from ref. (35), with the TRPP2 sequence added.
Fig. 1.
Fig. 1.
Pro-scanning mutagenesis reveals a GOF mutant of TRPP2. (A) Putative transmembrane topology of TRPP2. The region that was selected for Pro-scanning mutagenesis, including the last part of the S4–S5 linker and the first half of S5, is marked with the black-lined box, and the corresponding amino acid sequence is indicated at the bottom. Amino acids that were substituted to Pro are in red. An arrow points to the amino acid F604. C, carboxyl terminus; N, amino terminus. (B) Bar graph showing inward and outward currents of TRPP2 mutants when expressed in Xenopus oocytes. Currents at −80 mV and +60 mV are shown. Recording was done in a standard divalent ion-free bath solution [100 mM NaCl, 2 mM Hepes-NaOH (pH 7.5)]. Numbers of tested oocytes are indicated in parentheses in this and the following figures. All data are shown as mean and SD, and significant difference was tested with Student's t test. ***P < 0.001. (C) Representative I-V curves of WT TRPP2 and F604P mutant. (D) Representative I-V curves of TRPP2_F604P when 100 mM of indicated ions was used in the divalent ion-free bath solution for recording. (E) TRPP2 and TRPP2_F604P have similar plasma membrane expression in Xenopus oocytes. (Left) Representative Western blot image. IB, immunoblot. Actin was blotted to show that only surface proteins were pulled down, and it also serves as a loading control. The asterisk and star indicate the positions of the expected protein bands of TRPP2 and actin, respectively. (Right) Bar graph shows relative intensity of Western blot bands of surface TRPP2 and TRPP_F604P proteins. Data come from five independent experiments, and no significant difference is found. Surface proteins were biotinylated and pulled down with streptavidin-coated beads.
Fig. 2.
Fig. 2.
Evidence showing that the current recorded from TRPP2_F604P RNA-injected oocytes is conducted by the TRPP2_F604P channel. (A) Bar graph showing the dominant negative effect of WT TRPP2 on TRPP2_F604P current when both RNAs were coinjected in Xenopus oocytes. The relative amounts of the two RNAs injected are indicated at the bottom. Average currents at +60 mV are shown in this graph, and in C and D. (B) Applying a mouse anti-TRPP2 Ab that recognizes the extracellular loop of TRPP2 partially inhibited TRPP2_F604P current (Left), whereas applying a mouse anti-GFP Ab did not (Right). Ooctyes were clamped at −60 mV. (C) Bar graph showing the lack of GOF effect produced by F604A and F604I. Representative I-V curves and proteins’ surface expression are shown in Fig. S2. (D) Bar graph showing that two disease-causing mutations abolish TRPP2_F604P current. Representative I-V curves are shown in Fig. S2. Proteins’ surface expression is shown, together with other disease-causing mutations, in Fig. 5C. **P < 0.01; ***P < 0.001.
Fig. S2.
Fig. S2.
Mutations F604A and F604I do not cause the GOF effect of TRPP2, and two ADPKD pathogenic mutations, D511V and F605∆, abolish TRPP2_F604P current. (A, B, D, and E) Representative I-V curves of indicated mutants of TRPP2 in divalent-free bath solution. (C) Western blot (Left, representative image; Right, statistical analysis of surface proteins in three independent experiments) showing the normal surface expression of TRPP2_F604A and TRPP_F604I in Xenopus oocytes. IB, immunoblot.
Fig. 3.
Fig. 3.
TRPP2_F604P current is inhibited by common cation channel blockers and divalent ions. (A) Bar graph showing that the TRPP2_F604P current was inhibited by adding Gd3+ (0.5 mM), amiloride (5 mM), or RuR (0.1 mM) into standard divalent ion-free bath solution. Average currents at −80 mV are shown. (B) Corresponding representative I-V curves for the data in A. (C and F) Bar graphs show the inhibition of TRPP2_F604P inward current by extracellular 2 mM Ca2+ (C) or 2 mM Mg2+ (F), and the effect of 5 mM EDTA (C). (D and G) Representative I-V curves of TRPP2_F604P in divalent ion-free bath solution (labeled as “None”) and solutions with 2 mM Ca2+ (D), 5 mM EDTA (D), or 2 mM Mg2+ (G) added are shown. (E and H) Concentration-dependent inhibition of inward (at −80 mV, orange traces) and outward (at +60 mV, blue traces) currents of the TRPP2_F604P by extracellular Ca2+ (E) and Mg2+ (H). Best-fit exponential curves are shown (n = 5 in both cases). Representative I-V curves under different concentration of Ca2+ are shown in Fig. S3A. **P < 0.01; ***P < 0.001.
Fig. S3.
Fig. S3.
Blocking of the TRPP2_F604P current. (A) Representative I-V curves of TRPP2_F604P when the indicated concentration of Ca2+ exists in bath solution. (B) Representative I-V curves showing the inhibition of 0.1 mM RuR on TRPP2_F604P current in the presence of 2 mM Ca2+. (C and D) The current size of TRPP2_F604P did not change when NaCl in bath solution was replaced by Na-gluconate in the presence of 2 mM Ca2+, as seen in the bar graph (C) and representative I-V curves (D). Bath solutions contain 2 mM Hepes-NaOH (pH 7.5) and indicated salts. The bar graph in C shows the outward current of TRPP2_F604P at +60 mV. (E) Comparison of the I-V curves of TRPP2_F604P in the presence of 2 mM Ca2+ and 2 mM Ba2+ showing the stronger blocking effect of Ba2+, especially on the outward current.
Fig. S4.
Fig. S4.
Effect of pH on TRPP2_F604P current. (A) I-V curves of TRPP2_F604P showing that pH has no significant effect on Ca2+ blocking. Curves are shown as the average of data from five oocytes (Left) and a representative oocyte (Right). Currents were recorded in the bath solution containing 100 mM NaCl, 2 mM CaCl2, and 2 mM Hepes. The pH was adjusted with NaOH or HCl. (B) I-V curves showing that low pH inhibits the current of TRPP2_F604P in the absence of Ca2+. Curves are shown as the average of data from five oocytes (Left) and a representative oocyte (Right). Currents were recorded in the bath solution containing 100 mM NaCl and 2 mM Hepes. The pH was adjusted to 4 with HCl.
Fig. 4.
Fig. 4.
D643 is critical for the ion selectivity of the TRPP2 channel. (A) Sequence alignment of the putative pore regions of human TRPP2 and TRPP3. Arrows indicate the two amino acids that are crucial for ion selectivity of the TRPP3/PKD1L3 channel (Bottom) and the two amino acids of TRPP2 that were mutated in this study (Top). (B) Bar graph showing the reversal potentials of currents recorded from TRPP2_F604P (green bars), F604P_D643N (blue bars), F604P_D643Q (orange bars), F604P_E648K (purple bars), and F604P_E648Q (red bars) in bath solutions containing 100 mM Na+, DMA+, TMA+, Tris+, or NMDG+. *P < 0.05; **P < 0.01; ***P < 0.001. (C) Relative permeability ratios of indicated ions to NMDG+ in listed TRPP2 mutants. We chose NMDG+ as the reference ion because its permeability has the smallest change among all ions when different mutants were tested. However, it should be noted that because the NMDG+ permeability itself was increased in three of the four mutants, the permeability changes of other ions caused by these mutations are underestimated if one just compares the numbers in the table. More detailed results on the changes of both reversal potential and relative permeability ratios are listed in Table S1.
Fig. S5.
Fig. S5.
D643N changes the ion selectivity of TRPP2_F604P. (A) Bar graphs showing the changes of the reversal potentials caused by introduction of D643N in TRPP2_F604P. Currents were recorded in bath solutions containing 100 mM indicated ions. (B) Representative I-V curves of the TRPP2_F604P and TRPP2_F604P_D643N in the bath solutions containing 100 mM indicated ions.
Fig. 5.
Fig. 5.
Effects of ADPKD pathogenic mutations on GOF TRPP2 channel activity. (A) Topology of TRPP2 with indicated positions (black dots) of nine pathogenic single- or double-point mutations tested in this study. (B) Bar graph showing the effect of the tested pathogenic mutants on TRPP2_F604P current. Currents were recorded in a bath solution containing 100 mM NaCl, 2 mM CaCl2, and 2 mM Hepes-NaOH (pH 7.5). Currents at +60 mV are shown in the bar graph. All currents have been normalized to the average of TRPP2_F604P currents recorded from the same batch of oocytes. Currents of F604P_D511V and F604P_F605Δ are adopted from data in Fig. 2D. ***P < 0.001. (C) Representative Western blot images showing surface expression of the WT TRPP2 channel and channels with indicated mutations. Actin was blotted to show only surface protein detected in the surface protein samples, and serves as a loading control. Statistical analysis on band intensity with data from three independent experiments shows no significant difference in their plasma membrane expression (Fig. S6).
Fig. S6.
Fig. S6.
Tested mutations have no effect on TRPP2 surface expression. Relative intensity of bands on Western blot obtained in three independent experiments was analyzed with ImageJ and normalized to the intensity of the band of WT TRPP2 in the same experiment. No significant difference is found between WT and mutants with Student's t test.
Fig. 6.
Fig. 6.
GOF TRPP2 rescues the dorsal axis curvature (curly tail) phenotype in zebrafish embryos better than WT TRPP2. (A) Representative images of zebrafish embryos showing the range of severity in curly tail used for scoring. Normal: no curvature; mild: <90°; moderate: >90°; severe: tail tip crossing the body axis. (B) Bar graph represents the percentage of embryos with normal, mild, moderate, and severe curvature at 48 hpf. Embryos were injected at the one-cell stage with zebrafish TRPP2 MO or indicated combinations of MO and RNA. Statistical significance is determined by the χ2 test. Data used in the Left bar graph were pooled from five independent experiments, whereas data used in the Right bar graph were pooled from two experiments. (C) Diagram showing fish pronephric kidney at around 48 hpf. (Right) Glomerulus and pronephric tubule are labeled on the zoom-in diagram. (D) Representative fluorescence images showing the area of the glomerulus (circled with dashed lines) of zebrafish embryos with different severity in dorsal axis curvature as shown in A. The transgenic line wt1b:EGFP [Tg(wt1b:eGFP)li1] with pronephros-specific GFP expression was used in this experiment. (E) Scatter plot showing the correlation between glomerulus area and indicated curly tail severity. The glomerulus area was selected as shown with the dashed lines in D, and was measured with ImageJ. The mean and SD are indicated in the plot. *P < 0.05; ***P < 0.001.
Fig. S7.
Fig. S7.
Zebrafish with severe curly tail had a diluted glomerulus (cyst) in the pronephric kidney. (A) Diagram showing zebrafish pronephric kidney at around 48 hpf. The red line indicates the position of the virtual section shown in C. (B) Confocal images of the Tg(wt1b:eGFP)li1 fish embryos with normal and severe curly tail phenotypes. GFP-positive tissues show the glomerulus and pronephric tubule. Dilation (cyst) was clearly observed in the glomerulus of the fish with the severe curly tail phenotype. (C) Virtual sections were made after 3D reconstructions of the GFP expression in the glomerulus shown in B. Red arrows indicate the dilated glomerulus (cyst) in fish with the severe curly tail phenotype.
Fig. S8.
Fig. S8.
Phenotype rescue and TRPP2 expression in zebrafish. (A) Bar graph comparing the percentages of fish with the normal tail phenotype in the groups that were injected with TRPP2 MO only or the combinations of MO and the indicated RNA. A significant difference is seen between the group injected with MO + WT TRPP2 RNA and the group injected with MO + TRPP2_F604P RNA. Data were collected in five independent experiments and analyzed with Student's t test. *P < 0.05. (B) Overall TRPP2 protein expression in whole zebrafish at 48 hpf. RNA of human TRPP2, TRPP2_F604P, or TRPP2_F604P_D511V was injected into zebrafish at the one-cell stage. Mouse monoclonal anti-HA Ab was used to detect HA-tagged human TRPP2 proteins.

Similar articles

Cited by

References

    1. Harris PC, Torres VE. Polycystic kidney disease. Annu Rev Med. 2009;60:321–337. - PMC - PubMed
    1. Wu G, Somlo S. Molecular genetics and mechanism of autosomal dominant polycystic kidney disease. Mol Genet Metab. 2000;69(1):1–15. - PubMed
    1. Semmo M, Köttgen M, Hofherr A. The TRPP subfamily and polycystin-1 proteins. Handbook Exp Pharmacol. 2014;222:675–711. - PubMed
    1. Hughes J, et al. The polycystic kidney disease 1 (PKD1) gene encodes a novel protein with multiple cell recognition domains. Nat Genet. 1995;10(2):151–160. - PubMed
    1. Mochizuki T, et al. PKD2, a gene for polycystic kidney disease that encodes an integral membrane protein. Science. 1996;272(5266):1339–1342. - PubMed

Publication types