. 2016 Apr 12:6:24250.
doi: 10.1038/srep24250.

CALHM1 deficiency impairs cerebral neuron activity and memory flexibility in mice

Affiliations

CALHM1 deficiency impairs cerebral neuron activity and memory flexibility in mice

Valérie Vingtdeux et al. Sci Rep. .

Abstract

CALHM1 is a cell surface calcium channel expressed in cerebral neurons. CALHM1 function in the brain remains unknown, but recent results showed that neuronal CALHM1 controls intracellular calcium signaling and cell excitability, two mechanisms required for synaptic function. Here, we describe the generation of Calhm1 knockout (Calhm1(-/-)) mice and investigate CALHM1 role in neuronal and cognitive functions. Structural analysis revealed that Calhm1(-/-) brains had normal regional and cellular architecture, and showed no evidence of neuronal or synaptic loss, indicating that CALHM1 deficiency does not affect brain development or brain integrity in adulthood. However, Calhm1(-/-) mice showed a severe impairment in memory flexibility, assessed in the Morris water maze, and a significant disruption of long-term potentiation without alteration of long-term depression, measured in ex vivo hippocampal slices. Importantly, in primary neurons and hippocampal slices, CALHM1 activation facilitated the phosphorylation of NMDA and AMPA receptors by protein kinase A. Furthermore, neuronal CALHM1 activation potentiated the effect of glutamate on the expression of c-Fos and C/EBPβ, two immediate-early gene markers of neuronal activity. Thus, CALHM1 controls synaptic activity in cerebral neurons and is required for the flexible processing of memory in mice. These results shed light on CALHM1 physiology in the mammalian brain.


Figures
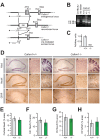
Figure 1
Figure 1. Generation and brain analysis of Calhm1−/− mice.
(A) Schematic representation of the Calhm1 targeting strategy resulting in exon (Ex) 1 deletion. Grey boxes represent Calhm1 coding sequences and solid lines the chromosome sequence. The initiation (ATG) and stop (Stop) codons are indicated. Arrows show primers used for genotyping; neo, neomycin cassette. (B) PCR genotyping of Calhm1−/− mouse lines. PCR was performed on tail genomic DNA of a C57BL/6J mouse control, Calhm1+/+ (+/+), Calhm1+/− (+/−), and Calhm1−/− (−/−) littermates. Arrows point to 4.4-kb and 3.8-kb PCR products corresponding to amplified regions of Calhm1 endogenous locus and recombined locus, respectively (as shown schematically in (A)). (C) Real time PCR analyzing Calhm1 expression levels in whole brains from Calhm1+/+ and Calhm1−/− mice. Calhm1 expression was normalized to the reference genes Hprt1, Tbp, and Polr2a; ND, not detected. (D) Nissl (panels a–f), NeuN (g–l), and GFAP (m–r) staining of sagittal brain sections of a group of old Calhm1+/+ (a–c,g–i,m–o) and Calhm1−/− (d–f,j–l,p–r) littermates. Hippocampal formation (panels a,d,g,j,m,p), cerebral cortex (b,e,h,k,n,q), and cerebellum (c,f,i,l,o,r) are shown. (E–H) Percent area occupied with positive staining for cortical (E) CA1 (F) and cerebellar (G) NeuN expression, and hippocampal (HP) GFAP (H) expression, analyzed by immunohistochemistry as in D (n = 3).
Figure 2
Figure 2. Brain analysis of Calhm1−/− mice.
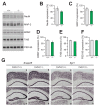
(A) WB analysis of the levels of the indicated proteins in the whole brain from a group of young-adult Calhm1+/+ and Calhm1−/− littermates. (B–F) Densitometric analysis and quantification of the expression levels of the indicated neuronal makers, analyzed by WB as in (A) (n = 3). (G) In situ hybridization of Snap25 (panels a–d) and Syt1 (e–h) in the cerebral cortex (a,b,e,f) and hippocampus (c,d,g,h) of young-adult Calhm1+/+ and Calhm1−/− mice.
Figure 3
Figure 3. Behavioral assessment of Calhm1−/− mice.
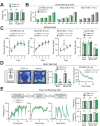
(A) Young-adult animals of both genotypes have similar weights, but old Calhm1−/− mice show lower weight than controls, *P < 0.05 (t = 2.89, t test). (B) Both genotypes behave similarly in the observational screen as shown by their scores for the five functions. (C) The rotarod test reveals no differences between genotypes in the time to fall from the rotating drum across the last 2 trials (graph at right), although old Calhm1−/− mice show slow motor learning (trial 2 for BL6 × 129 17-mo mice, *P < 0.05, t = 2.56, t test). (D) Open field test is similar between genotypes. Left, top view of the chamber showing the center and periphery (Per.) zones, as well as heat-maps for representative Calhm1+/+ and Calhm1−/− mice during the test. Middle, no difference in zone occupancy between genotypes. Right, similar time moving during the 20-min test for both genotypes. (E) Fear conditioning is equivalent in both genotypes. Left top, schematic of the task. Left bottom, time courses for the freezing response (% of total time, in 10-sec bins, presented as continuous lines) during the acquisition phase, and the two types of memory testing (context and tone). Right top, both genotypes show similar freezing during the last 5 min of the context memory test. Right bottom, both genotypes freeze equally during the presentation of the tones in the tone memory test. ns, non significant.
Figure 4
Figure 4. Impaired memory flexibility in Calhm1−/− mice.
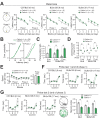
The Morris water maze task was used to assess spatial cognition. (A) Left, the diagrams show phase 1 of training with the platform (yellow circle) in the North location, and phase 2 with the platform in the South location. Right, mice of both genotypes show comparable latencies in phase 1, but Calhm1−/− mice display a clear deficit in phase 2, when the platform is switched to a novel location (left graph, F = 11.9, P < 0.001 ; middle graph, F = 17.8, P < 0.001; right graph, F = 9.54, P < 0.005, RMANOVA with last 16 trials as the repeated measure). (B) Cumulative probability plots for all trials in each phase show that Calhm1−/− mice have significantly longer latencies in phase 2 (Z = 2.15, P < 0.001, Kolmogorov-Smirnov test). (C) The perseveration ratio is markedly higher in Calhm1−/− mice. (D) Learning scores are unchanged across phases for Calhm1−/− mice, whereas Calhm1+/+ mice show a significantly enhanced score in phase 2. These results show lack of memory flexibility in Calhm1−/− mice. (E) Swimming speeds are comparable between Calhm1−/− and Calhm1+/+ mice across the two phases (left) and probe tests (right). (F) Performance during the first probe test is similar in both genotypes; abbreviations for pool quadrants, L, left, R, right, O, opposite, T, target. (G) Impaired performance of Calhm1−/− mice during the second probe test. Left, the graphs show lower exploration of the target quadrant by Calhm1−/− mice. Middle, representative swim-paths of old mice showing focused search by Calhm1+/+ mouse and broad search by Calhm1−/− mouse. Right, the spatial memory index is markedly lower in Calhm1−/− animals. *P < 0.05; **P < 0.005 (t test).
Figure 5
Figure 5. Selective deficit in LTP in Calhm1−/− hippocampus.
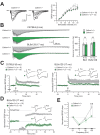
(A) Left, traces from old Calhm1+/+ and Calhm1−/− mice show representative fEPSPs at increasing stimulation strengths. Right, plot displays the mean fEPSP slopes vs. stimulation intensities, revealing comparable input-output functions between genotypes. (B) Left, representative traces for a train of high-frequency stimulation (HFS, 100 Hz for 1 sec) from young-adult and old Calhm1+/+ and Calhm1−/− mice, in which the stimulus artifacts have been subtracted. Shaded areas-over-the-curves are used for analysis. Right, total integral of HFS train is comparable across groups. (C) LTP is impaired in young-adult and old Calhm1−/− mice. A comparison at 45 min post-HFS reveals significant differences between genotypes (left, t = 4.23, P < 0.0001; right, t = 3.42, P < 0.005, t test). Inset, traces at 5 min pre- and 45 min post-HFS. (D) LTD is not affected in old Calhm1−/− mice. Inset, traces at 5 min pre- and 60 min post-LFS, low-frequency stimulation (1 Hz for 15 min). (E) BCM curves showing selective deficit of LTP expression (100 Hz train) in Calhm1−/− mice. Each point represents the mean ± SEM at 60 min post-1 Hz, 30 min post-50 Hz, and 45 min post-100 Hz; range = 9–23, young-adult and old experiments combined for each genotype. *P < 0.01, t test. For (C,D), arrows indicate blanked stimulus artifacts; scale, x-axis, 10 msec, y-axis, 1 mV.
Figure 6
Figure 6. CALHM1 activation controls PKA-mediated NMDAR and AMPAR phosphorylation and glutamate-mediated c-Fos and C/EBPβ expression in neurons.
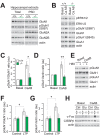
(A) WB analysis of the levels of the indicated proteins in whole hippocampal homogenates (Total) and PSD fractions obtained from Calhm1+/+ and Calhm1−/− mice. (B) Primary neurons isolated from Calhm1+/+ and Calhm1−/− mice were challenged with the calcium add-back condition (CaAB) or not (Basal). Cell extracts were analyzed by WB for the indicated proteins. Representative results from 4 independent experiments are depicted. (C,D) Densitometric analysis and quantification of the ratio for phospho-Ser-897 GluN1 over total GluN1 (pGluN1/GluN1), (C) and for phospho-Ser-845 GluA1 over actin (pGluA1/actin), (D) from Calhm1+/+ and Calhm1−/− primary neurons treated as in (B). au, arbitrary units (n = 6; *P < 0.05; **P < 0.01; t test). (E) WB analysis of the levels of the indicated proteins in Calhm1+/+ primary neurons pretreated for 30 min with H89 (10 μM) and then challenged with CaAB, as in (B). (F,G) Ratio for phospho-Ser-897 GluN1 over total GluN1 (pGluN1/GluN1), (F) and for phospho-Ser-845 GluA1 over actin (pGluA1/actin), (G) from LTP-stimulated hippocampal slices (n = 10–12; *P < 0.05; t test). (H) WB analysis of the levels of the indicated proteins in Calhm1+/+ and Calhm1−/− primary neurons challenged with CaAB, as in (B), in the absence (Ctrl) or presence of glutamate stimulation (Glu, 20 μM, 1 h incubation for c-Fos, 4 h for c/EBPβ).

Similar articles

Cited by

References

    1. Dreses-Werringloer U. et al.. A polymorphism in CALHM1 influences Ca2+ homeostasis, Abeta levels, and Alzheimer’s disease risk. Cell 133, 1149–1161, doi: 10.1016/j.cell.2008.05.048 (2008). - DOI - PMC - PubMed
    1. Skrabanek L. & Campagne F. TissueInfo: high-throughput identification of tissue expression profiles and specificity. Nucleic Acids Res 29, E102–102 (2001). - PMC - PubMed
    1. Desgranges B. et al.. The neural substrates of episodic memory impairment in Alzheimer’s disease as revealed by FDG-PET: relationship to degree of deterioration. Brain 125, 1116–1124 (2002). - PubMed
    1. Lambert J. C. et al.. The CALHM1 P86L polymorphism is a genetic modifier of age at onset in Alzheimer’s disease: a meta-analysis study. J Alzheimers Dis 22, 247–255, doi: 10.3233/JAD-2010-100933 (2010). - DOI - PMC - PubMed
    1. Vingtdeux V. et al.. CALHM1 ion channel elicits amyloid-β clearance by insulin-degrading enzyme in cell lines and in vivo in the mouse brain. J Cell Sci 128, 2330–2338, doi: 10.1242/jcs.167270 (2015). - DOI - PMC - PubMed

Publication types