. 2016 May 5;44(8):3503-12.
doi: 10.1093/nar/gkw135. Epub 2016 Apr 8.

Simulated binding of transcription factors to active and inactive regions folds human chromosomes into loops, rosettes and topological domains

Affiliations

Simulated binding of transcription factors to active and inactive regions folds human chromosomes into loops, rosettes and topological domains

Chris A Brackley et al. Nucleic Acids Res. .

Abstract

Biophysicists are modeling conformations of interphase chromosomes, often basing the strengths of interactions between segments distant on the genetic map on contact frequencies determined experimentally. Here, instead, we develop a fitting-free, minimal model: bivalent or multivalent red and green 'transcription factors' bind to cognate sites in strings of beads ('chromatin') to form molecular bridges stabilizing loops. In the absence of additional explicit forces, molecular dynamic simulations reveal that bound factors spontaneously cluster-red with red, green with green, but rarely red with green-to give structures reminiscent of transcription factories. Binding of just two transcription factors (or proteins) to active and inactive regions of human chromosomes yields rosettes, topological domains and contact maps much like those seen experimentally. This emergent 'bridging-induced attraction' proves to be a robust, simple and generic force able to organize interphase chromosomes at all scales.


Figures

Figure 1.
Figure 1.
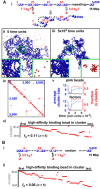
Bound ‘factors’ spontaneously cluster. (A) Regularly-spaced high-affinity binding sites. (i) Overview. MD simulations involved a 3-μm cube containing 250 30-nm red spheres (‘transcription factors’; volume fraction 0.01% or 15 nM), and a fiber of 5000 30-nm beads (15-Mbp ‘chromatin’, so each bead contains 3 kbp; persistence length 90 nm; volume fraction 0.26%, so chromatin is ‘dilute’). One bead in 20 is pink (with regular spacing), others are blue. Beads begin to interact (strength indicated) with factors after 104 time units if centers lie within 54 nm; here, binding of a factor to beads 21 and 41 creates a loop. (ii,iii) Snapshots after different times; insets show magnifications of boxed areas (with/without chromatin). (iv) Contact map after 5 × 10⁴ time units (axes give bead numbers; data from one run). Here (and later, unless stated otherwise), a contact is scored if bead centers lie within 150 nm, and contacts made by 40 adjacent beads are binned; a red pixel then marks contacts between beads at positions indicated, with intensity (white to red) reflecting contact number (low to high). Blocks along the diagonal mark many contacts made by clusters of bound factors. (v) Average cluster size, and fraction in clusters, for pink beads and factors (data sampled every 1000 time units). Two or more pink beads are in one cluster if centers lie <90 nm apart. Small clusters form quickly, and slowly enlarge to the steady-state size. (vi) Rosettogram. A red pixel marks the presence of a high-affinity bead in a cluster; increasing numbers of abutting pixels in one row reflect increasing numbers of loops in a rosette involving near-neighbor high-affinity sites. Most clusters contain ≥2 loops. fd: disorganized fraction (average of 5 runs). (B) Randomly-distributed high-affinity binding sites. (i) Pink beads are randomly distributed over the fiber, with the same average linear density as in (A). (ii) Rosettogram. The structure is slightly more rosette-like than the one in (A) (reflected by a lower fd).
Figure 2.
Figure 2.
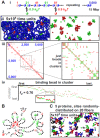
Self-assembly into ‘specialized’ clusters. MD simulations were run as in Figure 1, except for differences indicated. (A) Red (n = 250) and green (n = 250) factors interact with pink and light-green beads, respectively. (i) One bead in 20 is a binding bead (with regular spacing); the colors of binding beads alternate as indicated. (ii) Final snapshot of central region (with/without chromatin); clusters contain either red or green factors. (iii) Final contact map; blocks along the diagonal are small. The zoom shows a high-resolution map involving only binding beads in clusters; contacts are scored (without binning) if bead centers lie 90 nm apart (not 150 nm), and any binding beads are treated as if they possess the color of factor binding them. Here, red and green pixels mark contacts between two pink beads, or between two light-green beads: notably, there are no mixed contacts between a light-green and pink bead (these are shown in yellow in Supplementary Figure S3). Similarly-colored pixels rarely abut in a row, as the fiber passes back and forth between differently-colored clusters. (iv) Final rosettogram (pixels correspond to binding beads, and are colored as in the contact map zoom); rows rarely contain abutting pixels of one color (reflected by a high fd). (B) How ‘specialized’ clusters form. See text. (C) Red, green, dark-blue, purple and black factors (500 of each) bind (7.1 kBT) to five sets of cognate sites scattered randomly along 20 identical fibers (each with 2000 beads representing 6 Mbp). The snapshot (taken after 5 × 10⁴ units; DNA not shown for clarity) shows that each factor tends to cluster with similarly-colored ones. See also Supplementary Figure S5.
Figure 3.
Figure 3.
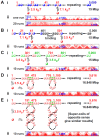
Domain formation. MD simulations were run as in Figure 1, unless stated otherwise (n = total number of runs). In contact maps, only regions around the (horizontally-placed) diagonal are shown; axes give bead numbers (blue). [Supplementary Figure S7 shows complete contact maps.] (A) Clustering of factors does not necessarily lead to domains. (i) Red factors bind with high-affinity to pink beads (one beads every 20), and with low affinity to blue beads. (ii) Although pyramids are seen in the contact map after 1 run, averaging data from 20 runs blurs patterns. (B) Gene deserts. (i) Blocks of 400 binding beads (blue and pink; one bead every 20 is pink) alternate with blocks of 100 non-binding beads (gray); red factors bind to blue and pink beads with low and high affinity, respectively. (ii) Each pyramid coincides with a block of pink and blue beads, and is separated from the next by a disordered region. (C) Hetero- and eu-chromatin. (i) Blocks of 300 light-green and 100 pink beads alternate; red and green factors bind to pink and light-green beads, respectively. (ii) Large pyramids alternate with small ones, reflecting reproducible assembly of blocks into domains. (D) Loops. (i) The fiber is pre-organized into loops by forcing selected beads (green rectangles) to bind irreversibly; this results in 324-bead loops separated by 300 unlooped beads (plus 150 unlooped ones at each end). All beads are pink and red factors can bind to any bead. Loops are initially torsionally relaxed (i.e. with linking number, Lk, equal to 0), we assume that the linking number is conserved in each loop throughout the simulation (for better comparison with (E) below). Nevertheless, we have checked that very similar results are obtained if this assumption is relaxed. (ii) Pyramids are less well defined than in (B and C), but nevertheless tend to coincide with loops (see also Supplementary Figure S9). (E) Supercoiled loops. (i) As (D), but each loop has a linking number of +32. (ii) Loops form pyramids that are more distinct than in (D).
Figure 4.
Figure 4.
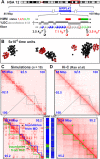
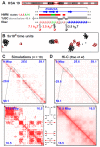
Simulating 15 Mbp of chromosome 12 in GM12878 cells. Conditions as Figure 1, with exceptions indicated (chromatin concentration now 0.01%). (A) Overview. The ideogram (red box gives region analyzed) and Broad ChromHMM track (colored regions reflect chromatin states) are from the UCSC browser; the zoom illustrates the MRPL42 promoter. Beads (1 kbp) are colored according to HMM state and GC content (blue—non-binding; pink—states 1 + 4 + 5, n = 600; light-green—states 9 + 10, n = 880; gray <41.8% GC, n = 10 646). Red factors (n = 300) bind to (active) pink and light-green beads with high and low affinities, respectively; black (heterochromatin-binding) proteins (n = 3000) bind to gray beads. In the zoom, two pink beads (gray halos) bind both red factors and black proteins. (B) Snapshot (without chromatin) of central region after 5 × 10⁴ time units; most clusters contain factors/proteins of one color. Long runs of gray beads form large black clusters. (C and D) Contact maps from simulations (7 kbp binning) and Hi-C (10 kbp binning; (7)). In zooms, blue and green lines mark boundaries determined by visual inspection of data from simulations or Hi-C, and dots in D mark loops found using the Janus plot (Supplementary Figure S9A). Tracks of HMM state and %GC (colored as in A) illustrate correlations with domains and boundaries.
Figure 5.
Figure 5.
Simulating chromosome 19 in GM12878 cells. Conditions as Figure 4, with exceptions indicated. (A) Overview. The ideogram (red box indicates whole chromosome simulated) and HMM track (colored regions reflect chromatin states) are from the UCSC browser; the zoom illustrates the region around RAD23A. Beads (3 kbp) are colored according to HMM state and GC content (blue—non-binding; pink—states 1 + 4 + 5, n = 2473; light-green—states 9 + 10, n = 2686; gray <48.4% GC, n = 9472). Red factors (n = 400) bind to (active) pink and light-green beads with high and low affinities, respectively; black (heterochromatin-binding) proteins (n = 4000) bind to gray beads. In the zoom, two pink beads (gray halos) bind both red and black factors. (B) Snapshot (without chromatin) of central region after 5 × 10⁴ units; most clusters contain factors (or proteins) of one color. (C and D) Contact maps (21 and 20 kbp binning for data from simulations and Hi-C). Between zooms, black double-headed arrows mark boundaries of prominent domains (on the diagonal) and red double-headed ones the centers of off-diagonal blocks making many inter-domain contacts (boundaries and domains detected via the difference plot aided by visual inspection).

Similar articles

Cited by

References

    1. Cavalli G., Misteli T. Functional implications of genome topology. Nat. Struct. Mol. Biol. 2013;20:290–299. - PMC - PubMed
    1. Lieberman-Aiden E., van Berkum N.L., Williams L., Imakaev M., Ragoczy T., Telling A., Amit I., Lajoie B.R., Sabo P.J., Dorschner M.O., et al. Comprehensive mapping of long-range interactions reveals folding principles of the human genome. Science. 2009;326:289–293. - PMC - PubMed
    1. Dixon J.R., Selvaraj S., Yue F., Kim A., Li Y., Shen Y., Hu M., Liu J.S., Ren B. Topological domains in mammalian genomes identified by analysis of chromatin interactions. Nature. 2012;485:376–380. - PMC - PubMed
    1. Nora E.P., Lajoie B.R., Schulz E.G., Giorgetti L., Okamoto I., Servant N., Piolot T., van Berkum N.L., Meisig J., Sedat J., et al. Spatial partitioning of the regulatory landscape of the X-inactivation centre. Nature. 2012;485:381–385. - PMC - PubMed
    1. Sexton T., Yaffe E., Kenigsberg E., Bantignies F., Leblanc B., Hoichman M., Parrinello H., Tanay A., Cavalli G. Three-dimensional folding and functional organization principles of the Drosophila genome. Cell. 2012;148:458–472. - PubMed

Publication types

MeSH terms

LinkOut - more resources