Dclk1 Defines Quiescent Pancreatic Progenitors that Promote Injury-Induced Regeneration and Tumorigenesis
- PMID: 27058937
- PMCID: PMC4826481
- DOI: 10.1016/j.stem.2016.03.016
Dclk1 Defines Quiescent Pancreatic Progenitors that Promote Injury-Induced Regeneration and Tumorigenesis
Abstract
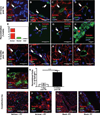
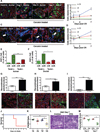
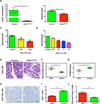
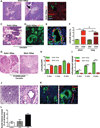
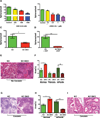
The existence of adult pancreatic progenitor cells has been debated. While some favor the concept of facultative progenitors involved in homeostasis and repair, neither a location nor markers for such cells have been defined. Using genetic lineage tracing, we show that Doublecortin-like kinase-1 (Dclk1) labels a rare population of long-lived, quiescent pancreatic cells. In vitro, Dclk1+ cells proliferate readily and sustain pancreatic organoid growth. In vivo, Dclk1+ cells are necessary for pancreatic regeneration following injury and chronic inflammation. Accordingly, their loss has detrimental effects after cerulein-induced pancreatitis. Expression of mutant Kras in Dclk1+ cells does not affect their quiescence or longevity. However, experimental pancreatitis converts Kras mutant Dclk1+ cells into potent cancer-initiating cells. As a potential effector of Kras, Dclk1 contributes functionally to the pathogenesis of pancreatic cancer. Taken together, these observations indicate that Dclk1 marks quiescent pancreatic progenitors that are candidates for the origin of pancreatic cancer.
Copyright © 2016 Elsevier Inc. All rights reserved.
Figures


Comment in
-
Pancreatic DCLK1 marks quiescent but oncogenic progenitors: a possible link to neuroendocrine tumors.Stem Cell Investig. 2016 Aug 12;3:37. doi: 10.21037/sci.2016.08.03. eCollection 2016. Stem Cell Investig. 2016. PMID: 27668244 Free PMC article. No abstract available.
-
Epigenetic regulation of human DCLK-1 gene during colon-carcinogenesis: clinical and mechanistic implications.Stem Cell Investig. 2016 Sep 28;3:51. doi: 10.21037/sci.2016.09.07. eCollection 2016. Stem Cell Investig. 2016. PMID: 27777940 Free PMC article.
Similar articles
-
DCLK1 marks a morphologically distinct subpopulation of cells with stem cell properties in preinvasive pancreatic cancer.Gastroenterology. 2014 Jan;146(1):245-56. doi: 10.1053/j.gastro.2013.09.050. Epub 2013 Oct 2. Gastroenterology. 2014. PMID: 24096005 Free PMC article.
-
Targeting pancreatitis blocks tumor-initiating stem cells and pancreatic cancer progression.Oncotarget. 2015 Jun 20;6(17):15524-39. doi: 10.18632/oncotarget.3499. Oncotarget. 2015. PMID: 25906749 Free PMC article.
-
The Histone Demethylase KDM3A, Increased in Human Pancreatic Tumors, Regulates Expression of DCLK1 and Promotes Tumorigenesis in Mice.Gastroenterology. 2019 Dec;157(6):1646-1659.e11. doi: 10.1053/j.gastro.2019.08.018. Epub 2019 Aug 20. Gastroenterology. 2019. PMID: 31442435 Free PMC article.
-
Functional implication of Dclk1 and Dclk1-expressing cells in cancer.Small GTPases. 2017 Jul 3;8(3):164-171. doi: 10.1080/21541248.2016.1208792. Epub 2016 Jul 26. Small GTPases. 2017. PMID: 27458755 Free PMC article. Review.
-
Roles of Dclk1 in the pathogenesis, diagnosis, prognosis and treatment of pancreatic cancer: A review.Expert Rev Gastroenterol Hepatol. 2022 Jan;16(1):13-19. doi: 10.1080/17474124.2022.2020643. Epub 2021 Dec 27. Expert Rev Gastroenterol Hepatol. 2022. PMID: 34937474 Review.
Cited by
-
Kelch-like proteins in the gastrointestinal tumors.Acta Pharmacol Sin. 2023 May;44(5):931-939. doi: 10.1038/s41401-022-01007-0. Epub 2022 Oct 20. Acta Pharmacol Sin. 2023. PMID: 36266566 Free PMC article. Review.
-
Reprogramming-Evolving Path to Functional Surrogate β-Cells.Cells. 2022 Sep 8;11(18):2813. doi: 10.3390/cells11182813. Cells. 2022. PMID: 36139388 Free PMC article. Review.
-
Role of DCLK1/Hippo pathway in type II alveolar epithelial cells differentiation in acute respiratory distress syndrome.Mol Med. 2023 Nov 23;29(1):159. doi: 10.1186/s10020-023-00760-0. Mol Med. 2023. PMID: 37996782 Free PMC article.
-
Hic-5 deficiency protects cerulein-induced chronic pancreatitis via down-regulation of the NF-κB (p65)/IL-6 signalling pathway.J Cell Mol Med. 2020 Jan;24(2):1488-1503. doi: 10.1111/jcmm.14833. Epub 2019 Dec 3. J Cell Mol Med. 2020. PMID: 31797546 Free PMC article.
-
Estrogen-Related Receptor γ Maintains Pancreatic Acinar Cell Function and Identity by Regulating Cellular Metabolism.Gastroenterology. 2022 Jul;163(1):239-256. doi: 10.1053/j.gastro.2022.04.013. Epub 2022 Apr 21. Gastroenterology. 2022. PMID: 35461826 Free PMC article.
References
-
- Bailey JM, Hendley AM, Lafaro KJ, Pruski MA, Jones NC, Alsina J, Younes M, Maitra A, McAllister F, Iacobuzio-Donahue CA, et al. p53 mutations cooperate with oncogenic Kras to promote adenocarcinoma from pancreatic ductal cells. Oncogene. 2015 - PubMed
-
- Buch T, Heppner FL, Tertilt C, Heinen TJ, Kremer M, Wunderlich FT, Jung S, Waisman A. A Cre-inducible diphtheria toxin receptor mediates cell lineage ablation after toxin administration. Nat Methods. 2005;2:419–426. - PubMed
Publication types
MeSH terms
Substances
Grants and funding
- T32 GM082797/GM/NIGMS NIH HHS/United States
- U01 CA168426/CA/NCI NIH HHS/United States
- CAPMC/ CIHR/Canada
- U01CA168426/CA/NCI NIH HHS/United States
- S10 OD012351/OD/NIH HHS/United States
- R37 GM030518/GM/NIGMS NIH HHS/United States
- S10 OD021764/OD/NIH HHS/United States
- GM30518/GM/NIGMS NIH HHS/United States
- HHMI/Howard Hughes Medical Institute/United States
- R01 GM030518/GM/NIGMS NIH HHS/United States
- R01 DK097016/DK/NIDDK NIH HHS/United States
- R01 CA109525/CA/NCI NIH HHS/United States
- R01 DK060694/DK/NIDDK NIH HHS/United States
- R35 CA197745/CA/NCI NIH HHS/United States
LinkOut - more resources
Full Text Sources
Other Literature Sources
Medical
Molecular Biology Databases
Research Materials
Miscellaneous

