. 2016 May 10;7(19):27946-58.
doi: 10.18632/oncotarget.8547.

High efficacy of the BCL-2 inhibitor ABT199 (venetoclax) in BCL-2 high-expressing neuroblastoma cell lines and xenografts and rational for combination with MCL-1 inhibition

Affiliations

High efficacy of the BCL-2 inhibitor ABT199 (venetoclax) in BCL-2 high-expressing neuroblastoma cell lines and xenografts and rational for combination with MCL-1 inhibition

Laurel T Bate-Eya et al. Oncotarget. .

Abstract

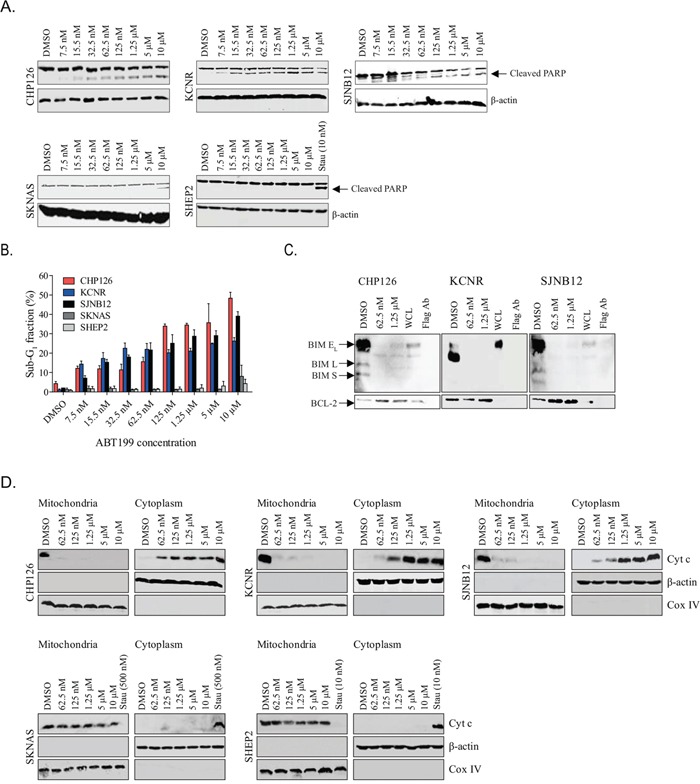
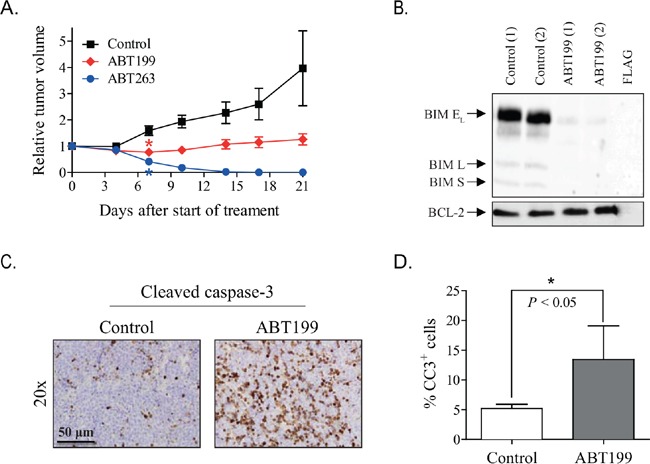
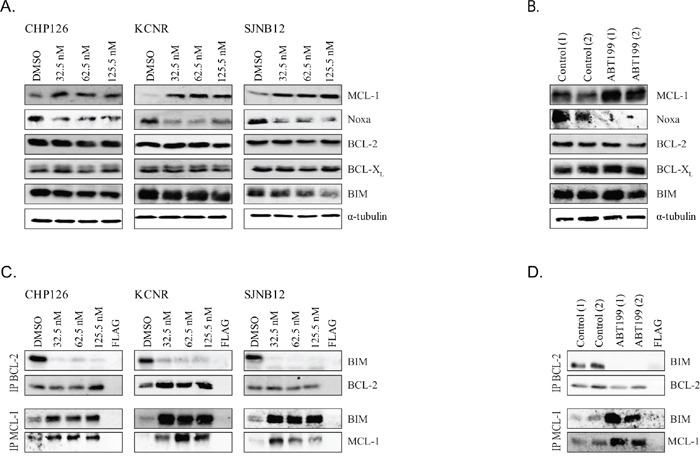
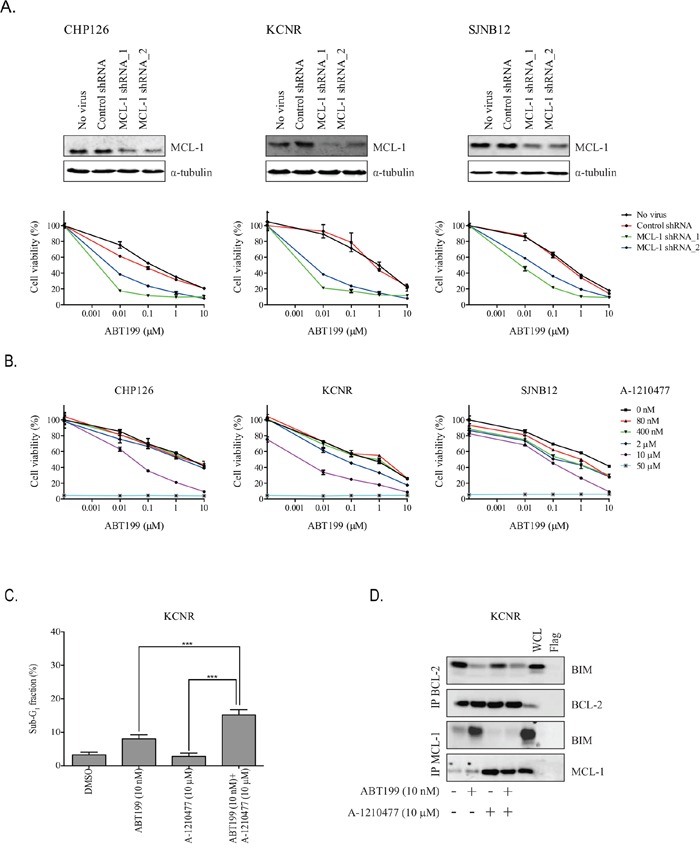
The anti-apoptotic protein B cell lymphoma/leukaemia 2 (BCL-2) is highly expressed in neuroblastoma and plays an important role in oncogenesis. In this study, the selective BCL-2 inhibitor ABT199 was tested in a panel of neuroblastoma cell lines with diverse expression levels of BCL-2 and other BCL-2 family proteins. ABT199 caused apoptosis more potently in neuroblastoma cell lines expressing high BCL-2 and BIM/BCL-2 complex levels than low expressing cell lines. Effects on cell viability correlated with effects on BIM displacement from BCL-2 and cytochrome c release from the mitochondria. ABT199 treatment of mice with neuroblastoma tumors expressing high BCL-2 levels only resulted in growth inhibition, despite maximum BIM displacement from BCL-2 and the induction of a strong apoptotic response. We showed that neuroblastoma cells might survive ABT199 treatment due to its acute upregulation of the anti-apoptotic BCL-2 family protein myeloid cell leukaemia sequence 1 (MCL-1) and BIM sequestration by MCL-1. In vitro inhibition of MCL-1 sensitized neuroblastoma cell lines to ABT199, confirming the pivotal role of MCL-1 in ABT199 resistance. Our findings suggest that neuroblastoma patients with high BCL-2 and BIM/BCL-2 complex levels might benefit from combination treatment with ABT199 and compounds that inhibit MCL-1 expression.

Keywords: ABT199; BCL-2; MCL-1; neuroblastoma; resistance.


Conflict of interest statement

The authors declare no conflicts of interest.

Figures

Figure 1
Figure 1. BCL-2 protein and BIM/BCL-2 complex levels predict sensitivity of neuroblastoma cell lines to ABT199
A. Western blot analysis of the protein expression levels of anti-apoptotic proteins BCL-2, MCL-1, BCL-XL, and BCL-W and the pro-apoptotic protein BIM in neuroblastoma cell lines. α-tubulin was used as household protein. B. protein levels of BCL-2, MCL-1, BCL-XL, BCL-W and BIM and BIM/BCL-2 complex levels in sensitive (i.e., CHP126, KCNR, and SJNB12) versus insensitive neuroblastoma cell lines. Protein levels shown in Figure A were quantified by calculating the protein/α-tubulin band intensity ratios. BIM/BCL-2 complex levels were established by anti-BCL-2 immunoprecipitation of whole cell lysates, followed by Western blotting for BIM. BIM band intensities were normalized to the IgG heavy chain of the BCL-2 antibody. Statistical differences between the sensitive and insensitive cell lines were calculated using a one-tailed (for BCL-2 and BIM/BCL-2 complex) or two-tailed unpaired Student t test, with P < 0.05 as the minimal level of significance and P < 0.0001 indicated as ***. Horizontal lines represent the mean of the relative intensities of the cell line panel. C. Western blot analysis of BIM/BCL-2 complex levels in 24 neuroblastoma cell lines, ordered from ABT199 sensitive (left) to ABT199 insensitive (right). The IgG heavy chain of the BCL-2 antibody served as a loading control. Total protein levels of the BCL-2-like family member proteins of the cell line panel in Figure 1A served as whole cell lysates for this experiment.
Figure 2
Figure 2. ABT199 induces cell death in BCL-2 dependent neuroblastoma cell lines through activation of the intrinsic apoptotic pathway
A. Western blot analysis of the in vitro effects of ABT199 on PARP cleavage after 72-hour treatment of sensitive neuroblastoma cell lines CHP126, KCNR and SJNB12 and insensitive cell lines SKNAS and SHEP2 with increasing ABT199 concentrations. β-actin served as loading control. As ABT199 failed to induce PARP cleavage in SHEP2, staurosporine (10 nmol/L, 24 hours; indicated as Stau) was used as a positive control for this cell line. B. FACS analysis of the in vitro effects on sub-G1 induction after 72-hour treatment with increasing ABT199 concentrations. Data represent the mean percentages of cells in sub-G1 ± SD of three replicate experiments. C. in vitro effects on BIM displacement from BCL-2 after 24-hour treatment of CHP126, KCNR and SJNB12 with 62.5 nmol/L or 1.25 μmol/L ABT199. BIM displacement was established by detecting BIM/BCL-2 complex levels by anti-BCL-2 immunoprecipitation, followed by Western blotting for BIM. BCL-2 levels served as loading control. (BIM EL = BIM extra-large, BIM L = BIM large and BIM S = BIM small) WCL= whole cell lysate. D. Western blot analysis of the in vitro effects of ABT199 on cytochrome c release from the mitochondria into the cytosol. Cytochrome c levels (indicated as Cyt c) in the mitochondrial and cytoplasmic cell fractions were established after 24-hour treatment of the cell lines with increasing ABT199 concentrations. COX IV and β-actin were used as loading controls for the mitochondrial and cytoplasmic fractions, respectively. As ABT199 failed to induce cytochrome c release in SKNAS and SHEP2, cell lines were 24-hour treated with 500 and 10 nmol/L staurosporine, respectively, as a positive control.
Figure 3
Figure 3. ABT199 and ABT263 cause apoptosis in mice with KCNR neuroblastoma xenografts expressing high levels of BCL-2 and BIM/BCL-2 complex
A. inhibitory effects of ABT199 and ABT263 on the growth of KCNR neuroblastoma xenografts in mice. Relative tumor volume was calculated as the volume at the indicated day after start of treatment divided by the volume prior to treatment initiation. Data represent the mean relative tumor volume ± SEM [Group sizes: n = 10 (control; 10% ethanol/30% PEG 400/60% phosal 50 PG (v/v/v)), n = 5 (100 mg/kg ABT199), and n = 5 (100 mg/kg ABT263)]. Statistical differences between treated and control groups were calculated using one-way ANOVA Bonferroni adjustment and are indicated on the first day after treatment initiation at which a statistically different effect was observed (*). P values < 0.05 were considered significant. B. in vivo effects of ABT199 on BIM displacement from BCL-2. Effects were studied by detecting BIM/BCL-2 complex levels by anti-BCL-2 immunoprecipitation, followed by Western blotting for BIM (BIM EL = BIM extra-large, BIM L = BIM large and BIM S = BIM small). Levels of BIM/BCL-2 complex were established for n = 2 mice per group at 4 hours after administration of the last dose of ABT199. BCL-2 levels served as loading control. Total protein levels of the BCL-2 family members in Figure 4D served as input levels for this experiment. C. representative microscopic images of cleaved caspase 3 stained paraffin-embedded tumor sections of control and ABT199-treated tumor samples collected at 4 hours after administration of the last dose. Magnification of the images: 20x. Scale bar: 50 μm. D. quantification of the stimulatory effect of ABT199 on cleaved caspase 3 was performed by manual counting of the total number of cells and the number of cleaved caspase 3-positive (CC3+) cells in 20 microscopic fields per mouse sample at 40x magnification (30% of each field). The average percentage of CC3+ cells for each mouse was used to determine the effect of ABT199. Statistical differences between the control group (n = 6) and ABT199-treated group (n = 2) were calculated using a one-tailed unpaired Students t test and are indicated as * (P < 0.05).
Figure 4
Figure 4. ABT199 causes MCL-1 upregulation and Noxa downregulation, leading to increased sequestration of released BIM from BCL-2
A. in vitro effects of ABT199 on total protein levels of MCL-1, Noxa, BCL-2, BCL-XL and BIM in CHP126, KCNR and SJNB12 after 24-hour treatment with increasing doses. Effects were determined by Western blot analysis using α-tubulin as a loading control. B. in vivo effects of ABT199 on total protein levels of MCL-1, Noxa, BCL-2, BCL-XL and BIM. Mice with KCNR neuroblastoma xenografts were daily treated with vehicle or 100 mg/kg ABT199 for 3 consecutive weeks. Tumor samples were collected at 4 hours after administration of the last dose and analyzed by Western blot analysis. α-tubulin served as a loading control. C. in vitro effects of ABT199 on BIM/BCL-2, and BIM/MCL-1 complex levels in CHP126, SJNB12 and KCNR after 24-hour treatment with increasing doses. BIM/BCL-2 and BIM/MCL-1 complex levels were established by immunoprecipitation of BCL-2 and MCL-1 followed by Western blot analysis of BIM. Immunoprecipitated levels of BCL-2 and MCL-1 were used as loading controls. D. in vivo effects of ABT199 on BIM/BCL-2 and BIM/MCL-1 complex levels. Tumor samples (n = 2 per group) were collected after 3 weeks treatment with vehicle or 100 mg/kg/day ABT199, at 4 hours after administration of the last dose. BIM/BCL-2 and BIM/MCL-1 complex levels were subsequently determined as described above.
Figure 5
Figure 5. MCL-1 inhibition sensitizes high BCL-2 and BIM/BCL-2-expressing neuroblastoma cells to ABT199
A. in vitro effects of MCL-1 knockdown on the sensitivity of neuroblastoma cell lines CHP126, KCNR and SJNB12 to ABT199. Cells were 72-hour transfected with non-targeting control shRNA or MCL-1 shRNA (i.e., MCL-1 shRNA_1 or MCL-1 shRNA_2) prior to treatment with DMSO (control) or indicated ABT199 concentrations. Cell viability was assessed after 72-hour treatment using the MTT colorimetric assay. For each cell line, the viability of non-transfected cells treated with DMSO was set to 100%. B. in vitro effects of the small molecule MCL-1 inhibitor A-1210477 on the sensitivity of CHP126, KCNR and SJNB12 to ABT199. Cells were co-treated with 0-10 μmol/L ABT199 and 0-50 μmol/L A-1210477. Effects on cell viability were established after 72-hour treatment using the MTT colorimetric assay. For each cell line, the viability of untreated cells was set to 100%. C. FACs analysis of KCNR after 72-hour treatment with 10 nmol/L ABT199 alone or in combination with 10 μmol/L A-1210477. Data represent the mean percentages of cells in sub-G1 ± SD of three replicate experiments. D. in vitro effects on BIM displacement from BCL-2 and MCL-1 after 24-hour treatment of KCNR with 10 nmol/L of ABT199 or 10μmol/L of A-1210477 and a combination of both compounds. BIM displacement was established by detecting BIM/BCL-2 and BIM/MCL-1 complex levels by anti-BCL-2 and anti-MCL-1 immunoprecipitation, followed by Western blotting for BIM. BCL-2 and MCL-1 levels served as loading control.

Similar articles

Cited by

References

    1. Yip KW, Reed JC. Bcl-2 family proteins and cancer. Oncogene. 2008;27:6398–6406. - PubMed
    1. Czabotar PE, Lessene G, Strasser A, Adams JM. Control of apoptosis by the BCL-2 protein family: implications for physiology and therapy. Nat Rev Mol Cell Biol. 2014;15:49–63. - PubMed
    1. Iqbal J, Neppalli VT, Wright G, Dave BJ, Horsman DE, Rosenwald A, Lynch J, Hans CP, Weisenburger DD, Greiner TC, Gascoyne RD, Campo E, Ott G, Muller-Hermelink HK, Delabie J, Jaffe ES, et al. BCL2 expression is a prognostic marker for the activated B-cell-like type of diffuse large B-cell lymphoma. J Clin Oncol. 2006;24:961–968. - PubMed
    1. Chipuk JE, Moldoveanu T, Llambi F, Parsons MJ, Green DR. The BCL-2 family reunion. Mol Cell. 2010;37:299–310. - PMC - PubMed
    1. Green DR, Kroemer G. The pathophysiology of mitochondrial cell death. Science. 2004;305:626–629. - PubMed

MeSH terms