Review
. 2016 Apr 7;11(4):e0151841.
doi: 10.1371/journal.pone.0151841. eCollection 2016.

Association between Parkinson's Disease and Cigarette Smoking, Rural Living, Well-Water Consumption, Farming and Pesticide Use: Systematic Review and Meta-Analysis

Affiliations
Review

Association between Parkinson's Disease and Cigarette Smoking, Rural Living, Well-Water Consumption, Farming and Pesticide Use: Systematic Review and Meta-Analysis

Charles B Breckenridge et al. PLoS One. .

Abstract

Objective: Bradford Hill's viewpoints were used to conduct a weight-of-the-evidence assessment of the association between Parkinson's disease (PD) and rural living, farming and pesticide use. The results were compared with an assessment based upon meta-analysis. For comparison, we also evaluated the association between PD and cigarette smoking as a "positive control" because a strong inverse association has been described consistently in the literature.

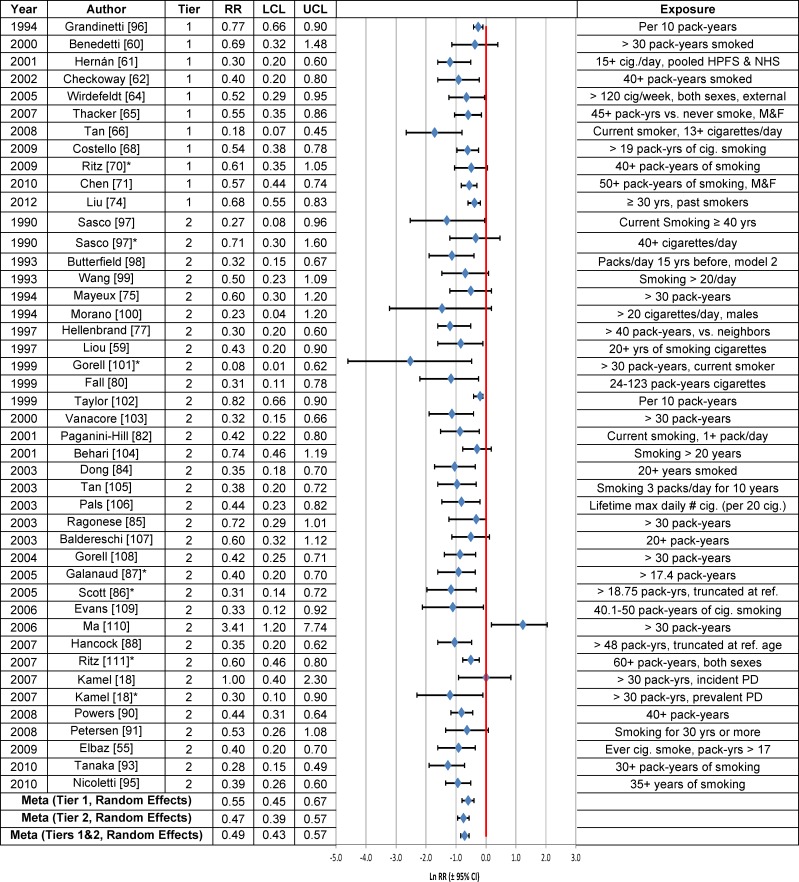
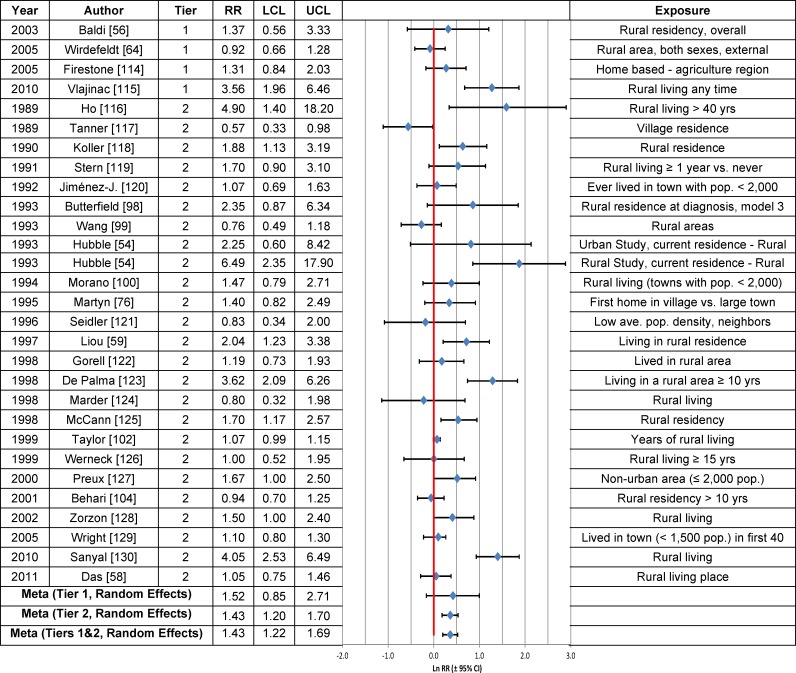
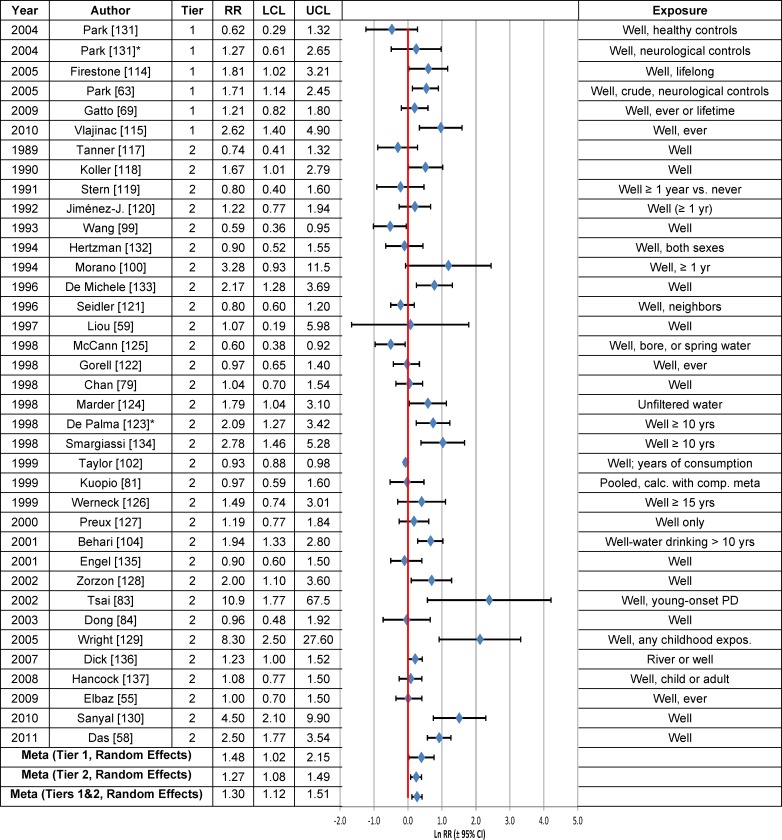
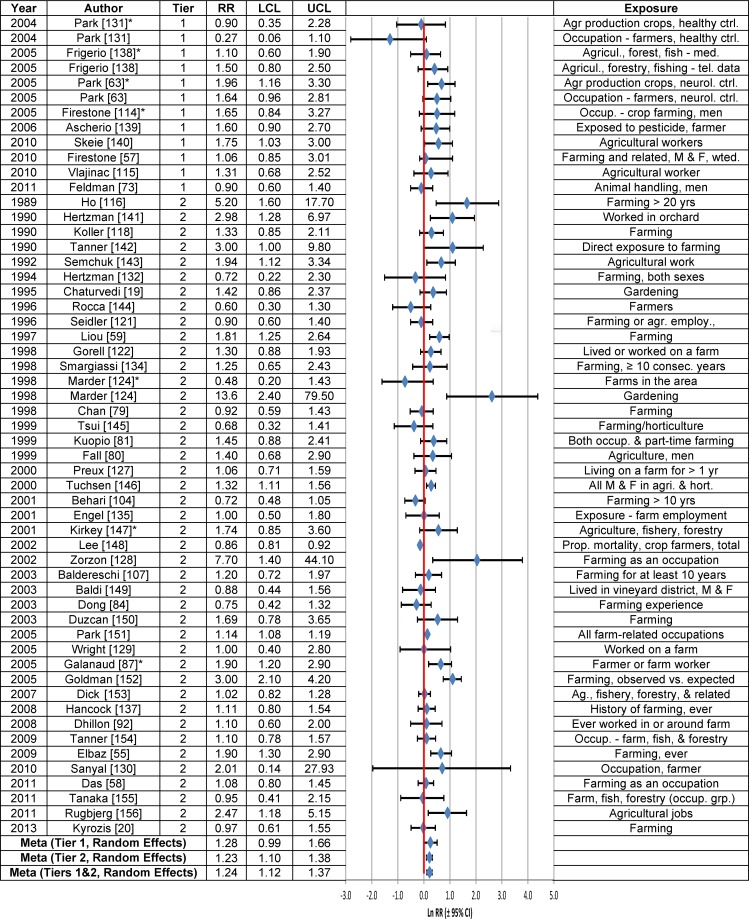
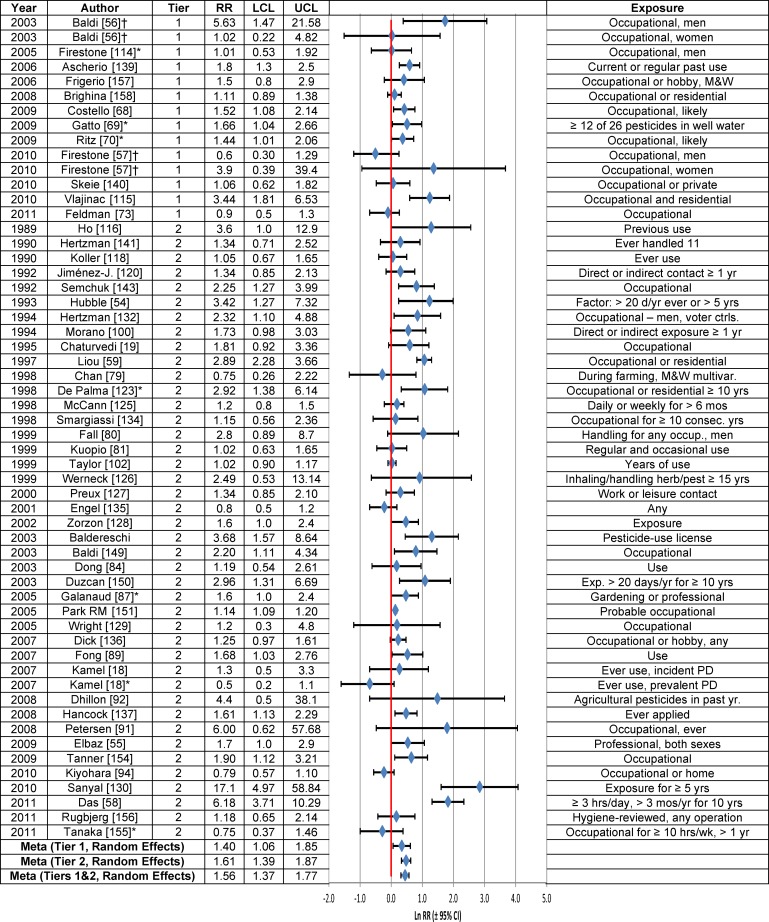
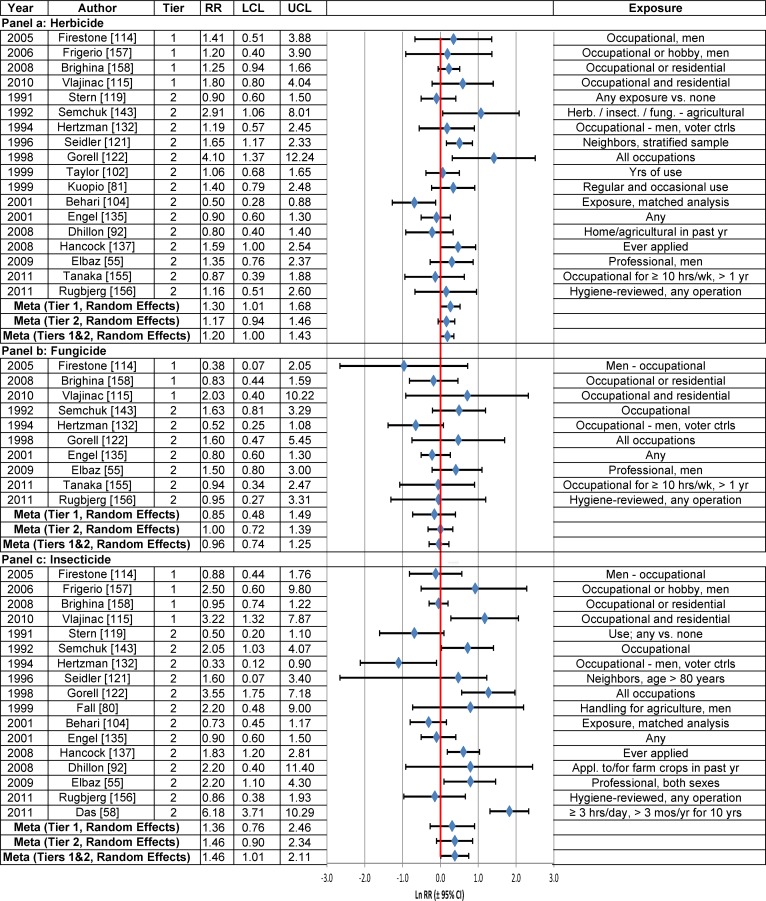
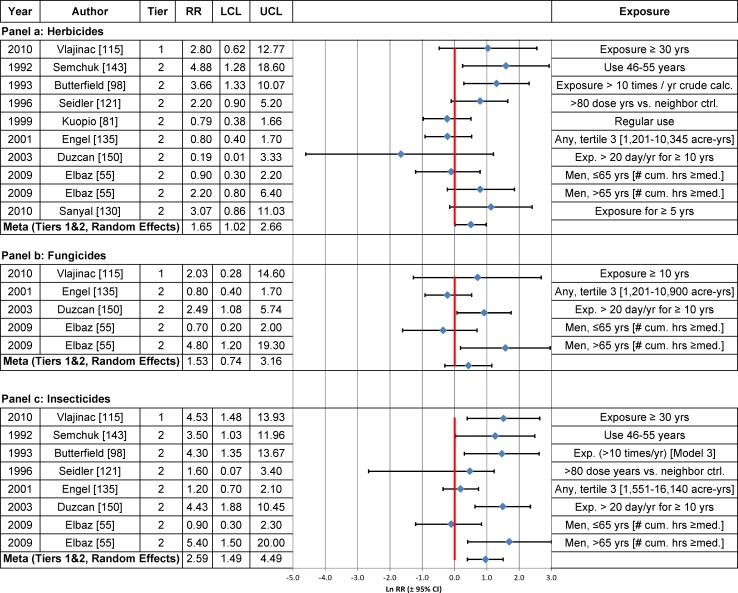
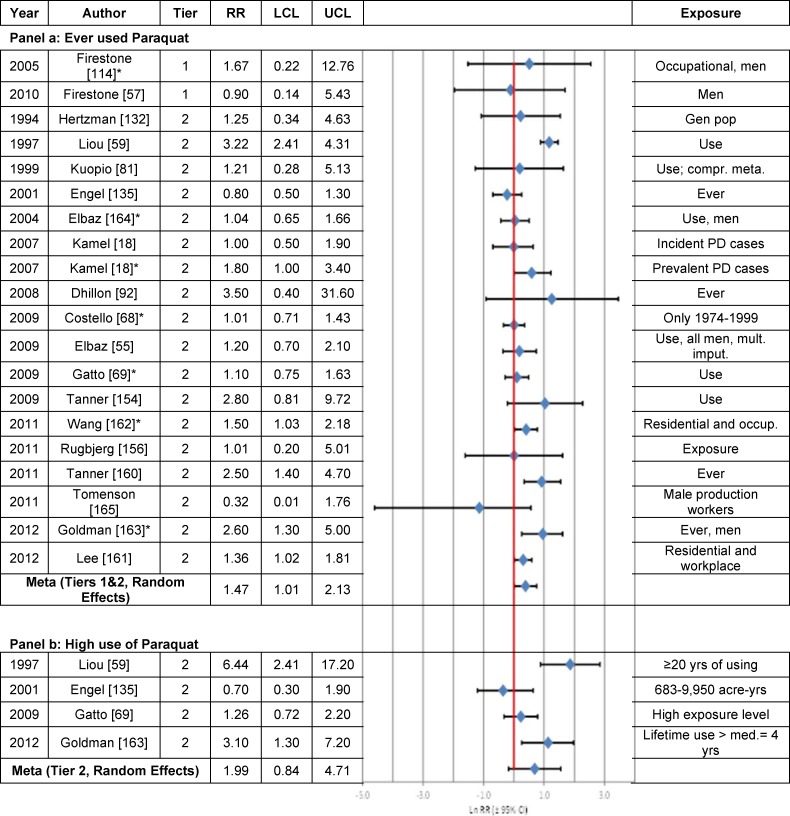
Methods: PubMed was searched systematically to identify all published epidemiological studies that evaluated associations between Parkinson's disease (PD) and cigarette smoking, rural living, well-water consumption, farming and the use of pesticides, herbicides, insecticides, fungicides or paraquat. Studies were categorized into two study quality groups (Tier 1 or Tier 2); data were abstracted and a forest plot of relative risks (RRs) was developed for each risk factor. In addition, when available, RRs were tabulated for more highly exposed individuals compared with the unexposed. Summary RRs for each risk factor were calculated by meta-analysis of Tier 1, Tier 2 and all studies combined, with sensitivity analyses stratified by other study characteristics. Indices of between-study heterogeneity and evidence of reporting bias were assessed. Bradford Hill's viewpoints were used to determine if a causal relationship between PD and each risk factor was supported by the weight of the evidence.

Findings: There was a consistent inverse (negative) association between current cigarette smoking and PD risk. In contrast, associations between PD and rural living, well-water consumption, farming and the use of pesticides, herbicides, insecticides, fungicides or paraquat were less consistent when assessed quantitatively or qualitatively.

Conclusion: The weight of the evidence and meta-analysis support the conclusion that there is a causal relationship between PD risk and cigarette smoking, or some unknown factor correlated with cigarette smoking. There may be risk factors associated with rural living, farming, pesticide use or well-water consumption that are causally related to PD, but the studies to date have not identified such factors. To overcome the limitations of research in this area, future studies will have to better characterize the onset of PD and its relationship to rural living, farming and exposure to pesticides.


Conflict of interest statement

Competing Interests: This study was funded by a grant from Syngenta Crop Protection, LLC., the employer of Dr. Charles B. Breckenridge (CBB), who received annual compensation in the form of salary and company benefits. Syngenta paid hourly fees for the time spent by the following co-authors of the study: Drs. Jack S. Mandel (JSM), Sir Colin Berry (CB), Ellen T. Chang (ETC), and Robert L. Sielken, Jr. (RLS), who are consultants to Syngenta. Ellen T. Chang and Jack S. Mandel are employed by Exponent, Inc. and Robert L. Sielken, Jr by Sielken & Associates Consulting, Inc. Syngenta Crop Protection, LLC, is a basic manufacturer of paraquat. There are no further patents, products in development, or marketed products to declare. This does not alter the authors' adherence to all the PLOS ONE policies on sharing data and materials, as detailed online in the guide for authors.

Figures

Fig 1
Fig 1. Association between current cigarette smoking and Parkinson’s disease.
The natural logarithm of the estimated relative risk [ln(RR)] and the 95% confidence interval for each study are displayed. Current smokers have a significantly greater or lower risk of PD than non-smokers if the horizontal line for the study is to the right or to the left, respectively, of the bold vertical line [ln(RR) = 0] and does not cross it. PD risk for current smokers is similar to that in non-smokers if the horizontal line for the study crosses the bold vertical axis. An asterisk (*) denotes RR estimates that are not included in the meta-analysis due to study overlap with another RR estimate shown in the figure. RR = relative risk, LCL = lower limit of the 95% confidence interval, UCL = upper limit of the 95% confidence interval, HPFS = Health Professionals Follow-Up Study, M & F = males and females, NHS = Nurses’ Health Study, PD = Parkinson’s disease. Citations for studies appearing in this figure can be found here: [, , , –95].
Fig 2
Fig 2. Association between the heavy or long-term cigarette smoking and Parkinson’s disease.
The natural logarithm of the estimated relative risk [ln(RR)] and the 95% confidence interval for each study are displayed (see the legend for Fig 1 for instructions on how to interpret forest plots). An asterisk (*) denotes RR estimates that are not included in the meta-analysis due to study overlap with another RR estimate shown in the figure. RR = relative risk, LCL = lower limit of the 95% confidence interval, UCL = upper limit of the 95% confidence interval, M & F = males and females, PD = Parkinson’s disease. Citations for studies appearing in this figure can be found here: [, , –, –, , , , , , , , , –, , , , –111].
Fig 3
Fig 3. Association between rural living and Parkinson’s disease.
The natural logarithm of the estimated relative risk [ln(RR)] and the 95% confidence interval for each study are displayed (see the legend for Fig 1 for instructions on how to interpret forest plots). RR = relative risk, LCL = lower limit of the 95% confidence interval, UCL = upper limit of the 95% confidence interval. Citations for studies appearing in this figure can be found here: [, , , , , , –, , , –130].
Fig 4
Fig 4. Association between well-water consumption and Parkinson’s disease.
The natural logarithm of the estimated relative risk [ln(RR)] and the 95% confidence interval for each study are displayed (see the legend for Fig 1 for instructions on how to interpret forest plots). An asterisk (*) denotes RR estimates that are not included in the meta-analysis due to study overlap with another RR estimate shown in the figure. RR = relative risk, LCL = lower limit of the 95% confidence interval, UCL = upper limit of the 95% confidence interval, PD = Parkinson’s disease. Citations for studies appearing in this figure can be found here: [, , , , , , , , , , , , , , , –137].
Fig 5
Fig 5. Association between farming and Parkinson’s disease.
The natural logarithm of the estimated relative risk [ln(RR)] and the 95% confidence interval for each study are displayed (see the legend for Fig 1 for instructions on how to interpret forest plots). An asterisk (*) denotes RR estimates that are not included in the meta-analysis due to study overlap with another RR estimate shown in the figure. RR = relative risk, LCL = lower limit of the 95% confidence interval, UCL = upper limit of the 95% confidence interval, M & F = males and females. Citations for studies appearing in this figure can be found here: [, , , –, , , –, , , , , , –, , , , , –, , , –156].
Fig 6
Fig 6. Association between pesticide use and Parkinson’s disease.
The natural logarithm of the estimated relative risk [ln(RR)] and the 95% confidence interval for each study are displayed (see the legend for Fig 1 for instructions on how to interpret forest plots). An asterisk (*) denotes RR estimates that are not included in the meta-analysis due to study overlap with another RR estimate shown in the figure. RR = relative risk, LCL = lower limit of the 95% confidence interval, UCL = upper limit of the 95% confidence interval. Citations for studies appearing in this figure can be found here: [, , –, –, , –, , , , , , , , , , –, , , , –, , –, –, , –, –158].
Fig 7
Fig 7. Association between herbicide (Panel a), fungicide (Panel b) or insecticide use (Panel c) and Parkinson’s disease.
The natural logarithm of the estimated relative risk [ln(RR)] and the 95% confidence interval for each study are displayed (see the legend for Fig 1 for instructions on how to interpret forest plots). RR = relative risk, LCL = lower limit of the 95% confidence interval, UCL = upper limit of the 95% confidence interval. Citations for studies appearing in this figure can be found here: [, , , , , , , , , , , , , , , , –158].
Fig 8
Fig 8. Association between high herbicide (Panel a), high fungicide (Panel b) or high insecticide use (Panel c) and Parkinson’s disease.
The natural logarithm of the estimated relative risk [ln(RR)] and the 95% confidence interval for each study are displayed (see the legend for Fig 1 for instructions on how to interpret forest plots). RR = relative risk, LCL = lower limit of the 95% confidence interval, UCL = upper limit of the 95% confidence interval. Citations for studies appearing in this figure can be found here: [55, 81, 98, 115, 121, 130, 135, 143, 150].
Fig 9
Fig 9. Association between ever use (Panel a) or high use (Panel b) of paraquat and Parkinson’s disease.
The natural logarithm of the estimated relative risk [ln(RR)] and the 95% confidence interval for each study are displayed (see the legend for Fig 1 for instructions on how to interpret forest plots). An asterisk (*) denotes RR estimates that are not included in the meta-analysis due to study overlap with another RR estimate shown in the figure. RR = relative risk, LCL = lower limit of the 95% confidence interval, UCL = upper limit of the 95% confidence interval. Citations for studies appearing in this figure can be found here: [, , , , , , , , , , , , , –165].

Similar articles

Cited by

References

    1. Parkinson J. An essay on the shaking palsy. J Neuropsychiatry Clin Neurosci. 2002;14(2):223–36. Epub 2002/05/02. . - PubMed
    1. Braak H, Ghebremedhin E, Rub U, Bratzke H, Del Tredici K. Stages in the development of Parkinson's disease-related pathology. Cell Tissue Res. 2004;318(1):121–34. Epub 2004/09/01. 10.1007/s00441-004-0956-9 . - DOI - PubMed
    1. Ascherio A, Weisskopf MG, O'Reilly EJ, McCullough ML, Calle EE, Rodriguez C, et al. Coffee consumption, gender, and Parkinson's disease mortality in the cancer prevention study II cohort: the modifying effects of estrogen. Am J Epidemiol. 2004;160(10):977–84. Epub 2004/11/04. 10.1093/aje/kwh312 . - DOI - PubMed
    1. Klein C. Genetics of Parkinson's disease—An overview In: Fahn S, Lang AE, Schapira AHV, editors. Movement Disorders 4 Philadelphia: Saunders/Elsevier; 2010. p. 15–39.
    1. Martin I, Dawson VL, Dawson TM. The impact of genetic research on our understanding of Parkinson's disease. Prog Brain Res. 2010;183:21–41. Epub 2010/08/11. 10.1016/s0079-6123(10)83002-x . - DOI - PMC - PubMed

Grants and funding

This project was supported by a grant from Syngenta Crop Protection, LLC. Syngenta paid hourly fees for the time spent by the following co-authors of the study: Drs. Jack S. Mandel (JSM), Sir Colin Berry (CB), Ellen T. Chang (ETC), and Robert L. Sielken, Jr. (RLS). Dr. Charles B. Breckenridge (CBB), who is an employee of Syngenta, received annual compensation in the form of salary and company benefits, however Syngenta did not have any additional role in the study design, data collection and analysis, decision to publish, or preparation of the manuscript. Exponent, Inc. and Sielken & Associates Consulting, Inc. provided support in the form of salaries for authors ETC, JSM, and RLS, but did not have any additional role in the study design, data collection and analysis, decision to publish, or preparation of the manuscript. The specific roles of these authors are articulated in the ‘author contributions’ section.