Fresh Fruit Consumption and Major Cardiovascular Disease in China
- PMID: 27050205
- PMCID: PMC4896382
- DOI: 10.1056/NEJMoa1501451
Fresh Fruit Consumption and Major Cardiovascular Disease in China
Abstract
Background: In Western populations, a higher level of fruit consumption has been associated with a lower risk of cardiovascular disease, but little is known about such associations in China, where the consumption level is low and rates of stroke are high.
Methods: Between 2004 and 2008, we recruited 512,891 adults, 30 to 79 years of age, from 10 diverse localities in China. During 3.2 million person-years of follow-up, 5173 deaths from cardiovascular disease, 2551 incident major coronary events (fatal or nonfatal), 14,579 ischemic strokes, and 3523 intracerebral hemorrhages were recorded among the 451,665 participants who did not have a history of cardiovascular disease or antihypertensive treatments at baseline. Cox regression yielded adjusted hazard ratios relating fresh fruit consumption to disease rates.
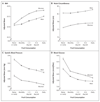
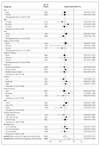
Results: Overall, 18.0% of participants reported consuming fresh fruit daily. As compared with participants who never or rarely consumed fresh fruit (the "nonconsumption" category), those who ate fresh fruit daily had lower systolic blood pressure (by 4.0 mm Hg) and blood glucose levels (by 0.5 mmol per liter [9.0 mg per deciliter]) (P<0.001 for trend for both comparisons). The adjusted hazard ratios for daily consumption versus nonconsumption were 0.60 (95% confidence interval [CI], 0.54 to 0.67) for cardiovascular death, and 0.66 (95% CI, 0.58 to 0.75), 0.75 (95% CI, 0.72 to 0.79), and 0.64 (95% CI, 0.56 to 0.74), respectively, for incident major coronary events, ischemic stroke, and hemorrhagic stroke. There was a strong log-linear dose-response relationship between the incidence of each outcome and the amount of fresh fruit consumed. These associations were similar across the 10 study regions and in subgroups of participants defined by baseline characteristics.
Conclusions: Among Chinese adults, a higher level of fruit consumption was associated with lower blood pressure and blood glucose levels and, largely independent of these and other dietary and nondietary factors, with significantly lower risks of major cardiovascular diseases. (Funded by the Wellcome Trust and others.).
Conflict of interest statement
Disclosure forms provided by the authors are available with the full text of this article at NEJM.org.
Figures


Comment in
-
Fruit Consumption and Cardiovascular Disease in China.N Engl J Med. 2016 Aug 4;375(5):489. doi: 10.1056/NEJMc1606624. N Engl J Med. 2016. PMID: 27518673 No abstract available.
-
Fruit Consumption and Cardiovascular Disease in China.N Engl J Med. 2016 Aug 4;375(5):487-8. doi: 10.1056/NEJMc1606624. N Engl J Med. 2016. PMID: 27518674 No abstract available.
-
Fruit Consumption and Cardiovascular Disease in China.N Engl J Med. 2016 Aug 4;375(5):488. doi: 10.1056/NEJMc1606624. N Engl J Med. 2016. PMID: 27518675 No abstract available.
-
Fruit Consumption and Cardiovascular Disease in China.N Engl J Med. 2016 Aug 4;375(5):488. doi: 10.1056/NEJMc1606624. N Engl J Med. 2016. PMID: 27518676 No abstract available.
Similar articles
-
Fresh fruit consumption in relation to incident diabetes and diabetic vascular complications: A 7-y prospective study of 0.5 million Chinese adults.PLoS Med. 2017 Apr 11;14(4):e1002279. doi: 10.1371/journal.pmed.1002279. eCollection 2017 Apr. PLoS Med. 2017. PMID: 28399126 Free PMC article.
-
Fresh fruit consumption and all-cause and cause-specific mortality: findings from the China Kadoorie Biobank.Int J Epidemiol. 2017 Oct 1;46(5):1444-1455. doi: 10.1093/ije/dyx042. Int J Epidemiol. 2017. PMID: 28449053 Free PMC article.
-
Fruit consumption and physical activity in relation to all-cause and cardiovascular mortality among 70,000 Chinese adults with pre-existing vascular disease.PLoS One. 2017 Apr 12;12(4):e0173054. doi: 10.1371/journal.pone.0173054. eCollection 2017. PLoS One. 2017. PMID: 28403155 Free PMC article.
-
Associations of egg consumption with cardiovascular disease in a cohort study of 0.5 million Chinese adults.Heart. 2018 Nov;104(21):1756-1763. doi: 10.1136/heartjnl-2017-312651. Epub 2018 May 21. Heart. 2018. PMID: 29785957 Free PMC article.
-
Effects of a gluten-reduced or gluten-free diet for the primary prevention of cardiovascular disease.Cochrane Database Syst Rev. 2022 Feb 24;2(2):CD013556. doi: 10.1002/14651858.CD013556.pub2. Cochrane Database Syst Rev. 2022. PMID: 35199850 Free PMC article. Review.
Cited by
-
The association between childhood conditions and heart disease among middle-aged and older population in China: a life course perspective.BMC Geriatr. 2021 Mar 17;21(1):184. doi: 10.1186/s12877-021-02134-9. BMC Geriatr. 2021. PMID: 33731011 Free PMC article.
-
Association between sleep duration and hypertension in southwest China: a population-based cross-sectional study.BMJ Open. 2022 Jun 27;12(6):e052193. doi: 10.1136/bmjopen-2021-052193. BMJ Open. 2022. PMID: 35760551 Free PMC article.
-
Association of vitamin K with cardiovascular events and all-cause mortality: a systematic review and meta-analysis.Eur J Nutr. 2019 Sep;58(6):2191-2205. doi: 10.1007/s00394-019-01998-3. Epub 2019 May 22. Eur J Nutr. 2019. PMID: 31119401
-
Fresh fruit consumption may decrease the long-term risk of esophageal cancer mortality: A 30-year follow-up study in the Linxian Dysplasia Nutrition Intervention trial (NIT).Thorac Cancer. 2020 Jul;11(7):1918-1926. doi: 10.1111/1759-7714.13482. Epub 2020 May 29. Thorac Cancer. 2020. PMID: 32469462 Free PMC article.
-
Anthocyanins, Anthocyanin-Rich Berries, and Cardiovascular Risks: Systematic Review and Meta-Analysis of 44 Randomized Controlled Trials and 15 Prospective Cohort Studies.Front Nutr. 2021 Dec 15;8:747884. doi: 10.3389/fnut.2021.747884. eCollection 2021. Front Nutr. 2021. PMID: 34977111 Free PMC article.
References
-
- Yusuf S, Hawken S, Ounpuu S, et al. Effect of potentially modifiable risk factors associated with myocardial infarction in 52 countries (the INTERHEART study): case-control study. Lancet. 2004;364:937–52. - PubMed
-
- Abegunde DO, Mathers CD, Adam T, Ortegon M, Strong K. The burden and costs of chronic diseases in low-income and middle-income countries. Lancet. 2007;370:1929–38. - PubMed
-
- Oude Griep LM, Verschuren WM, Kromhout D, Ocké MC, Geleijnse JM. Raw and processed fruit and vegetable consumption and 10-year stroke incidence in a population-based cohort study in the Netherlands. Eur J Clin Nutr. 2011;65:791–9. - PubMed
Publication types
MeSH terms
Substances
Grants and funding
LinkOut - more resources
Full Text Sources
Other Literature Sources
Medical
Research Materials
