. 2016 Apr 21;532(7599):334-9.
doi: 10.1038/nature17629. Epub 2016 Apr 6.

X-ray structures and mechanism of the human serotonin transporter

Affiliations

X-ray structures and mechanism of the human serotonin transporter

Jonathan A Coleman et al. Nature. .

Abstract

The serotonin transporter (SERT) terminates serotonergic signalling through the sodium- and chloride-dependent reuptake of neurotransmitter into presynaptic neurons. SERT is a target for antidepressant and psychostimulant drugs, which block reuptake and prolong neurotransmitter signalling. Here we report X-ray crystallographic structures of human SERT at 3.15 Å resolution bound to the antidepressants (S)-citalopram or paroxetine. Antidepressants lock SERT in an outward-open conformation by lodging in the central binding site, located between transmembrane helices 1, 3, 6, 8 and 10, directly blocking serotonin binding. We further identify the location of an allosteric site in the complex as residing at the periphery of the extracellular vestibule, interposed between extracellular loops 4 and 6 and transmembrane helices 1, 6, 10 and 11. Occupancy of the allosteric site sterically hinders ligand unbinding from the central site, providing an explanation for the action of (S)-citalopram as an allosteric ligand. These structures define the mechanism of antidepressant action in SERT, and provide blueprints for future drug design.


Conflict of interest statement

The authors declare no competing financial interests. Readers are welcome to comment on the online version of the paper.

Figures
Extended Data Figure 1
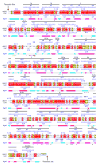
Extended Data Figure 1. Construct design and secondary structure
Thrombin digestion sites were introduced within the N- and C-terminal regions before Q76 and after T618. Mutations which were introduced to increase thermostability (Y110A, I291A, T439S) are indicated (red star). Surface exposed cysteines were mutated to alanine (C554, C580) and indicated with a blue star. Residues which have no electron density are boxed in green. Secondary structure was analyzed using DSSP (http://swift.cmbi.ru.nl/gv/dssp/ ) and displayed using ENDScript (http://endscript.ibcp.fr/). Secondary structure elements are shown using the following symbols: α-helix (α), β-strand (β), π-helix (π), 310 helix (η), β-turn (TT letters), α-turn (TTT letters). Locations of carbohydrate (red, “) and disulfide bonding cysteine (green digits) residues are also shown. A–C in italic means the residue has a crystallographic contact with a residue in Chain A–C. The ‘#’ symbol identifies a contact between two residues along the crystallographic 2-fold axis of symmetry. Contacts between transporter residues and small molecules in the range of 3.2–5.0 Å are also indicated (black, “). Hydropathy is calculated according to Kyte & Doolittle and shown with pink as hydrophobic (H > 1.5), cyan as hydrophilic (H < 1.5), and grey as intermediate. The secondary structure of the dopamine transporter (4M48) is shown for comparison.
Extended Data Figure 2
Extended Data Figure 2. Comparison of the ts3 and ts2 structures, crystal packing and antibody structure
a, Superposition of the ts2 (blue) and ts3 (grey) transporters, each in complex with paroxetine using all atoms (Extended Data Table 3). Paroxetine (pink sticks) and thermostabilizing mutations (yellow spheres). b, Position of amino acid changes due to single nucleotide polymorphisms and mutants associated with psychiatric disorders (yellow). Paroxetine is shown in pink. c, SERT is shown in green, Fab heavy chain (orange), light chain (blue). SERT molecules pack into the crystal lattice with SERT-SERT interface occurring along the kink of TM12 helices related by the crystallographic 2-fold axis (blue box). d, Rotation by 90° reveals further lattice contacts. Red box shows interface between Fab, EL2, and EL4. We predict that this interface contains the high-affinity interaction of the Fab with EL2 and EL4. Also shown is a EL2-EL2 interaction between symmetry related molecules as well as a Fab-EL2 interface in the asymmetric unit. Purple box shows interface between Fab variable domains. Black box shows crystal contact between the C-terminal helix and the Fab constant domain. e, The binding site of the 8B6 Fab is made up of interactions of residues from EL2 and EL4 (sticks). f, Comparison of the high resolution Fab structure (grey) with SERT-bound Fab (Extended Data Table 3). The largest structural changes occur in the complementary determining regions (CDRs).
Extended Data Figure 3
Extended Data Figure 3. Comparison of ligand binding in SERT and in DAT
a, Comparison of SERT bound to paroxetine with dDAT (4M48) bound to nortriptyline (yellow); superposition based on TMs 1–12. SERT is shown in blue and DAT in grey. b, Alignment of paroxetine (blue) and (S)-citalopram (pink) structures using all atoms in superposition (Extended Data Table 3). Residues interacting with the antidepressant molecules are shown as sticks. Paroxetine (pink) and (S)-citalopram (green) are shown as sticks. c, Insertion of benzodioxol and fluorophenyl groups of paroxetine and (S)-citalopram into a cavity in subsite B made up of L443, A169, A173, and S439. Note that Ser439 is equivalent to Thr439 in wild-type SERT. Equivalent residues in dDAT are shown in grey.
Extended Data Figure 4
Extended Data Figure 4. Ion binding sites
a, Overall view of the Na1 and Cl ion binding sites in the paroxetine bound transporter. Na+ (salmon) and Cl (green) are shown as spheres. Paroxetine is shown as pink sticks. b, Overall view of the (S)-citalopram bound transporter showing the Na2 binding site; (S)-citalopram (green sticks). c, Residues coordinating Na1 and Cl. Ion Fo-Fc omit densities are shown at 2σ and 3σ for Na1 and Cl. d, Residues coordinating Na2. Fo-Fc omit density is shown at 4σ. A water molecule is shown as a yellow sphere. Coordination distances are given in Extended Data Table 4.
Extended Data Figure 5
Extended Data Figure 5. Extracellular and intracellular gates and the allosteric site of paroxetine and partially occupied (S)-citalopram
a, The extracellular gate of the SERT-(S)-citalopram complex is shown, with (S)-citalopram bound to the central site. The width of the gate is depicted by the distances between Y176 and F335 (10.3 Å, CD1-CE2), D98 and Y176 (4.0 Å, OD2-OH), E494 and R104 (4.9 Å, OE1-NH1) dDAT (grey) is shown for comparison. b, Comparison of the intracellular gate of SERT (pink) vs. DAT (4M48, grey). Superpositions were made by alignment of TMs 1–12 of SERT with dDAT. c, The allosteric site containing fully occupied (S)-citalopram (pink) was superposed with the partially occupied structure (olive). The Fo-Fc omit density (blue mesh) of the partially occupied structure is shown at 2σ. (S)-citalopram is shown in green sticks. A 12-carbon chain (magenta) was modeled into this density but could instead represent a partially occupied (S)-citalopram. The structure with partial (S)-citalopram occupancy at the allosteric site was derived from crystals grown in the presence of 10 μM ligand. Crystals with a higher occupancy at the allosteric site were soaked in a solution containing 5 mM (S)-citalopram prior to crystal cryo protection. d, The paroxetine-bound transporter contains a maltose detergent headgroup (orange) bound to the allosteric site. Fo-Fc maltose omit density at 3σ.
Extended Data Figure 6
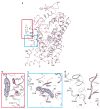
Extended Data Figure 6. Cholesteryl hemisuccinate and tetradecane binding sites
a, Overall view of the (S)-citalopram-bound structure showing cholesteryl hemisuccinate (CHS, red box) and tetradecane (C14, blue box). b, Zoomed view of the CHS binding site. Residues near CHS are shown as sticks. The Fo-Fc omit density map is shown at 3σ. c, Binding of tetradecane. The Fo-Fc omit density map is contoured at 4σ. d, Tetradecane was modeled on a 2-fold axis of symmetry with partial occupancy as a single molecule. Based on the density, it is unclear if this molecule represents the alkyl chain of a lipid, detergent, or a molecule of PEG.
Figure 1
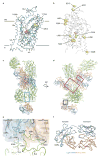
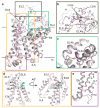
Figure 1. Function and architecture of the human serotonin transporter
a, Michaelis-Menten plots of serotonin (5-HT) uptake by wild-type (black, circles), ts2 (blue, squares), and ts3 (red, triangles) transporters. Graph depicts an average of three independent experiments, each performed with triplicate measurements (error bars represent s.e.m.). b, Structure of SERT viewed parallel to the membrane. (S)-citalopram molecules (central) and (allosteric) are shown as sticks in dark green and cyan, respectively. Sodium ions are shown as spheres in salmon. Cholesteryl hemisuccinate (CHS) and N-acetylglucosamine (NAG) are shown as sticks. c, View of SERT from the extracellular side of the membrane.
Figure 2
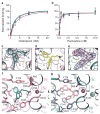
Figure 2. Antidepressant binding and recognition
a, Graph of [3H](R/S)-citalopram saturation binding to wild-type (black, circles), ts2 (blue, squares), and ts3 (red, triangles) transporters, showing the average of two independent experiments, each performed in triplicate (error bars represent s.e.m.). b, Plot of a [3H]-paroxetine saturation binding from a representative experiment (error bars represent s.e.m. from triplicate measurements). c, Fo-Fc omit (S)-citalopram electron density (blue mesh), contoured at 3σ. The approximate positions of subsites A, B, C are shown. d, Anomalous difference electron density (green mesh), derived from Br-citalopram (yellow sticks) bound to the central site is shown (8.0σ contour level). e, Fo-Fc omit electron density for paroxetine, contoured at 3σ. f, Interactions of (S)-citalopram (dark green) in the central binding site. g, Interactions of paroxetine (pink) with residues in the central binding site.
Figure 3
Figure 3. Allosteric site
a, Sagittal slice through a surface representation of the (S)-citalopram-bound transporter. (S)-citalopram molecules bound to the allosteric (cyan) and central (green) sites are shown as spheres. b, A maltose headgroup (orange), derived from a detergent molecule and bound to the allosteric site, and paroxetine (pink), bound to the central site, are shown as spheres.
Figure 4
Figure 4. Structural basis of allosteric regulation
a, Dissociation of [3H](R/S)-citalopram in the presence of buffer containing 100 μM (S)-citalopram (circles) or without ligand (squares). A representative experiment is shown (error bars represent s.e.m. from triplicate measurements). b, Allosteric site bound with (S)-citalopram (cyan). Residues in close proximity to (S)-citalopram are shown as sticks. A few atoms of (S)-citalopram at the central site (green sticks) are visible ‘below’ the (S)-citalopram molecule bound to the allosteric site. Fo-Fc omit density of (S)-citalopram (blue mesh) in the allosteric site is shown (1.5σ contour level). c, Anomalous difference electron density (green mesh), derived from a Br-citalopram (yellow sticks) diffraction data set, is contoured at 5σ. d, Alignment of the allosteric site of the paroxetine (blue) and (S)-citalopram-bound (pink) structures. Maltose is in orange sticks. Superposition was performed over all Cα atoms of the transporter.
Figure 5
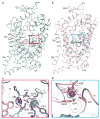
Figure 5. Comparison of serotonin and dopamine transporters
a, Overall alignment of SERT (pink) vs. dDAT (grey) using TMs 1–12; regions in SERT with structural differences are boxed. (S)-citalopram bound to the central (green) and allosteric (cyan) sites shown as sticks. b, Close up view of EL2, N-acetylglucosamine (NAG; SERT) and the disulfide bridge between C200 and C209 are shown as sticks. c, View of EL4. d, Structural differences at the SERT allosteric site showing TMs 9, 10, 11, 12, EL6, and IL4. e, Conformation of the C-terminal helix and IL1. R152 of SERT is in sticks.
Figure 6
Figure 6. Allosteric modulation of inhibitor binding
a, The SSRI (S)-citalopram (dark green) binds to the central site by wedging between scaffold helices 3, 8, and 10 and core helices 1 and 6. Sodium and chloride ions are shown as salmon and green spheres. b, (S)-citalopram (cyan) binds to the allosteric site made up of TMs 1b, 6a, 10, 11, EL4, and EL6. Binding to the allosteric site prevents dissociation from the central site.

Comment in

Similar articles

Cited by

References

    1. Berger M, Gray JA, Roth BL. The expanded biology of serotonin. Annu Rev Med. 2009;60:355–366. - PMC - PubMed
    1. Rapport MM, Green AA, Page IH. Serum vasoconstrictor, serotonin; isolation and characterization. J Biol Chem. 1948;176:1243–1251. - PubMed
    1. Blackburn KJ, French PC, Merrills RJ. 5-hydroxytryptamine uptake by rat brain in vitro. Life Sci. 1967;6:1653–1663. - PubMed
    1. Carlsson A, Fuxe K, Ungerstedt U. The effect of imipramine on central 5-hydroxytryptamine neurons. J Pharm Pharmacol. 1968;20:150–151. - PubMed
    1. Glowinski J, Axelrod J. Inhibition of uptake of tritiated-noradrenaline in the intact rat brain by imipramine and structurally related compounds. Nature. 1964;204:1318–1319. - PubMed

Publication types

MeSH terms