. 2016 Jun;17(6):666-676.
doi: 10.1038/ni.3412. Epub 2016 Apr 4.

Distinct myeloid progenitor-differentiation pathways identified through single-cell RNA sequencing

Affiliations

Distinct myeloid progenitor-differentiation pathways identified through single-cell RNA sequencing

Roy Drissen et al. Nat Immunol. 2016 Jun.

Abstract

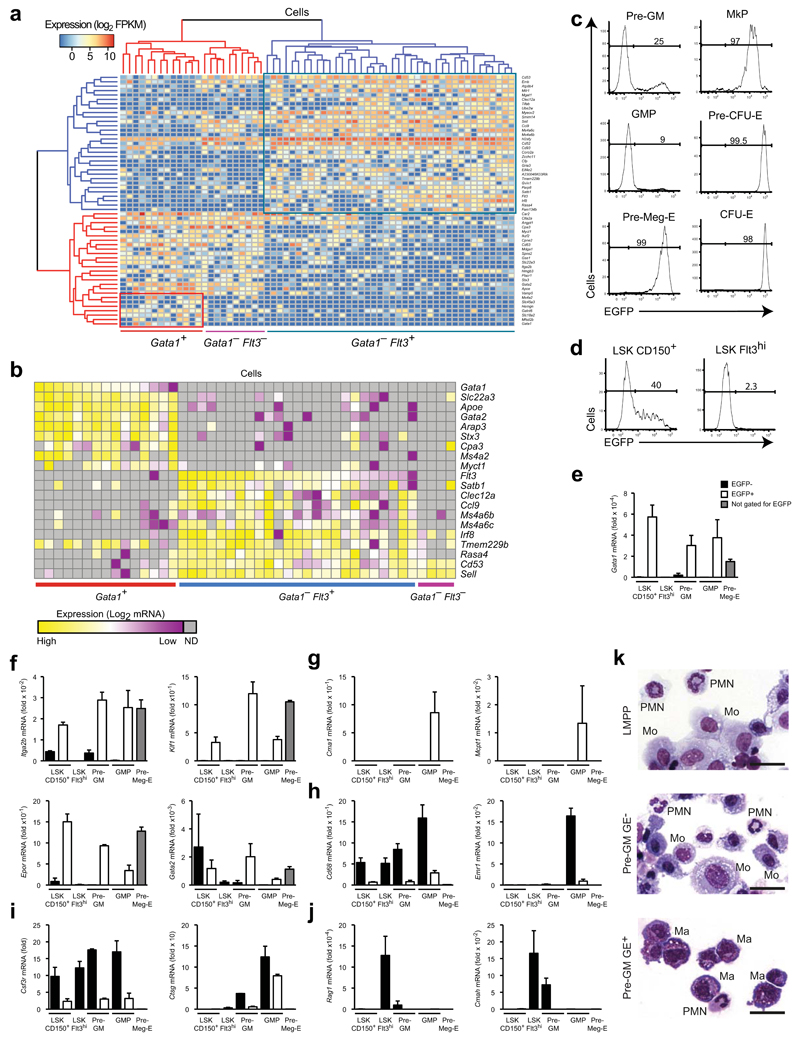
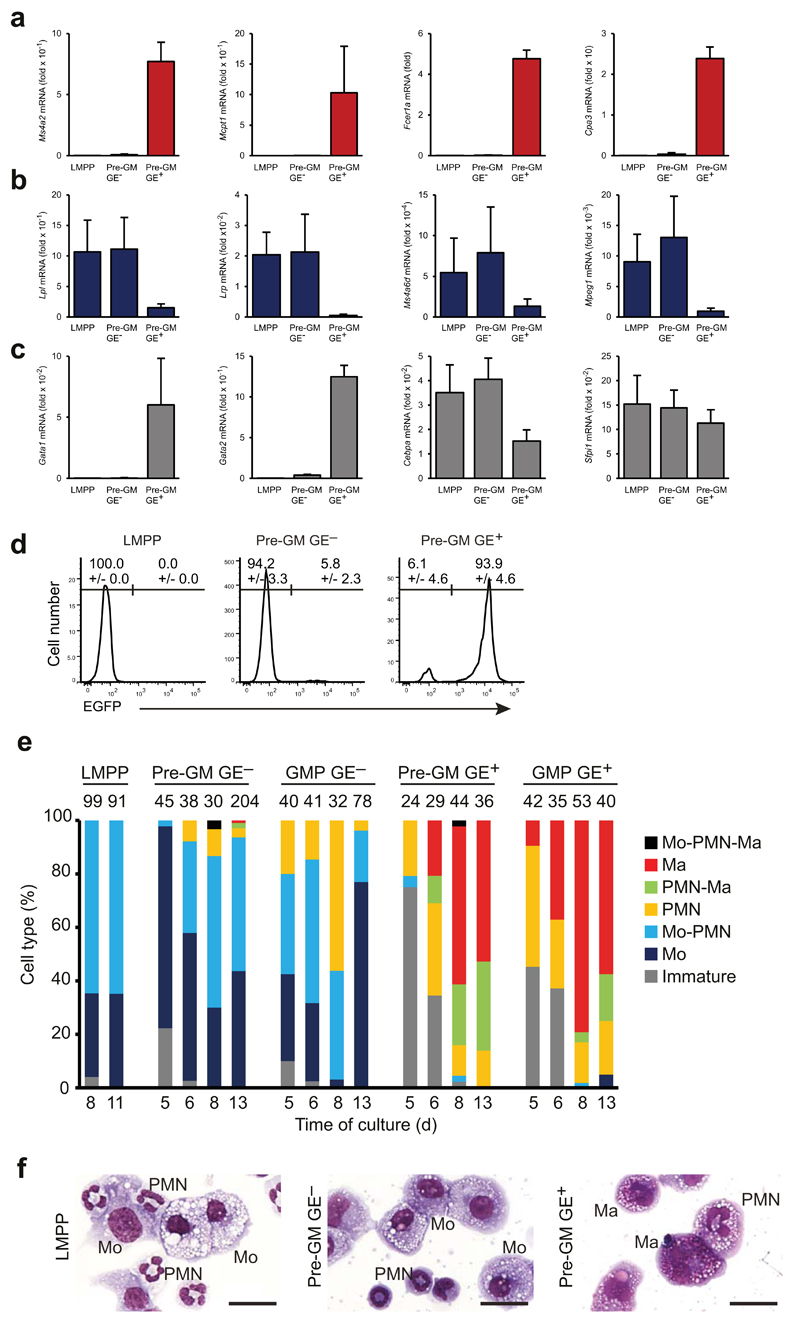
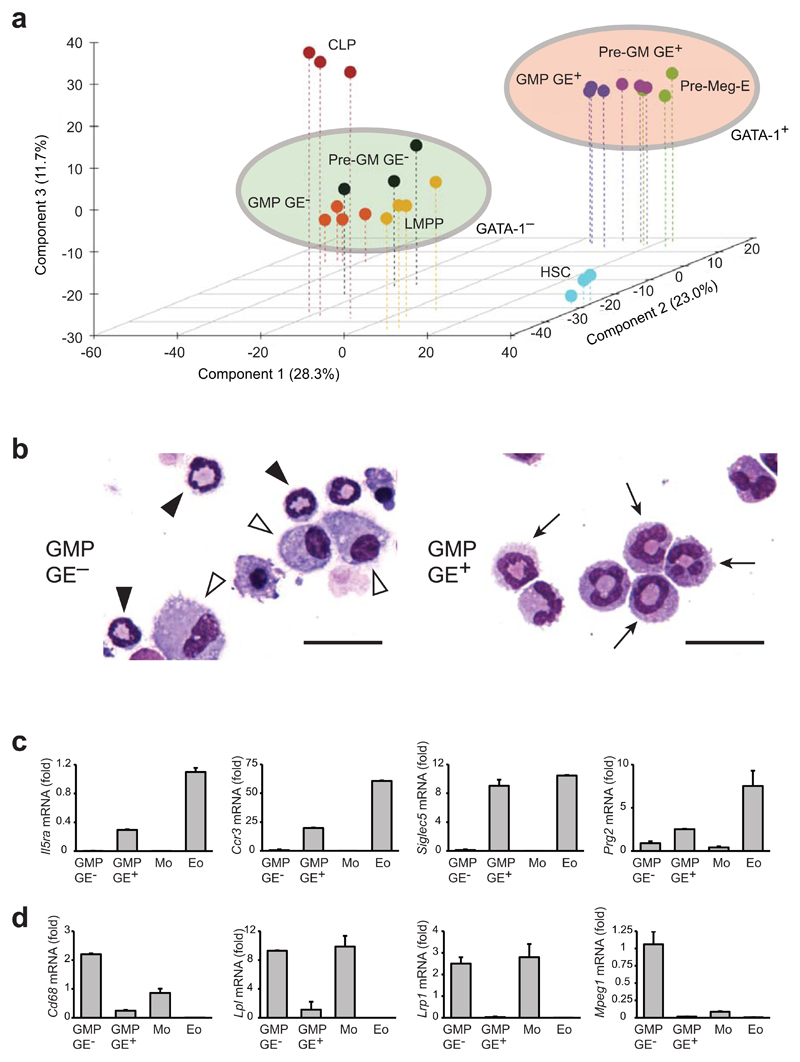
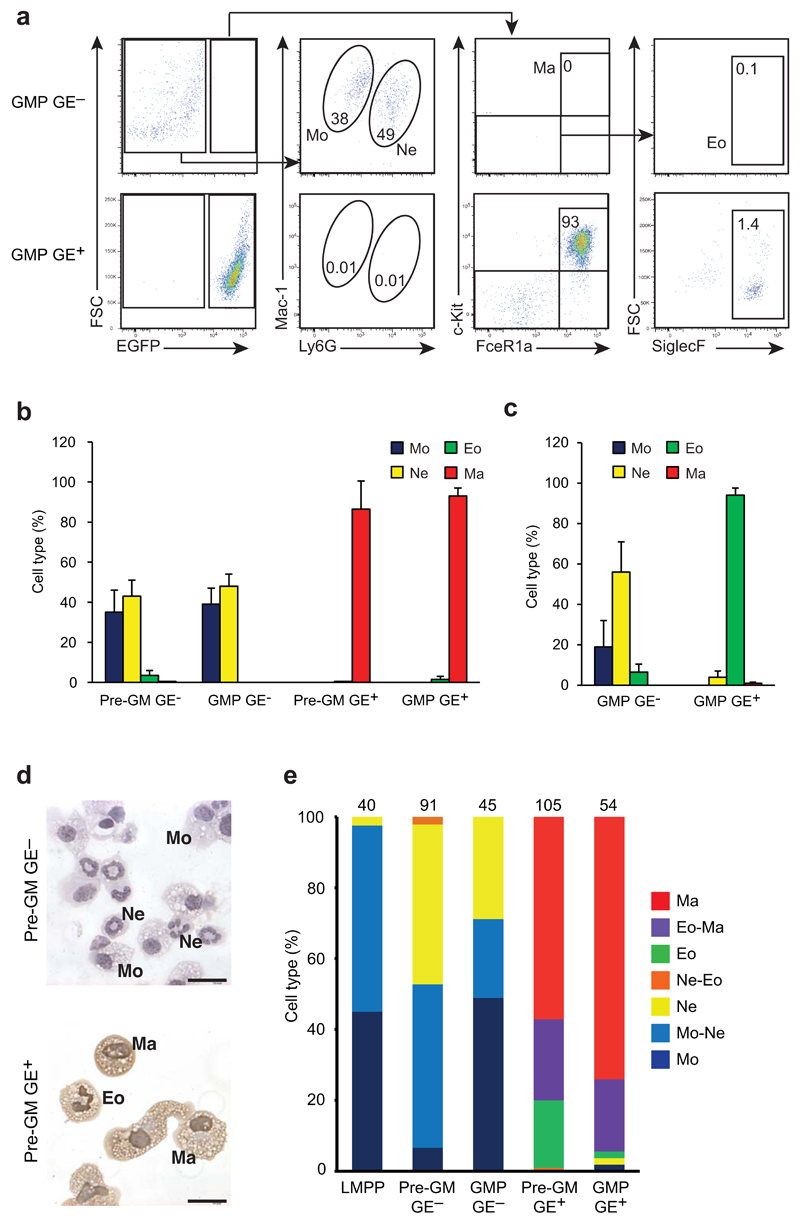
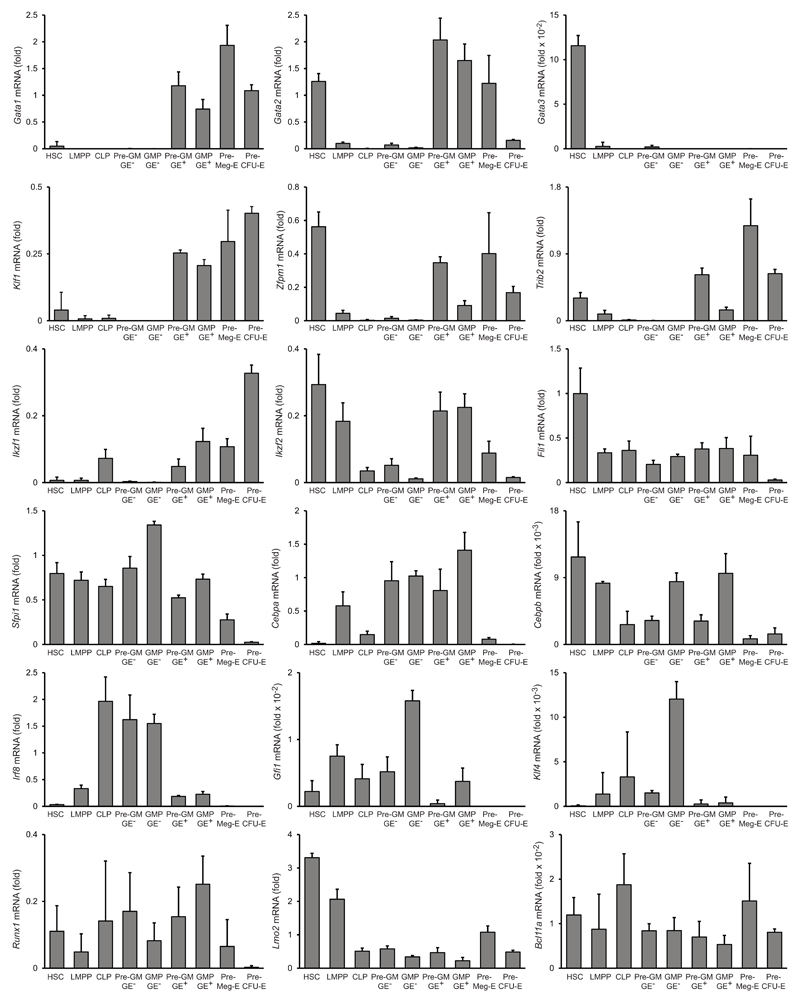
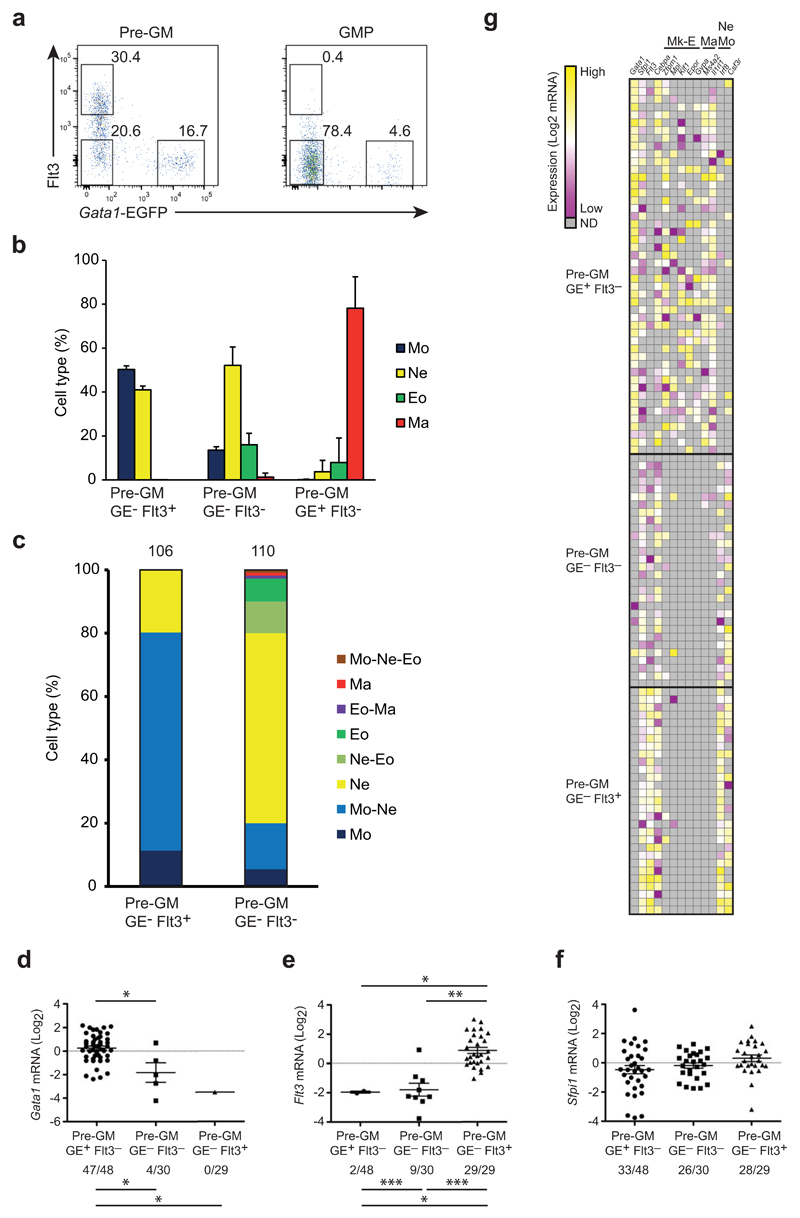
According to current models of hematopoiesis, lymphoid-primed multi-potent progenitors (LMPPs) (Lin(-)Sca-1(+)c-Kit(+)CD34(+)Flt3(hi)) and common myeloid progenitors (CMPs) (Lin(-)Sca-1(+)c-Kit(+)CD34(+)CD41(hi)) establish an early branch point for separate lineage-commitment pathways from hematopoietic stem cells, with the notable exception that both pathways are proposed to generate all myeloid innate immune cell types through the same myeloid-restricted pre-granulocyte-macrophage progenitor (pre-GM) (Lin(-)Sca-1(-)c-Kit(+)CD41(-)FcγRII/III(-)CD150(-)CD105(-)). By single-cell transcriptome profiling of pre-GMs, we identified distinct myeloid differentiation pathways: a pathway expressing the gene encoding the transcription factor GATA-1 generated mast cells, eosinophils, megakaryocytes and erythroid cells, and a pathway lacking expression of that gene generated monocytes, neutrophils and lymphocytes. These results identify an early hematopoietic-lineage bifurcation that separates the myeloid lineages before their segregation from other hematopoietic-lineage potential.


Conflict of interest statement

statement. The authors have no competing financial interests.

Figures

Figure 1
Figure 1. Gata1 expression identifies distinct myeloid progenitor subsets.
(a) Hierarchical clustering of single pre-GM cells using the gene set from Supplementary Figure 1b. The major molecularly distinct cell clusters are labeled according to Gata1 and Flt3 expression. (b) Heatmap showing expression of genes selectively expressed between the 3 clusters from (a) in single pre-GMs. Expression values were normalized to Hprt expression and shown as deviation from mean expression value of each individual gene. Cells were grouped according to descending Gata1 and Flt3 expression. (c) EGFP expression in pre-GM, GMP, pre-Meg-E, MkP, pre-CFU-E and CFU-E populations from Gata1-EGFPtg/+ adult bone marrow. The percentage of EGFP positive cells is indicated. Gates were set based on wild type cells. Gating strategy for the populations is depicted in Supplementary Figure 1d. (d) EGFP expression in LSKCD150+Flt3 and LSKFlt3hi cells. Gating strategy for populations is depicted in Supplementary Figure 1e. (e-j) Quantitative PCR analysis of mRNA expression relative to Hprt of Gata1 (e), genes associated with megakaryocytes/erythrocytes (f), mast cells (g), monocytes-macrophages (h), neutrophils (i) and lymphoid cells (j) in purified stem- and progenitor populations. (k) Representative morphology of cells from day 8 of cultures of LMPPs, pre-GMs GE- and pre-GMs GE+. Monocytes (Mo), polymorphonuclear granulocytes (PMN), and mast cells (Ma) are indicated. Scale bars: 25μm. Analysis representative of 20 (c) and 5 (d) independent experiments is shown. Gene expression is mean ± s.e.m, n=3 biological replicates, except n=2 for pre-GM EGFP- (e-j).
Figure 2
Figure 2. GE- and GE+ progenitor cells have distinct myeloid lineage potentials.
(a-c) Total cell populations produced from LMPPs, pre-GM GE- and pre-GM GE+ progenitors after 8 days of culture were analyzed by quantitative-PCR for expression of genes associated with mast cells (a), monocytes-macrophages (b) and for myeloid-erythroid transcription factors (c). Gene expression is presented relative to Ubc expression. (d) LMPP, pre-GM GE- and pre-GM GE+ populations were cultured for 3 days with mSCF and mIL-3, allowing the cells to reach a GMP stage, as defined by FcγRII/III expression. Histograms show EGFP expression of in vitro derived FcγRII/III+ cells from indicated progenitor populations. Percentages of EGFP negative and positive cells are indicated. (e) Cell type analysis by morphology of cytospins from single cell cultured LMPPs, GE- and GE+ pre-GMs and GMPs, shown as frequency of analyzed clones (numbers on top of bars). Time of culture is indicated in days. Clones were scored as immature only if no differentiated cell type was found. Mo: monocyte, PMN: Polymorphonuclear granulocytes, Ma: mast cell. (f) Morphology of representative mixed lineage clones from cultured single progenitors. Monocytes (Mo), polymorphonuclear granulocytes (PMN), and mast cells (Ma) are indicated. Scale bars: 25μm. Gene expression is mean ±SD, n=6 biological replicates (a,b,c). EGFP expression is mean ±SD, n=2 and n=7 biological replicates for LMPP and pre-GMs respectively (d). Data from (e) is representative for 6 independent experiments.
Figure 3
Figure 3. Identification of lineage potentials associated with the Gata1-expressing and non-expressing myeloid pathways.
(a) Principal component analysis of hematopoietic stem/progenitor cell populations. Gene expression profiles were generated for each cell population using Affymetrix MoGene 1.0 arrays. Genes differentially expressed across the entire experiment (ANOVA P<0.05; CV>0.4; 2.305 genes) were used to calculate the components, and individual expression profiles were plotted against the first 3 components. Clusters containing GATA-1 non-expressing (LMPP, pre-GM GE-, GMP GE-) and GATA-1-expressing progenitors (pre-Meg-E, pre-GM GE+, GMP GE+) are highlighted. (b) Morphology of cultures derived from GMP GE- (left panel) and GMP GE+ (right panel) under eosinophil favoring culture conditions as depicted in Supplementary Figure 3a. Images show typical neutrophil morphology (black arrowheads), monocytes (white arrowheads) and polymorphonuclear cells (black arrows). Scale bars: 25μm. (c, d) Expression of eosinophil genes (c) and monocyte-macrophage genes (d) in GMP cultures, compared to monocytes (Mo) and eosinophils (Eo) purified from peritoneal cavity. Results are presented relative to Hprt expression (mean ±SD) (n=2 biological replicates, each containing 4 technical replicates). For (a) 4 individual gene expression profiles were made for GMP GE- and LMPP, and 3 for other populations.
Figure 4
Figure 4. Derivation of eosinophils from GMP GE+ and neutrophils from GMP GE-.
(a) FACS analysis of cells produced from GMP GE- and GMP GE+, cultured for 8 days under conditions sustaining all myeloid cell types, identifying monocytes (Mo), neutrophils (Ne), mast cells (Ma) and eosinophils (Eo) with indicated markers. Numbers indicate cells in the gate as percentage of analyzed live single cells. (b) Quantification of identified cell types after 8 day cultures of GMPs and pre-GMs as in (a) shown as percentage of live cells. (c) Quantification of identified cell population as in (a) after culturing GMPs under eosinophil favoring conditions. (d) Immunocytochemistry detecting EGFP expression (brown stain) on cytospins of cultured GE+ pre-GMs. Monocytes (Mo), neutrophils (Ne), mast cells (Ma) and eosinophils (Eo) are shown. Scale bars: 20μm (e) Morphological analysis after staining for EGFP as in (d) of cytospins from single cell cultured LMPPs, and GE- and GE+ pre-GMs and GMPs, cultured for 8 days under pan-myeloid conditions. Cell types are shown as frequency of analyzed clones (numbers on top of bars). FACS quantification show data from n=8 biological replicates and error bars indicate SD (b, c). Data from (e) was accumulated from 3 independent experiments.
Figure 5
Figure 5. Granulocyte-monocyte potentials segregate prior to dissociation from lymphoid and erythro-megakaryocytic lineages.
(a) GSEA-based comparison of GE- and GE+ pre-GM gene expression using CLP (top) and pre-Meg-E (bottom) gene sets. Normalized enrichment score (NES) and P-value are indicated. (b-e) Colony formation evaluated after 8 days of culture of indicated progenitor cells. Type of colonies assayed are (b) myeloid (CFU-GM), (c) erythroid (BFU-E), (d) megakaryocyte (CFU-Mk) and (e) combined myeloid and erythroid (CFU-Mix). (f) Cytospins from single CFU-Mix colonies derived from pre-GM GE+, showing combined erythroid cells (Ery), polymorphonuclear cells (PMN), megakaryocytes (Meg) and mast cells (Ma) but no monocytes. Scale bars: 25μm. (g) Assessment of lymphoid potential of the indicated progenitors. For each population the indicated number of cells/well were plated under B-cell (OP9 stroma) and T-cell (OP9-DL1 stroma) conditions. Bars indicate the percentage of wells producing B-cells (defined as CD19+) (top) or T-cells (defined as Thy1.2+CD25+ or CD4+CD8+) (bottom), respectively. Mean (±s.e.m.) number of positive wells plated with 1, 10 or 50 cells. Data are from 2 experiments each with 24 wells/population and cell density. Number of CFU-GM, BFU-E and CFU-Mk colonies are shown as mean ±s.e.m of 6,7,6,8,4 (b), 8,7,6,6,4 (c) and 7,7,7,6,4 (d) biological replicates for pre-GM GE-, pre-GM GE+, GMP GE-, GMP GE+ and pre-Meg-E resp. from 4 experiments. Numbers of CFU-mix colonies are mean ±SD from 3 biological replicates, each assayed in technical duplicate.
Figure 6
Figure 6. Gene expression in hematopoietic stem/progenitor populations.
Quantitative PCR analysis of mRNAs of indicated genes in hematopoietic stem and progenitor populations as indicated. Data show mRNA expression relative to Hprt. (mean ±SD, n=3 biological replicates for each population, except n=2 for preGM GE-).
Figure 7
Figure 7. Flt3 expression subdivides the pre-GM GE- population.
(a) FACS profiles showing Flt3 and EGFP expression in pre-GMs and GMPs from Gata1-EGFPtg/+ BM. Numbers indicate percentage of cells within each gate. (b) 100 cells of indicated pre-GMs were grown for 8 days and cell type was analyzed as in Fig. 4a. and shown as percentage of analyzed cells. (c) Single pre-GMs were grown for 8 days under pan-myeloid conditions and cytospins stained as in Fig. 4d. Cell types are shown as percentage of total analyzed clones, indicated on top of bars. (d-f) Gata1 (d), Flt3 (e) and Spfi1 (f) expression in single cells of indicated progenitors, shown as mRNA (Log2), normalized to Hprt and deviated from the mean. Numbers below graphs indicate cells positive for respective gene expression out of total number of cells. (g) Heatmap showing expression of genes including megakaryocyte/erythrocyte (Mk-E), mast cell (Ma) and neutrophil-monocyte (Ne Mo) related genes in single pre-GMs. Values were normalized to Hprt and shown as deviation from mean of each individual gene. FACS plots are representative for 10 independent experiments (a). Percentage of cell type (b) is mean ±SD from 12 (Pre-GM GE-Flt3+ and Pre-GM GE-Flt3-) and 7 (Pre-GM GE+Flt3-) biological replicates from 2 experiments. Analyzed clones (c) are accumulated from 2 independent experiments. Mann-Whitney U-test was used for expression levels (above graphs), Fisher’s exact test was used to compare expression frequencies between population (below graphs) (*p<0.0001, **p=0.001, ***p=0.002) (d).
Figure 8
Figure 8. in vivo myeloid reconstitution of GE- and GE+ myeloid progenitor cells.
(a) Representative gating strategy for identification of peritoneal neutrophils (Ne), mast cells (Ma), monocytes (Mo) and eosinophils (Eo). (b) Representative gating strategy for identification of donor derived CD45.1/2 or CD45.2 mast cells (Ma), eosinophils (Eo), neutrophils (Ne) and monocytes (Mo) 7 (GMP) and 11 (pre-GM) days following IP transplantation. Percentages shown are relative to total cells generated from CD45.1/2 and CD45.2 cells, respectively. (c-e) Quantification of in vivo contribution of GE+ and GE- GMPs (c), GE+Flt3- and GE-Flt3+ pre-GMs (d) and LMPPs (e) to peritoneal mast cells, eosinophils, neutrophils and monocytes at indicated days after intraperitoneal transplantation of 1000-4000 cells/donor. Donor derived cells per million analyzed MNCs per 1000 injected cells is shown. * indicates that reconstitution was below detection limit (see methods and Supplementary Fig. 6).

Comment in

Similar articles

Cited by

References

    1. Koenderman L, Buurman W, Daha MR. The innate immune response. Immunol Lett. 2014;162(2PB):95–102. - PubMed
    1. Orkin SH, Zon LI. Hematopoiesis: an evolving paradigm for stem cell biology. Cell. 2008;132(4):631–644. - PMC - PubMed
    1. Metcalf D. Lineage commitment and maturation in hematopoietic cells: the case for extrinsic regulation. Blood. 1998;92(2):345–347. discussion 352. - PubMed
    1. Sadrzadeh H, Abdel-Wahab O, Fathi AT. Molecular alterations underlying eosinophilic and mast cell malignancies. Discov Med. 2011;12(67):481–493. - PubMed
    1. Manz MG, Boettcher S. Emergency granulopoiesis. Nat Rev Immunol. 2014;14(5):302–314. - PubMed

Publication types

MeSH terms