A blood RNA signature for tuberculosis disease risk: a prospective cohort study
- PMID: 27017310
- PMCID: PMC5392204
- DOI: 10.1016/S0140-6736(15)01316-1
A blood RNA signature for tuberculosis disease risk: a prospective cohort study
Abstract
Background: Identification of blood biomarkers that prospectively predict progression of Mycobacterium tuberculosis infection to tuberculosis disease might lead to interventions that combat the tuberculosis epidemic. We aimed to assess whether global gene expression measured in whole blood of healthy people allowed identification of prospective signatures of risk of active tuberculosis disease.
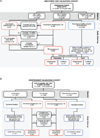
Methods: In this prospective cohort study, we followed up healthy, South African adolescents aged 12-18 years from the adolescent cohort study (ACS) who were infected with M tuberculosis for 2 years. We collected blood samples from study participants every 6 months and monitored the adolescents for progression to tuberculosis disease. A prospective signature of risk was derived from whole blood RNA sequencing data by comparing participants who developed active tuberculosis disease (progressors) with those who remained healthy (matched controls). After adaptation to multiplex quantitative real-time PCR (qRT-PCR), the signature was used to predict tuberculosis disease in untouched adolescent samples and in samples from independent cohorts of South African and Gambian adult progressors and controls. Participants of the independent cohorts were household contacts of adults with active pulmonary tuberculosis disease.
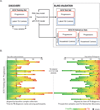
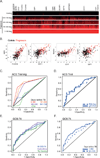
Findings: Between July 6, 2005, and April 23, 2007, we enrolled 6363 participants from the ACS study and 4466 from independent South African and Gambian cohorts. 46 progressors and 107 matched controls were identified in the ACS cohort. A 16 gene signature of risk was identified. The signature predicted tuberculosis progression with a sensitivity of 66·1% (95% CI 63·2-68·9) and a specificity of 80·6% (79·2-82·0) in the 12 months preceding tuberculosis diagnosis. The risk signature was validated in an untouched group of adolescents (p=0·018 for RNA sequencing and p=0·0095 for qRT-PCR) and in the independent South African and Gambian cohorts (p values <0·0001 by qRT-PCR) with a sensitivity of 53·7% (42·6-64·3) and a specificity of 82·8% (76·7-86) in the 12 months preceding tuberculosis.
Interpretation: The whole blood tuberculosis risk signature prospectively identified people at risk of developing active tuberculosis, opening the possibility for targeted intervention to prevent the disease.
Funding: Bill & Melinda Gates Foundation, the National Institutes of Health, Aeras, the European Union, and the South African Medical Research Council.
Copyright © 2016 Elsevier Ltd. All rights reserved.
Conflict of interest statement
The authors have no potential conflicts to declare.
Figures


Comment in
-
Predicting active tuberculosis progression by RNA analysis.Lancet. 2016 Jun 4;387(10035):2268-2270. doi: 10.1016/S0140-6736(16)00165-3. Epub 2016 Mar 24. Lancet. 2016. PMID: 27017311 No abstract available.
-
Predicting tuberculosis risk.Lancet. 2016 Nov 5;388(10057):2233. doi: 10.1016/S0140-6736(16)32070-0. Lancet. 2016. PMID: 27825497 No abstract available.
-
Predicting tuberculosis risk - Authors' reply.Lancet. 2016 Nov 5;388(10057):2233-2234. doi: 10.1016/S0140-6736(16)31653-1. Lancet. 2016. PMID: 27825498 No abstract available.
Similar articles
-
Discovery and validation of a prognostic proteomic signature for tuberculosis progression: A prospective cohort study.PLoS Med. 2019 Apr 16;16(4):e1002781. doi: 10.1371/journal.pmed.1002781. eCollection 2019 Apr. PLoS Med. 2019. PMID: 30990820 Free PMC article.
-
Assessment of Validity of a Blood-Based 3-Gene Signature Score for Progression and Diagnosis of Tuberculosis, Disease Severity, and Treatment Response.JAMA Netw Open. 2018 Oct 5;1(6):e183779. doi: 10.1001/jamanetworkopen.2018.3779. JAMA Netw Open. 2018. PMID: 30646264 Free PMC article.
-
Biomarker-guided tuberculosis preventive therapy (CORTIS): a randomised controlled trial.Lancet Infect Dis. 2021 Mar;21(3):354-365. doi: 10.1016/S1473-3099(20)30914-2. Epub 2021 Jan 25. Lancet Infect Dis. 2021. PMID: 33508224 Free PMC article. Clinical Trial.
-
Detection of tuberculosis in HIV-infected and -uninfected African adults using whole blood RNA expression signatures: a case-control study.PLoS Med. 2013 Oct;10(10):e1001538. doi: 10.1371/journal.pmed.1001538. Epub 2013 Oct 22. PLoS Med. 2013. PMID: 24167453 Free PMC article.
-
Transcriptomics for child and adolescent tuberculosis.Immunol Rev. 2022 Aug;309(1):97-122. doi: 10.1111/imr.13116. Epub 2022 Jul 12. Immunol Rev. 2022. PMID: 35818983 Free PMC article. Review.
Cited by
-
Diagnostic Performance of Unstimulated IFN-γ (IRISA-TB) for Pleural Tuberculosis: A Prospective Study in South Africa and India.Open Forum Infect Dis. 2024 Sep 24;11(10):ofae533. doi: 10.1093/ofid/ofae533. eCollection 2024 Oct. Open Forum Infect Dis. 2024. PMID: 39431148 Free PMC article.
-
Childhood Tuberculosis: Historical Perspectives, Recent Advances, and a Call to Action.J Pediatric Infect Dis Soc. 2022 Oct 31;11 Suppl 3(Suppl 3):S63-S66. doi: 10.1093/jpids/piac051. J Pediatric Infect Dis Soc. 2022. PMID: 36314551 Free PMC article. No abstract available.
-
Localized skin inflammation during cutaneous leishmaniasis drives a chronic, systemic IFN-γ signature.PLoS Negl Trop Dis. 2021 Apr 1;15(4):e0009321. doi: 10.1371/journal.pntd.0009321. eCollection 2021 Apr. PLoS Negl Trop Dis. 2021. PMID: 33793565 Free PMC article.
-
BACH1 promotes tissue necrosis and Mycobacterium tuberculosis susceptibility.Nat Microbiol. 2024 Jan;9(1):120-135. doi: 10.1038/s41564-023-01523-7. Epub 2023 Dec 8. Nat Microbiol. 2024. PMID: 38066332 Free PMC article.
-
The elusive allure of a rapid host blood signature for tuberculosis disease.J Clin Microbiol. 2024 Feb 14;62(2):e0128923. doi: 10.1128/jcm.01289-23. Epub 2024 Jan 25. J Clin Microbiol. 2024. PMID: 38270458 Free PMC article.
References
-
- WHO. WHO. Global Tuberculosis Report. 2014 2014. http://www.who.int/tb/publications/global_report/en/ (accessed.
-
- Comstock GW, Livesay VT, Woolpert SF. The prognosis of a positive tuberculin reaction in childhood and adolescence. American journal of epidemiology. 1974;99(2):131–138. - PubMed
-
- Vynnycky E, Fine PE. Lifetime risks, incubation period, and serial interval of tuberculosis. American journal of epidemiology. 2000;152(3):247–263. - PubMed
Publication types
MeSH terms
Substances
Grants and funding
LinkOut - more resources
Full Text Sources
Other Literature Sources
Medical
Molecular Biology Databases
Miscellaneous

