. 2016 Aug;64(2):599-615.
doi: 10.1002/hep.28573. Epub 2016 May 12.

MicroRNA-122 regulates polyploidization in the murine liver

Affiliations

MicroRNA-122 regulates polyploidization in the murine liver

Shu-Hao Hsu et al. Hepatology. 2016 Aug.

Abstract

A defining feature of the mammalian liver is polyploidy, a numerical change in the entire complement of chromosomes. The first step of polyploidization involves cell division with failed cytokinesis. Although polyploidy is common, affecting ∼90% of hepatocytes in mice and 50% in humans, the specialized role played by polyploid cells in liver homeostasis and disease remains poorly understood. The goal of this study was to identify novel signals that regulate polyploidization, and we focused on microRNAs (miRNAs). First, to test whether miRNAs could regulate hepatic polyploidy, we examined livers from Dicer1 liver-specific knockout mice, which are devoid of mature miRNAs. Loss of miRNAs resulted in a 3-fold reduction in binucleate hepatocytes, indicating that miRNAs regulate polyploidization. Second, we surveyed age-dependent expression of miRNAs in wild-type mice and identified a subset of miRNAs, including miR-122, that is differentially expressed at 2-3 weeks, a period when extensive polyploidization occurs. Next, we examined Mir122 knockout mice and observed profound, lifelong depletion of polyploid hepatocytes, proving that miR-122 is required for complete hepatic polyploidization. Moreover, the polyploidy defect in Mir122 knockout mice was ameliorated by adenovirus-mediated overexpression of miR-122, underscoring the critical role miR-122 plays in polyploidization. Finally, we identified direct targets of miR-122 (Cux1, Rhoa, Iqgap1, Mapre1, Nedd4l, and Slc25a34) that regulate cytokinesis. Inhibition of each target induced cytokinesis failure and promoted hepatic binucleation.

Conclusion: Among the different signals that have been associated with hepatic polyploidy, miR-122 is the first liver-specific signal identified; our data demonstrate that miR-122 is both necessary and sufficient in liver polyploidization, and these studies will serve as the foundation for future work investigating miR-122 in liver maturation, homeostasis, and disease. (Hepatology 2016;64:599-615).


Figures

Fig. 1
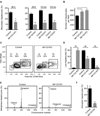
Fig. 1. Hepatic binucleation begins at 14d and is impaired in Dicer1-deleted livers
(A) Livers from WT C57BL/6 mice ages 8–56d (n = 3) were stained with phalloidin (green) to mark cell boundaries and Hoechst 33342 (blue) to mark nuclei and the number of mono- and binucleate hepatocytes counted. Representative images show a 14d-old liver with small hepatocytes that are predominantly mononucleate and a 56d-old liver with large hepatocytes that are mono- or binucleate (left). The percentage of binucleate hepatocytes at each age is indicated (right). * P ≤ 0.003, ** P ≤ 0.02, compared to 18 and 20d. (B) Livers from WT C57BL/6 mice ages 12–75d (n = 3) were stained with the proliferation marker Ki-67 (brown) and hematoxylin (blue) for nuclei. Representative images show Ki-67+ hepatocytes in 15 and 75d-old livers (left). The percentage of Ki-67+ hepatocytes is indicated (right). P values at 12–28d are compared to 75d. (C) Livers from control or Dicer1-LKO mice ages 22–28d (n = 5) were stained for β-catenin (brown) to mark cell membranes and hematoxylin (blue) for nuclei. Representative images are shown (left). Control and Dicer1-LKO livers had equivalent numbers of cells per 200× field-of-view (middle), and binucleate hepatocytes were reduced 3-fold in Dicer1-LKO livers (right). *** P ≤ 0.0001. Graphs show mean ± SEM. Scale bars are 50 µm.
Fig. 2
Fig. 2. miRNAs are temporally expressed in the mouse liver
(A,B) miRNA expression was assessed in livers from WT C57BL/6 mice at ages embryonic day 15.5 (E15.5), 2-, 3- and 7wk (n = 3) using the nCounter Mouse miRNA Expression Assay from NanoString Technologies. Among the ~600 miRNAs examined, 181 were differentially expressed at E15.5, 2- and 3wk compared to 7wk-old livers (P < 0.05), as indicated in the Venn diagram (A). The heat map illustrates 4 major expression patterns (B). The number of miRNAs in each category is indicated in parentheses. Detailed expression profiles are in Supporting Table 1. (C) Expression of select miRNAs (elevated during postnatal development) was tracked in WT C57BL/6 livers at ages E15.5, E19.5, 1-, 2-, 3-, 4- and 7wk (n = 3–4) by quantitative reverse transcriptase PCR (qRT-PCR). Peak expression of miR-23, -30d, -122, -148 and -194 occurred at 1–3wks. Expression values were normalized to miR-16. * P < 0.04, ** P ≤ 0.009, *** P < 0.0008, compared to 2wk. Graphs show mean ± SEM.
Fig. 3
Fig. 3. Mir122-deficient livers are enriched for diploid, euploid hepatocytes
(A,B) Livers from control, Mir122-LKO and Mir122-KO livers were stained with phalloidin and Hoechst 33342, as shown in Supporting Fig. 2A (n = 4–5 mice/age/genotype). The percentage of binucleate hepatocytes was reduced 2–3-fold at 28d (LKO and KO), 2.5mo (KO) and 6.0mo (KO) (A). 28d-old Mir122-LKO and Mir122-KO livers had 20–25% more hepatocytes per 150× field-of-view (B). (C,D) Single cell suspensions of hepatocytes were stained with a viability marker and Hoechst 33342, allowing identification of live cells with 2c, 4c and 8c nuclear content, corresponding to diploid, tetraploid and octaploid hepatocytes, respectively. Representative ploidy profiles are shown (C) and the percentage of each population quantified (n = 4; 2.5mo) (D). (E,F) Metaphase cytogenetic analysis revealed skewed chromosome counts (hypo-diploid, hypo-tetraploid and hyper-tetraploid) in control hepatocytes but not Mir122-KO hepatocytes (n = 4) (E). The overall degree of aneuploidy in Mir122-KO hepatocytes was reduced 4–5-fold compared to controls (F). See Supporting Fig. 4 individual karyotypes. * P ≤ 0.03, ** P ≤ 0.0001. Graphs show mean ± SEM.
Fig. 4
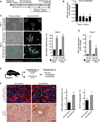
Fig. 4. miR-122 induces binucleation in vitro and in vivo.
(A–D) Diploid hepatocytes isolated from 14d-old WT C57BL/6 mice were plated on day 0, transfected with miR-122 mimic or control mimic (25 nM or 200 nM) on day 1 and proliferation/nucleation tracked until day 4. (A) Experimental design. (B) Primary non-transfected hepatocytes rapidly lost miR-122 expression in culture, as measured by qRT-PCR and normalized to RNU6b (n = 3). (C) Cultured non-transfected hepatocytes were predominantly mononucleate on day 1, and by day 4 hepatocytes transfected with 25 nM or 200 nM miR-122 mimic contained 3-fold more binucleate hepatocytes compared to controls. Representative images are shown (left). Dashed white lines indicate mononucleate hepatocytes, and bold green lines mark binucleate hepatocytes. Graph shows the percentage of binucleate hepatocytes observed at day 4 (n = 3–6) (right). (D) Hepatocytes transfected with miR-122 mimic contained 10–20-fold more miR-122 at day 4. miR-122 expression was normalized to RNU6b (n = 3 from 2 independent experiments). (E,F) Mir122-KO mice were injected with Ad-miR122 or Ad-control (1 × 10⁹ viral particles) on postnatal day 12 (n = 5) and livers harvested on postnatal day 22. (E) Cartoon showing the experimental design is shown. (F) Livers were stained with β-catenin (red) to mark membranes and Hoechst 33342 (blue) to mark nuclei. Arrows indicate binucleate hepatocytes. Additionally, livers were stained with Ki-67 (brown) to identify proliferating cells. Representative images are shown (left). The percentage of binucleate hepatocytes and Ki-67+ hepatocytes is shown in the graphs (right). * P < 0.04, ** P < 0.02, *** P < 0.007. Graphs show mean ± SEM. Scale bars are 50 µm.
Fig. 5
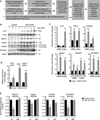
Fig. 5. miR-122 regulates expression of cytokinesis-related targets
(A) Strategy for identifying miR-122 target genes that regulate cytokinesis. (B,C) Cux1, Rhoa, Mapre1, Iqgap1, Nedd4l and Slc25a34 were up-regulated in 28d-old Mir122-KO livers compared to the controls at the protein and/or mRNA levels (n = 4–5). Western blots are shown for 4 control and 5 Mir122-KO livers; Gapdh was used as a loading control (B). Graphs show relative mRNA and protein expression levels normalized to Gapdh (C). (D) Centralspindlin complex members Racgap1, Ect2 and Kif23/Mklp1 were also up-regulated in 28d-old Mir122-KO livers (n = 5). The graph shows mRNA expression normalized to Gapdh. (E) NIH 3T3 cells were transfected with Mapre1, Iqgap1, Nedd4l or Slc25a34 reporter plasmids containing predicted miR-122 3’UTR seed sequences (full length, FL) or with the seed sequences deleted (DEL). Reporter constructs are detailed in Supporting Fig. 8. Cells were co-transfected with control or miR-122 mimic (25 nM) and luciferase activity measured after 48h. For each set of reporters, miR-122 expression reduced reporter activity 26–47% in the presence of FL reporters but not DEL reporters. Graphs show normalized luciferase activity (Renilla luciferase activity controlled by FL or DEL normalized to firefly luciferase activity expressed by the same plasmid) (n = 3 replicates from 2–3 independent experiments). * P < 0.03, ** P < 0.008, *** P < 0.0008. Graphs show mean ± SEM.
Fig. 6
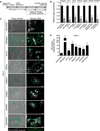
Fig. 6. Inhibition of miR-122 target genes promotes formation of binucleate hepatocytes
(A) Experimental design for tracking diploid hepatocytes depleted of target genes. Diploid hepatocytes isolated from 14–15d-old WT C57BL/6 mice were plated on day 0, transfected with 20–40 nM siRNAs on day 1 and proliferation/nucleation tracked until day 4. (B) Hepatocytes transfected with scrambled siRNA or siRNAs to Racgap1, Cux1, Rhoa, Mapre1, Iqgap1, Nedd4l or Slc25a34 showed reduced target expression on day 4 (n = 2–4 replicates from 2 independent experiments). The graph shows relative gene expression measured by qRT-PCR normalized with Gapdh. Total Nedd4l was measured using primers detecting both the short and long forms. Protein levels are shown in Supporting Fig. 9. (C,D) The number of nuclei/hepatocyte was determined on day 4. Representative images illustrate a mixture of mono- and binucleate hepatocytes (C), and the percentage of binucleate hepatocytes calculated (n = 3–6) (D). Dashed white lines indicate mononucleate hepatocytes, and bold green lines mark binucleate hepatocytes. The dashed line on the graph indicates the percentage of binucleate cells in cultures of hepatocytes transfected with scrambled siRNA. * P < 0.04, ** P < 0.009. Graphs show mean ± SEM. Scale bars are 50 µm.
Fig. 7
Fig. 7. A network of signals regulates hepatic binucleation
(A) The model details a mechanism of miR-122-regulated cytokinesis. miR-122 directly antagonizes pro-cytokinesis targets (shown in orange), induces cytokinesis failure and emergence of binucleate hepatocytes. (B) The cartoon illustrates signaling networks involved in cytokinesis failure in postnatal developing livers and successful cytokinesis in adult regenerating livers. Green arrows indicate elevated expression; red arrows indicate reduced expression.

Similar articles

Cited by

References

    1. Guidotti JE, Bregerie O, Robert A, Debey P, Brechot C, Desdouets C. Liver cell polyploidization: a pivotal role for binuclear hepatocytes. J Biol Chem. 2003;278:19095–19101. - PubMed
    1. Margall-Ducos G, Celton-Morizur S, Couton D, Bregerie O, Desdouets C. Liver tetraploidization is controlled by a new process of incomplete cytokinesis. J Cell Sci. 2007;120:3633–3639. - PubMed
    1. Duncan AW, Hanlon Newell AE, Smith L, Wilson EM, Olson SB, Thayer MJ, Strom SC, et al. Frequent aneuploidy among normal human hepatocytes. Gastroenterology. 2012;142:25–28. - PMC - PubMed
    1. Duncan AW, Taylor MH, Hickey RD, Hanlon Newell AE, Lenzi ML, Olson SB, Finegold MJ, et al. The ploidy conveyor of mature hepatocytes as a source of genetic variation. Nature. 2010;467:707–710. - PMC - PubMed
    1. Duncan AW. Aneuploidy, polyploidy and ploidy reversal in the liver. Semin Cell Dev Biol. 2013;24:347–356. - PubMed

Publication types