

Crucial roles of XCR1-expressing dendritic cells and the XCR1-XCL1 chemokine axis in intestinal immune homeostasis
- PMID: 27005831
- PMCID: PMC4804307
- DOI: 10.1038/srep23505
Crucial roles of XCR1-expressing dendritic cells and the XCR1-XCL1 chemokine axis in intestinal immune homeostasis
Abstract
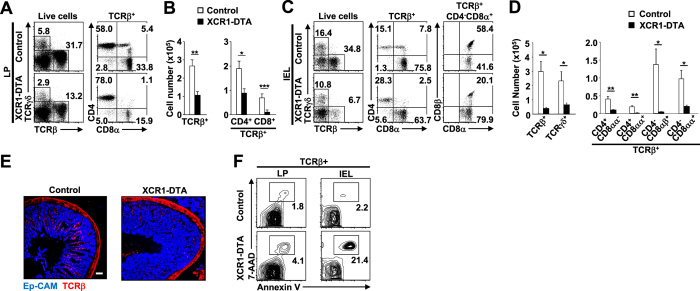
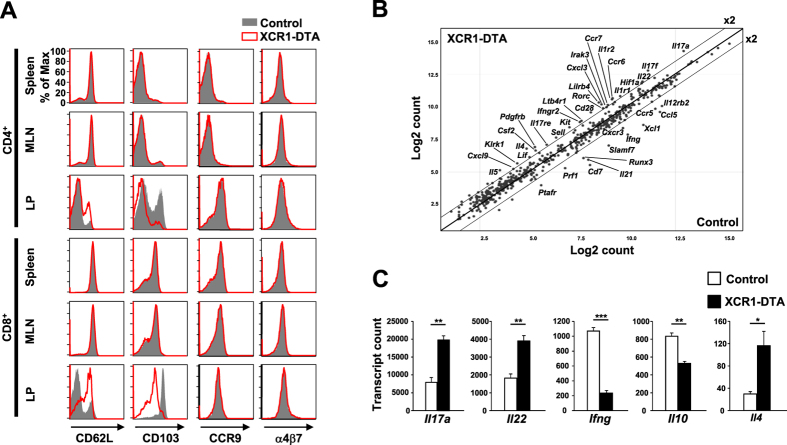
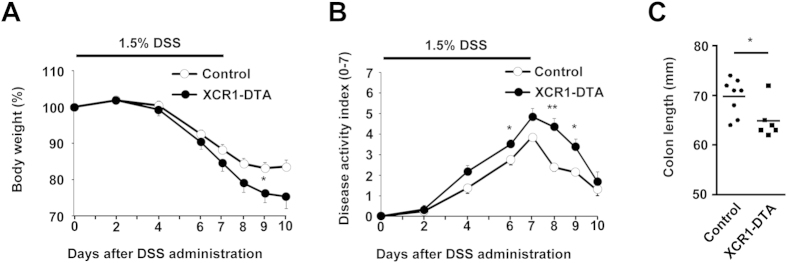
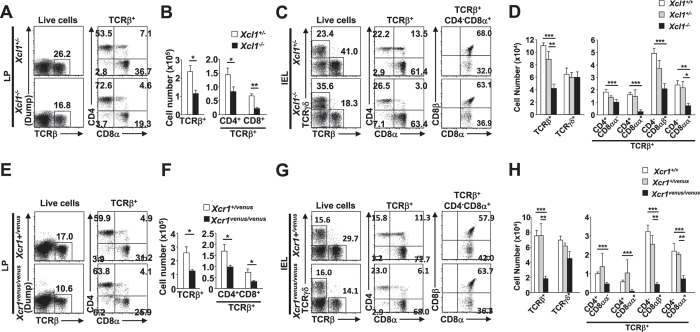
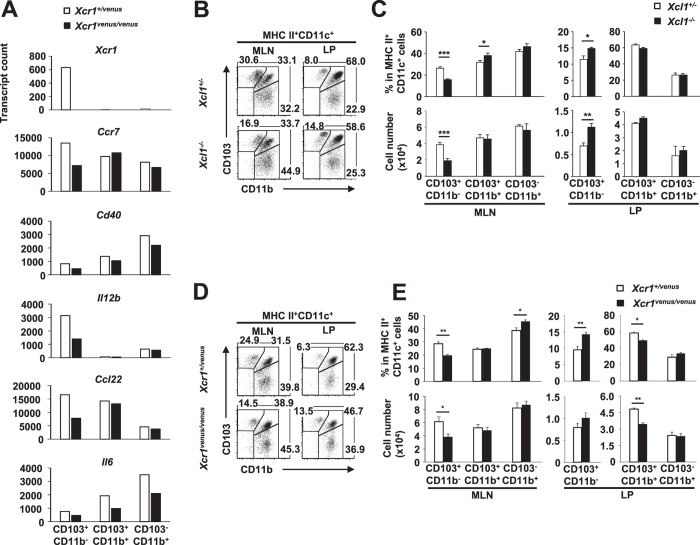
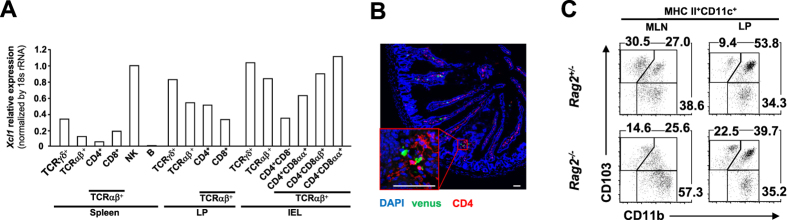
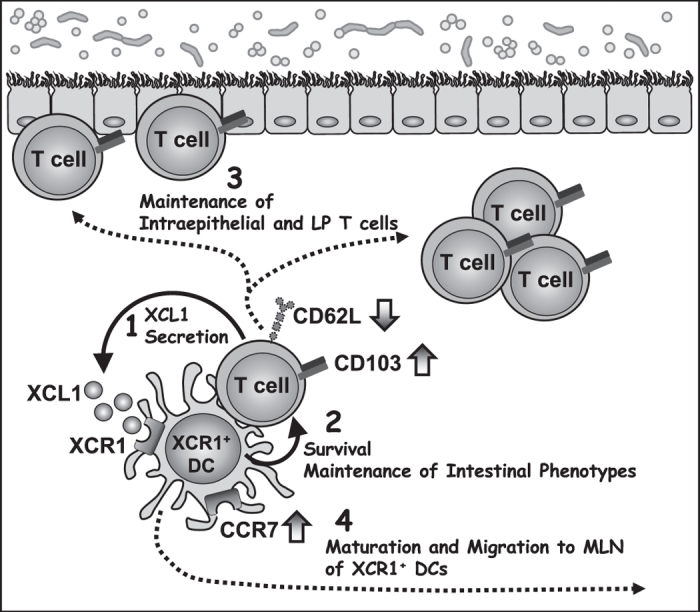
Intestinal immune homeostasis requires dynamic crosstalk between innate and adaptive immune cells. Dendritic cells (DCs) exist as multiple phenotypically and functionally distinct sub-populations within tissues, where they initiate immune responses and promote homeostasis. In the gut, there exists a minor DC subset defined as CD103(+)CD11b(-) that also expresses the chemokine receptor XCR1. In other tissues, XCR1(+) DCs cross-present antigen and contribute to immunity against viruses and cancer, however the roles of XCR1(+) DCs and XCR1 in the intestine are unknown. We showed that mice lacking XCR1(+) DCs are specifically deficient in intraepithelial and lamina propria (LP) T cell populations, with remaining T cells exhibiting an atypical phenotype and being prone to death, and are also more susceptible to chemically-induced colitis. Mice deficient in either XCR1 or its ligand, XCL1, similarly possess diminished intestinal T cell populations, and an accumulation of XCR1(+) DCs in the gut. Combined with transcriptome and surface marker expression analysis, these observations lead us to hypothesise that T cell-derived XCL1 facilitates intestinal XCR1(+) DC activation and migration, and that XCR1(+) DCs in turn provide support for T cell survival and function. Thus XCR1(+) DCs and the XCR1/XCL1 chemokine axis have previously-unappreciated roles in intestinal immune homeostasis.
Figures
Similar articles
-
The invariant natural killer T cell-mediated chemokine X-C motif chemokine ligand 1-X-C motif chemokine receptor 1 axis promotes allergic airway hyperresponsiveness by recruiting CD103+ dendritic cells.J Allergy Clin Immunol. 2018 Dec;142(6):1781-1792.e12. doi: 10.1016/j.jaci.2017.12.1005. Epub 2018 Feb 21. J Allergy Clin Immunol. 2018. PMID: 29474842
-
A Highly Active Form of XCL1/Lymphotactin Functions as an Effective Adjuvant to Recruit Cross-Presenting Dendritic Cells for Induction of Effector and Memory CD8+ T Cells.Front Immunol. 2018 Nov 27;9:2775. doi: 10.3389/fimmu.2018.02775. eCollection 2018. Front Immunol. 2018. PMID: 30542351 Free PMC article.
-
Rat cytomegalovirus-encoded γ-chemokine vXCL1 is a highly adapted, species-specific agonist for rat XCR1-positive dendritic cells.J Cell Sci. 2019 Nov 18;133(5):jcs236190. doi: 10.1242/jcs.236190. J Cell Sci. 2019. PMID: 31649144
-
XCL1 and XCR1 in the immune system.Microbes Infect. 2012 Mar;14(3):262-7. doi: 10.1016/j.micinf.2011.10.003. Epub 2011 Oct 31. Microbes Infect. 2012. PMID: 22100876 Review.
-
Conventional Type 1 Dendritic Cells in Intestinal Immune Homeostasis.Front Immunol. 2022 May 27;13:857954. doi: 10.3389/fimmu.2022.857954. eCollection 2022. Front Immunol. 2022. PMID: 35693801 Free PMC article. Review.
Cited by
-
Dynamic Interplay of Innate and Adaptive Immunity During Sterile Retinal Inflammation: Insights From the Transcriptome.Front Immunol. 2018 Jul 18;9:1666. doi: 10.3389/fimmu.2018.01666. eCollection 2018. Front Immunol. 2018. PMID: 30073000 Free PMC article.
-
XCR1: A promising prognostic marker that pinpoints targeted and immune-based therapy in hepatocellular carcinoma.Heliyon. 2024 May 24;10(11):e31968. doi: 10.1016/j.heliyon.2024.e31968. eCollection 2024 Jun 15. Heliyon. 2024. PMID: 38868008 Free PMC article.
-
Human dendritic cell subsets: an update.Immunology. 2018 May;154(1):3-20. doi: 10.1111/imm.12888. Epub 2018 Feb 27. Immunology. 2018. PMID: 29313948 Free PMC article. Review.
-
cDC1-derived IL-27 regulates small intestinal CD4+ T cell homeostasis in mice.J Exp Med. 2023 Mar 6;220(3):e20221090. doi: 10.1084/jem.20221090. Epub 2022 Dec 14. J Exp Med. 2023. PMID: 36515659 Free PMC article.
-
DC Respond to Cognate T Cell Interaction in the Antigen-Challenged Lymph Node.Front Immunol. 2019 Apr 25;10:863. doi: 10.3389/fimmu.2019.00863. eCollection 2019. Front Immunol. 2019. PMID: 31073301 Free PMC article.
References
Publication types
MeSH terms
Substances
LinkOut - more resources
Full Text Sources
Other Literature Sources
Molecular Biology Databases
Research Materials
