. 2016 Apr 5;113(14):E2029-38.
doi: 10.1073/pnas.1520113113. Epub 2016 Mar 21.

Unusual maintenance of X chromosome inactivation predisposes female lymphocytes for increased expression from the inactive X

Affiliations

Unusual maintenance of X chromosome inactivation predisposes female lymphocytes for increased expression from the inactive X

Jianle Wang et al. Proc Natl Acad Sci U S A. .

Abstract

Females have a greater immunological advantage than men, yet they are more prone to autoimmune disorders. The basis for this sex bias lies in the X chromosome, which contains many immunity-related genes. Female mammals use X chromosome inactivation (XCI) to generate a transcriptionally silent inactive X chromosome (Xi) enriched with heterochromatic modifications and XIST/Xist RNA, which equalizes gene expression between the sexes. Here, we examine the maintenance of XCI in lymphocytes from females in mice and humans. Strikingly, we find that mature naïve T and B cells have dispersed patterns of XIST/Xist RNA, and they lack the typical heterochromatic modifications of the Xi. In vitro activation of lymphocytes triggers the return of XIST/Xist RNA transcripts and some chromatin marks (H3K27me3, ubiquitin-H2A) to the Xi. Single-cell RNA FISH analysis of female T cells revealed that the X-linked immunity genes CD40LG and CXCR3 are biallelically expressed in some cells. Using knockout and knockdown approaches, we find that Xist RNA-binding proteins, YY1 and hnRNPU, are critical for recruitment of XIST/Xist RNA back to the Xi. Furthermore, we examined B cells from patients with systemic lupus erythematosus, an autoimmune disorder with a strong female bias, and observed different XIST RNA localization patterns, evidence of biallelic expression of immunity-related genes, and increased transcription of these genes. We propose that the Xi in female lymphocytes is predisposed to become partially reactivated and to overexpress immunity-related genes, providing the first mechanistic evidence to our knowledge for the enhanced immunity of females and their increased susceptibility for autoimmunity.

Keywords: X chromosome inactivation; XIST RNA; epigenetics; female-biased autoimmunity.


Conflict of interest statement

The authors declare no conflict of interest.

Figures
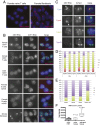
Fig. 1.
Fig. 1.
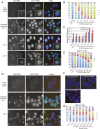
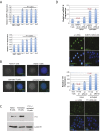
Naïve human lymphocytes lack canonical XIST RNA clouds on the Xi. (A) RNA FISH analysis for XIST RNA and COT1 RNA, for naïve T cells and female fibroblast cell line (IMR-90). (B) XIST (red) and COT1 (green) RNA FISH for sorted mature naïve lymphocytes from human males and females. (C) Diversity of XIST RNA localization patterns (types I, II, III, IV) in naïve human lymphocytes. Sequential RNA FISH (for XIST RNA) followed by DNA FISH (to identify the two X chromosomes) at single-cell resolution. Arrows denote the inactive X chromosome. (D) Quantification of each type of XIST RNA localization pattern for naïve CD4+ and CD8+ T cells. (E) XIST RNA localization patterns for naïve B cells. (F) Quantification of total fluorescence for XIST RNA FISH using exon 1 probe for 12 nuclei for each cell type.
Fig. 2.
Fig. 2.
XIST/Xist RNA transcripts return to the Xi in activated T and B cells. (A) Representative XIST and COT1 RNA FISH images of human naïve T cells stimulated in vitro. Stimulation of five different individuals yielded similar results. (B) Quantification of each class of XIST RNA localization pattern (types I–IV) after stimulation for cells from the same individual. (C) qRT-PCR for XIST RNA in naïve and activated T cells using primer sets for both the 5′ and 3′ ends. (D) Xist RNA and Cot1 RNA FISH analyses of mouse naïve T and in vitro activated T cells. (E) Xist RNA localization in activated mouse T cells. (F) Xist RNA FISH using female mouse mature naïve B cells and activated B cells stimulated in vitro using lipopolysaccharaide (LPS) or CpG DNA (CpG). (G) Xist RNA localization patterns for activated mouse B cells.
Fig. S1.
Fig. S1.
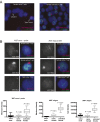
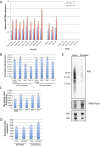
Quantification of XIST RNA transcripts in human T cells. (A) Representative field images of XIST RNA FISH using XIST oligo probes for human female T cells. (B) Quantification of total fluorescence and maximum intensities for naïve male and female T cells, and activated female T cells for RNA FISH performed using an exon 1 probe or XIST-specific oligos. Representative images of nuclei are shown, and below are distribution plots for 12 nuclei counted for each condition. P values were calculated comparing the naïve male cells to female cells (naïve or activated), and two-sided Welch t tests were used (which accounts for unequal variance).
Fig. S2.
Fig. S2.
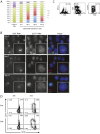
Human XIST RNA FISH and FACS sorting of mouse T cells. (A) Quantification of each pattern of XIST RNA localization following in vitro stimulation (6 h, 1 d, 3 d, 5 d), using cells from the same female donor (ND407). (B) Representative XIST (red) and COT1 (green) RNA FISH images of human naïve T cells stimulated in vitro for 5, 7, or 11 d. Inset is an image of a nucleus. (C) FACS sorting of mature naïve T cells to quantify T-cell subsets, before in vitro stimulation, and used to profile Xist RNA expression in Fig. 2. Purified T cells are 93% pure (Left), of which 46% are CD4+ and 49% were CD8+. Approximately 10% of the CD4+ population is FoxP3+. Bulk T cells were also stained with Ki-67 (to determine proliferation), and 97% of cells were positive for this marker. (D) FACS sorting of activated T cells to determine the percentage of activated cells (39 h and 64 h after CD3/CD28 stimulation) determined by CD44 expression and CFSE labeling. At 39 h, 10–15% of the T cells have divided, but lack CD44 expression. At 64 h, 15–25% of the cells have divided and are CD44+.
Fig. S3.
Fig. S3.
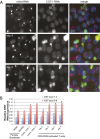
Xist RNA FISH analysis of activated mouse T cells and quantification of human XIST RNA expression during human T-cell stimulation. (A) Representative Xist (red) and COT1 (green) RNA FISH images of mouse T cells activated for 3, 4, and 5 d. (B) Human XIST RNA expression profiling in naïve CD4+ and CD8+ T cells and activated bulk T cells from the same donor (ND340). RNA samples were normalized for total RNA before cDNA synthesis. Two different female fibroblast cell lines are included as positive controls: fetal lung (IMR-90) and an adult fibroblast line (Coriell Institute; GM03956). Two different XIST intron-spanning primer sets were used (blue: exon 1 and exon 3; red: exon 5 and exon 6) and yielded similar results.
Fig. S4.
Fig. S4.
XIST/Xist RNA quantification (using qPCR) in human and mouse lymphocytes. (A) Quantification of XIST RNA expression in female fibroblasts (fibro), and FACS-sorted CD4+, CD8+ T cells, and mature naïve B cells from human male and female donors. Two different XIST intron-spanning primer sets were used (blue: exon 1 and exon 3; red: exon 5 and exon 6) and yielded similar results. (B) Quantification of Xist RNA expression in splenic B cells after in vitro stimulation with LPS or CpG. Results from the same female mouse are shown; replicate experiments yielded similar results. (C) Quantification of Xist RNA transcripts in mature naïve T cells (mice) and 7 d after in vitro stimulation. (D) Comparison of different quantification methods to assess steady-state levels of mouse Xist RNA in naïve and activated (day 1) T cells. Equal amounts of total RNA (for cDNA synthesis) or total cell numbers were used. (E) Northern blot analysis of 20 μg of total RNA from female naïve and activated T cells hybridized using a probe for Xist (5′ end), and RNA Pol II was a loading control.
Fig. 3.
Fig. 3.
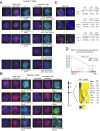
The Xi has euchromatic features in mammalian lymphocytes. Sequential XIST RNA FISH, then immunofluorescence detection (and X-Paint to detect both X chromosomes) for naïve and activated T cells from humans (A) and mice (B). (C) Allele-specific expression (using RNA FISH) of CD40LG, CXCR3, and ATRX in activated human female T cells at single-cell resolution. White arrows indicate nascent transcripts from each X. (D) GSEA analysis comparing global gene expression differences with human female (seven samples) to male naïve B cells (two samples). Chromosome X map shows three regions on the X that have higher expression in female B cells. Heatmap lists the overexpressed genes in female naïve B cells from region chrX.q13 and fold-change (FC) values.
Fig. S5.
Fig. S5.
Allele-specific expression of CXCR3, CD40LG, and ATRX in naïve human male and female T cells using RNA FISH. (A) Representative RNA FISH images and counts of monoallelic and biallelic expression for each X-linked gene. Signals overlapping an X chromosome were counted. White arrow denotes nascent transcription from the X chromosome. XIST RNA (green) was used as a negative control. (B) Same as A, but for female naïve cells. Counts for female naïve T cells are shown in Fig. 3. (C) Comparison of differentially expressed genes from female and male fetal lung fibroblasts. The NES and FDR q values are shown for chrX q13 region, which had the greatest expression difference between samples. The heatmap lists the overexpressed genes in SLE samples from region chrX.q13 and FC values for the genes enriched at the leading edge for female samples.
Fig. 4.
Fig. 4.
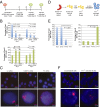
YY1 and hnRNPU localize XIST/Xist RNA to the Xi in stimulated lymphocytes. (A) Experimental design for the knockdown experiments using human T cells. (B) Average percentages (for five experiments) quantifying type I and III XIST RNA patterns after YY1 or hnRNPU knockdown. Statistical significance calculated using Student’s t test. (C) Representative XIST RNA images for activated T cells treated with scrambled siRNA (scr), siRNAs against hnRNPU, and siRNAs against YY1. Nuclear distribution of XIST RNA transcripts for each condition are shown below. (D) Experimental design for YY1 deletion in mouse B cells. (E) Quantification of type I and type III Xist RNA patterns in wild-type and YY1−/− activated B cells. Statistical significance calculated for averages from two independent experiments using Student’s t test. (F) Representative Xist RNA images for wild-type and YY1−/− activated B cells.
Fig. S6.
Fig. S6.
YY1 and hnRNPU expression in female lymphocytes increases with in vitro stimulation. (A) Quantification of hnRNPU and YY1 expression in sorted human CD4+ (unstimulated CD4 T), CD8+ (unstimulated CD8 T) naïve T cells, and during in vitro stimulation of bulk T cells over time. Statistical significance was determined by using Student’s t test, comparing naïve to activated cells (days 3–9). (B) Immunofluorescence detection of hnRNPU and YY1 in naïve and activated human T-cell nuclei. The same exposure time was used for FITC and DAPI channels for imaging naïve and activated T cells. (C) Western blot analysis of YY1 protein levels in wild-type female mouse B cells, naïve and in vitro activated, and YY1 floxed B cells that were activated then infected with TAT-Cre (to delete YY1). Lamin B1 was used as a loading control. (D) Knockdown efficiency of YY1 and hnRNPU in activated human T cells, determined using qPCR and IF. Day 3 samples are naïve human T cells; day 4 samples are activated cells, which were stimulated for 3 d after knockdown. For IF, T cells were nucleofected with siRNAs on the first day, then stimulated for 3 d, and harvested. The experiment was repeated five times by using five different donor samples. IF images were captured by using equal exposure times.
Fig. S7.
Fig. S7.
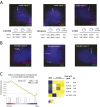
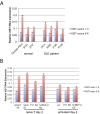
Expression of X-linked genes in human B-cell lines (healthy female and female SLE patients) and sex-specific fetal lung fibroblasts. (A) Relative expression of XIST RNA in SLE patient B-cell lines (2411, 9383, 2190, 6109) and two age-matched healthy control cell lines (6141, 2747) determined using qPCR. (B) qRT-PCR analysis of XIST RNA levels after hnRNP U and YY1 knockdown in naïve and activated female T cells.
Fig. 5.
Fig. 5.
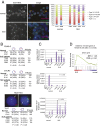
SLE patient B cells have different XIST RNA patterns and greater biallelic expression of immunity-related X-linked genes. (A) XIST (red) and COT1 (green) RNA FISH field images for immortalized B-cell lines from a pediatric SLE patient and a healthy age-matched control. Quantification of XIST RNA localization patterns for SLE B-cell lines and healthy controls. (B) RNA FISH analyses at single-cell resolution for allele-specific expression of CD40LG, CXCR3, and TRL7 in SLE patient and healthy control B-cell lines. (C) qRT-PCR analysis of CD40LG, CXCR3, and TRL7 in SLE and normal B-cell lines. P values were calculated by using Student’s t test. (D) GSEA comparing gene expression differences from the X (chrX.q13) in human female SLE naïve B cells (during inactive disease; 15 samples) to healthy female B cells (7 samples).
Fig. S8.
Fig. S8.
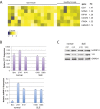
Gene expression differences between SLE patient B cells and healthy controls. (A) GSEA analysis comparing naïve B cells from female SLE patients and healthy controls. The heatmap lists the overexpressed genes in female SLE patients from the chrX.q13 region. FC values for the genes exhibiting greatest expression difference are shown. (B) qRT-PCR quantification of steady-state levels for YY1 and hnRNP U transcripts in SLE patient B-cell lines (same cell lines from Fig. 5). (C) Western blot analysis for YY1 and hnRNP U protein in B-cell lines from female SLE patients and healthy controls.

Similar articles

Cited by

References

    1. Ross MT, et al. The DNA sequence of the human X chromosome. Nature. 2005;434(7031):325–337. - PMC - PubMed
    1. Migeon BR. The role of X inactivation and cellular mosaicism in women’s health and sex-specific diseases. JAMA. 2006;295(12):1428–1433. - PubMed
    1. Spolarics Z. The X-files of inflammation: Cellular mosaicism of X-linked polymorphic genes and the female advantage in the host response to injury and infection. Shock. 2007;27(6):597–604. - PubMed
    1. Butterworth M, McClellan B, Allansmith M. Influence of sex in immunoglobulin levels. Nature. 1967;214(5094):1224–1225. - PubMed
    1. Purtilo DT, Sullivan JL. Immunological bases for superior survival of females. Am J Dis Child. 1979;133(12):1251–1253. - PubMed

Publication types

LinkOut - more resources