. 2016 May;19(5):668-677.
doi: 10.1038/nn.4272. Epub 2016 Mar 21.

C9ORF72 poly(GA) aggregates sequester and impair HR23 and nucleocytoplasmic transport proteins

Affiliations

C9ORF72 poly(GA) aggregates sequester and impair HR23 and nucleocytoplasmic transport proteins

Yong-Jie Zhang et al. Nat Neurosci. 2016 May.

Abstract

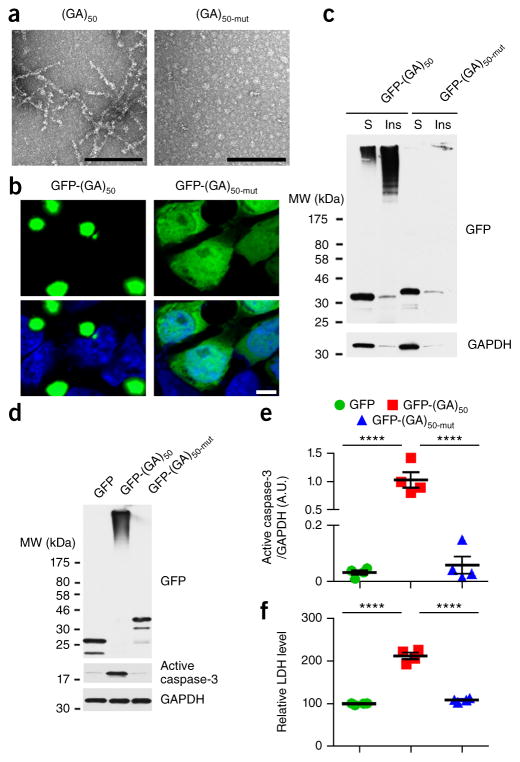
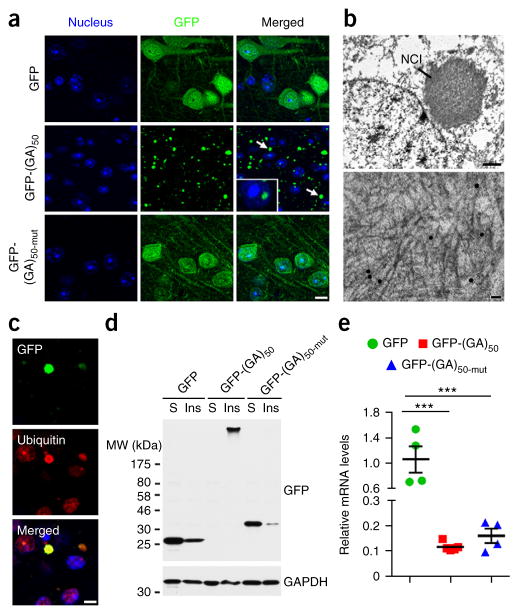
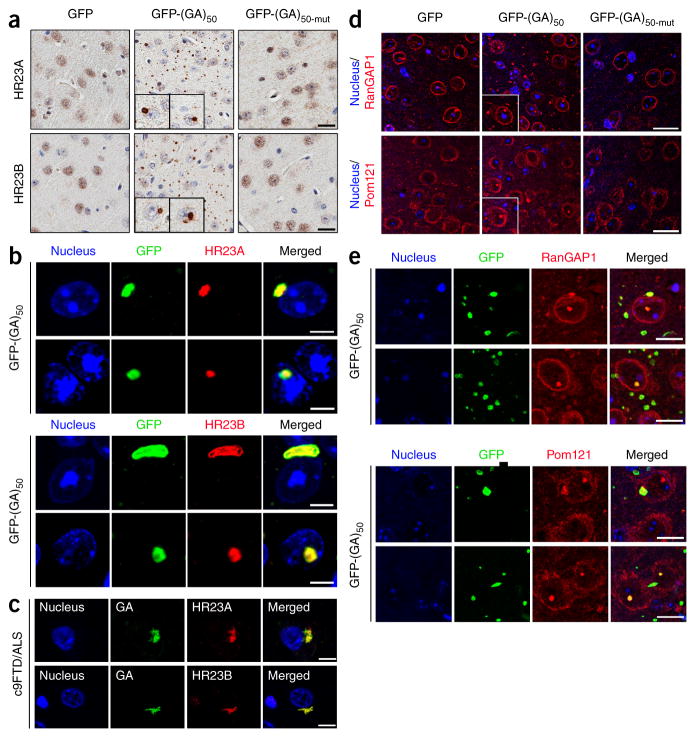
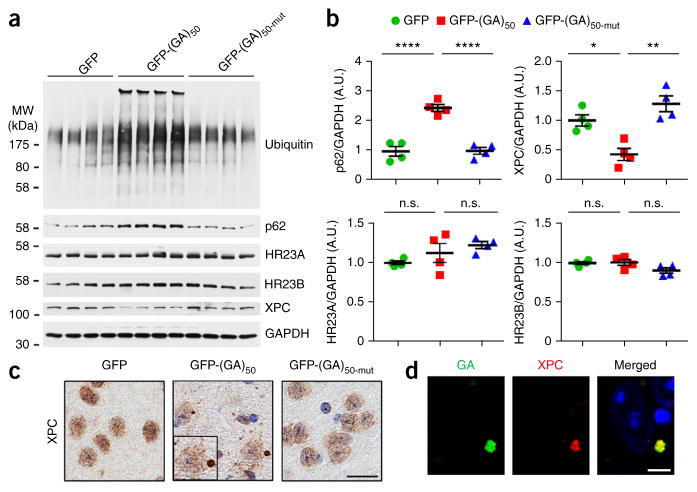
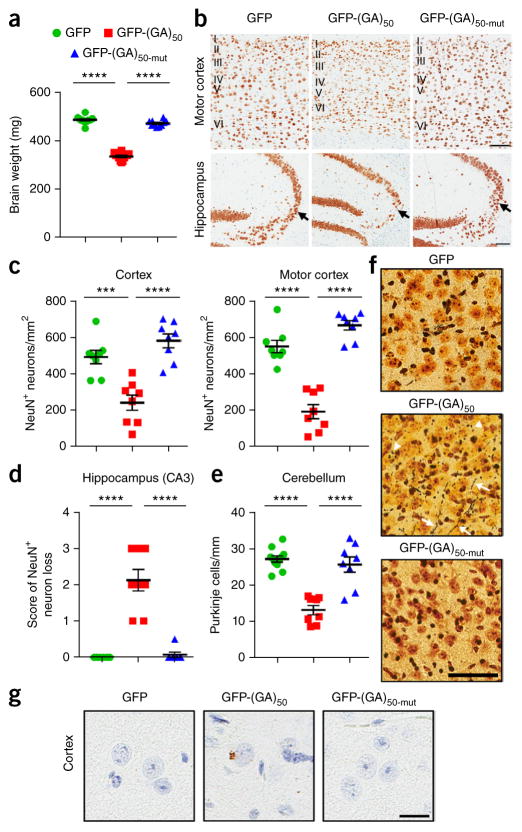
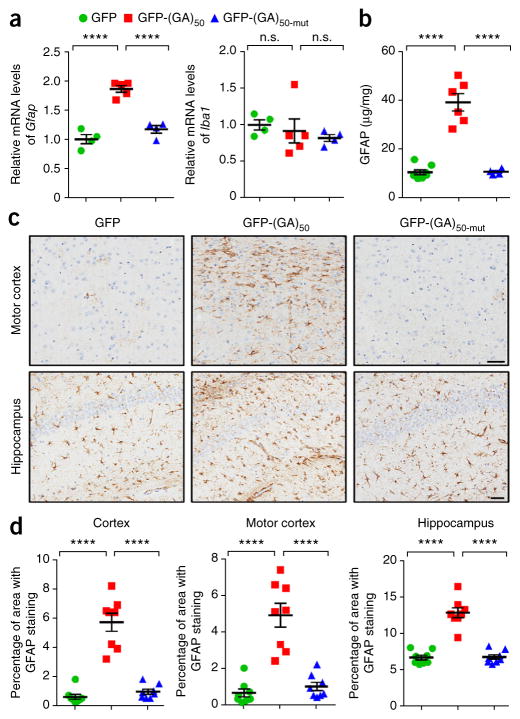
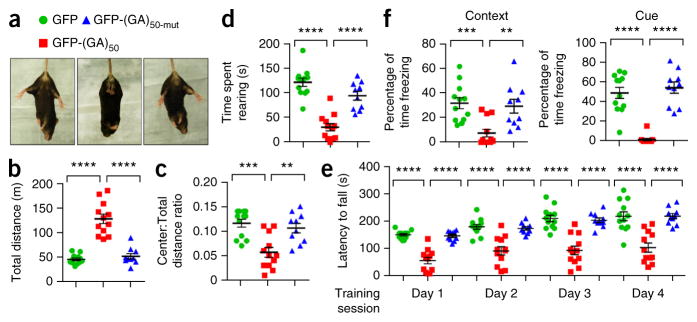
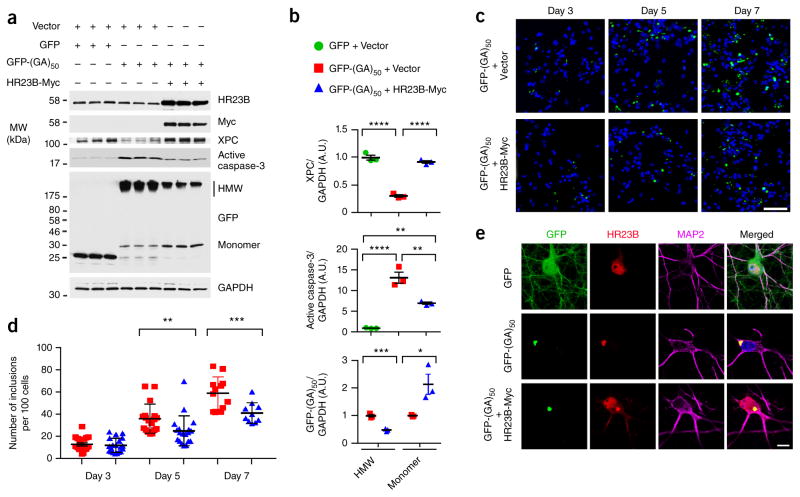
Neuronal inclusions of poly(GA), a protein unconventionally translated from G4C2 repeat expansions in C9ORF72, are abundant in patients with frontotemporal dementia (FTD) and amyotrophic lateral sclerosis (ALS) caused by this mutation. To investigate poly(GA) toxicity, we generated mice that exhibit poly(GA) pathology, neurodegeneration and behavioral abnormalities reminiscent of FTD and ALS. These phenotypes occurred in the absence of TDP-43 pathology and required poly(GA) aggregation. HR23 proteins involved in proteasomal degradation and proteins involved in nucleocytoplasmic transport were sequestered by poly(GA) in these mice. HR23A and HR23B similarly colocalized to poly(GA) inclusions in C9ORF72 expansion carriers. Sequestration was accompanied by an accumulation of ubiquitinated proteins and decreased xeroderma pigmentosum C (XPC) levels in mice, indicative of HR23A and HR23B dysfunction. Restoring HR23B levels attenuated poly(GA) aggregation and rescued poly(GA)-induced toxicity in neuronal cultures. These data demonstrate that sequestration and impairment of nuclear HR23 and nucleocytoplasmic transport proteins is an outcome of, and a contributor to, poly(GA) pathology.


Conflict of interest statement

The authors declare no competing financial interests.

Figures

Figure 1
Figure 1
Disrupting the conformation of poly(GA) proteins inhibits poly(GA) protein aggregation and toxicity. (a) Transmission electron micrographs of purified recombinant untagged (GA)50 and (GA)50-mut proteins. Scale bars, 200 nm. (b) Confocal micrographs of GFP-(GA)50 and GFP-(GA)50-mut proteins expressed in HEK293T cells. Nuclei were counterstained with Hoechst 33258 (blue). Scale bar, 5 μm. (c) Immunoblot analysis of Triton X-100–soluble (S) and –insoluble (Ins) fractions of lysates from HEK293T cells expressing GFP-(GA)50 and GFP-(GA)50-mut. Blots were probed with antibodies specific for GFP. (d,e) Immunoblot (d) and densitometric analysis of immunoblots (e) indicating the levels of GFP-tagged proteins and active caspase-3 in neurons expressing GFP, GFP-(GA)50 or GFP-(GA)50-mut. GAPDH was used as a loading control in c and d. Full-length immunoblots are presented in Supplementary Figure 9. (f) Relative LDH activity, an indicator of cell toxicity, in the culture supernatant of primary neuronal cells expressing the indicated GFP-tagged proteins. Data are presented as mean ± s.e.m. from four separate experiments. P < 0.0001, as analyzed by one-way ANOVA. ****P < 0.0001, Tukey’s post hoc analysis. A.U., Arbitrary units
Figure 2
Figure 2
Expression of poly(GA) proteins in mouse brains results in the formation of ubiquitin-positive poly(GA) inclusions. (a) Confocal microscopy of mouse cortical tissue showing cell nuclei (blue) and the cellular distribution of the indicated GFP-tagged proteins 6 months after postnatal day 0 pups were ICV injected with AAV1 particles expressing GFP, GFP-(GA)50 or GFP-(GA)50-mut. Cytoplasmic (arrows) and intranuclear (inset) poly(GA) inclusions were observed. Scale bar, 10 μm. (b) Immunoelectron microscopy using an anti-GA antibody labeled with gold particles, showing neuronal cytoplasmic inclusion (NCI) composed of fibrils. Scale bar, 1 μm (top) and 50 nm (bottom). (c) Double immunofluorescence staining of cortex from GFP-(GA)50–transduced mice showing GFP- and ubiquitin-positive inclusions. Scale bar, 5 μm. (d) Immunoblot analysis of Triton X-100–soluble (S) and –insoluble (Ins) fractions from brain lysates of mice expressing GFP, GFP-(GA)50 or GFP-(GA)50-mut. Blots were probed with antibodies specific for GFP. GAPDH was used as a loading control. Full-length immunoblots are presented in Supplementary Figure 9. (e) Quantitative real-time PCR analysis of relative mRNA levels of the indicated GFP-tagged proteins in brains of mice expressing GFP, GFP-(GA)50 or GFP-(GA)50-mut (n = 4–5 per group). Data are presented as mean ± s.e.m. P = 0.0002, one-way ANOVA. ***P = 0.0003 (GFP mice versus GFP-(GA)50 mice) and ***P = 0.0007 (GFP mice versus GFP-(GA)50-mut mice), Tukey’s post hoc analysis.
Figure 3
Figure 3
Poly(GA) proteins sequester HR23 and nucleocytoplasmic transport proteins into inclusions. (a) Immunohistochemical analysis of HR23A and HR23B proteins in the cortex of mice expressing GFP, GFP-(GA)50 and GFP-(GA)50-mut. Insets, higher magnification examples of cytoplasmic and nuclear inclusions containing HR23 proteins. Scale bars, 20 μm. (b) Double immunofluorescence staining for GFP-(GA)50 and either HR23A or HR23B in the cortex of mice expressing GFP-(GA)50. Scale bars, 5 μm. (c) Double immunofluorescence staining for poly(GA) and either HR23A or HR23B in the hippocampus of c9FTD/ALS subjects. Scale bars, 10 μm. (d) Immunofluorescence staining of RanGAP1 and Pom121 in the cortex of mice expressing GFP, GFP-(GA)50 or GFP-(GA)50-mut. Insets, higher magnification examples of cytoplasmic and nuclear inclusions containing RanGAP1 or Pom121. Scale bars, 20 μm. (e) Double immunofluorescence staining for GFP-(GA)50 and either RanGAP1 or Pom121 in the cortex of mice expressing GFP-(GA)50. Scale bars, 10 μm.
Figure 4
Figure 4
Poly(GA) proteins cause ubiquitinated proteins to accumulate, decrease the stability of XPC proteins, and sequester XPC into inclusions. (a,b) Immunoblot (a) and densitometric analysis of immunoblots (b) for the indicated proteins to determine their expression in brains of mice expressing GFP, GFP-(GA)50 or GFP-(GA)50-mut (n = 4 per group). Data are presented as mean ± s.e.m. Top left: P < 0.0001, one-way ANOVA; ****P < 0.0001, Tukey’s post hoc analysis. Top right: P = 0.0012, one-way ANOVA; *P = 0.0129 and **P = 0.0010, Tukey’s post hoc analysis. Bottom left: P = 0.1599, one-way ANOVA. Bottom right: P = 0.0820, one-way ANOVA. n.s., not significant. Full-length immunoblots are presented in Supplementary Figure 9. (c) Immunohistochemical analyses of XPC in the cortex of GFP, GFP-(GA)50 or GFP-(GA)50-mut mice. Scale bar, 20 μm. (d) Double immunofluorescence staining for XPC and poly(GA) proteins in the cortex of mice expressing GFP-(GA)50. Scale bar, 5 μm.
Figure 5
Figure 5
Poly(GA) mice develop brain atrophy, neuronal loss and neurodegeneration. (a) Mean brain weight of 6-month-old mice expressing GFP, GFP-(GA)50 or GFP-(GA)50-mut (n = 10–12 mice). (b) Representative images of NeuN-labeled cells in the motor cortex and hippocampus of GFP, GFP-(GA)50 or GFP-(GA)50-mut mice. Layers I to VI of the motor cortex are indicated, and the CA3 region of the hippocampus is indicated by an arrow. Scale bars, 100 μm. (c) Quantification of the number of NeuN-positive cells in the cortex (left) or motor cortex (right) of mice expressing GFP, GFP-(GA)50 or GFP-(GA)50-mut (n = 8 per group). (d) Semiquantitative analysis of NeuN-positive cells in the CA3 region of the hippocampus of mice (score 0: none; 1: mild; 2: modest; 3: severe) (n = 8 per group). (e) Quantification of the number of Purkinje cells in the cerebellum of mice expressing GFP, GFP-(GA)50 or GFP-(GA)50-mut (n = 8 per group). (f) Silver staining of cortex of GFP, GFP-(GA)50 or GFP-(GA)50-mut mice identifying argyrophilic degenerating neurites (arrows) and neuronal cell bodies (arrowheads). Scale bar, 60 μm. (g) Immunohistochemical analysis of phosphorylated TDP-43 in the brains of mice expressing GFP, GFP-(GA)50 or GFP-(GA)50-mut. Scale bar, 20 μm. Data are presented as mean ± s.e.m. In a: P < 0.0001, one-way ANOVA; ****P < 0.0001, Tukey’s post hoc analysis. In ce: P < 0.0001, one-way ANOVA; ***P = 0.0005 and ****P < 0.0001, Tukey’s post hoc analysis.
Figure 6
Figure 6
Astrogliosis is observed in poly(GA) mouse brain. (a) Quantitative real-time PCR analysis of the relative mRNA levels of the astrocyte marker Gfap (left) and the microglial marker Iba1 (right) in brains of mice expressing GFP, GFP(GA)50 or GFP-(GA)50-mut (n = 4–5 per group). (b) GFAP protein levels in mice expressing the indicated GFP-tagged proteins, as assessed by ELISA (n = 4–8 mice per group). (c) Representative images of GFAP staining to identify reactive astrocytes in the motor cortex and hippocampus of mice encoding GFP, GFP-(GA)50 or GFP-(GA)50-mut. Scale bars, 50 μm. (d) Quantification of astrogliosis, analyzed by measuring GFAP-positivity in the cortex, motor cortex or hippocampus of mid-sagittal brain sections using a positive pixel count algorithm (n = 8 per group). Data are presented as mean ± s.e.m. In a (left), b and d: P < 0.0001, one-way ANOVA; ****P < 0.0001, as assessed by Tukey’s post hoc analysis. In a (right): P = 0.6106, one-way ANOVA. n.s., not significant.
Figure 7
Figure 7
Poly(GA) mice develop motor deficits, hyperactivity, anxiety and cognitive defects. (a) Response of mice expressing GFP, GFP-(GA)50 or GFP-(GA)50-mut after tail suspension. Splayed hind legs are indicative of a normal escape response. (bd) Results from the open field test analyzing the behavior of mice expressing GFP, GFP-(GA)50 or GFP-(GA)50-mut (n = 10–12 per group), where hyperactivity is indicated by the total distance traveled (b), signs of anxiety are manifested by a decrease in the ratio of distance traveled in the center area to total distance traveled (c), and potential deficits in motor coordination are indicated by a decrease in rearing assessed using raised photobeams (d). (e) Results from a four day rotarod performance test used to determine motor deficits of mice expressing GFP, GFP-(GA)50 and GFP-(GA)50-mut (n = 10–12 per group) by evaluating latency to fall from a rotating rod. (f) In the fear conditioning test, associative learning and memory of mice expressing GFP, GFP-(GA)50 or GFP-(GA)50-mut (n = 10–12 per group) were evaluated by the percent of time freezing in response to an unconditioned (context) or conditioned (cued) stimulus. Data are presented as mean ± s.e.m. In b, d and e: P < 0.0001, one-way ANOVA; ****P < 0.0001, Tukey’s post hoc analysis. In c: P = 0.0001, one-way ANOVA; ***P = 0.0002 and **P = 0.0022, Tukey’s post hoc analysis. In f (left): P = 0.0005, one-way ANOVA; ***P = 0.0009 and **P = 0.0042, as assessed by Tukey’s post hoc analysis. In f (right): P < 0.0001, one-way ANOVA; ****P < 0.0001, Tukey’s post hoc analysis.
Figure 8
Figure 8
Exogenous HR23B attenuates poly(GA) aggregation and poly(GA)-induced neurotoxicity. (a,b) Immunoblot (a) and densitometric analysis of immunoblots (b) for the indicated proteins to determine their levels of expression in primary neurons transduced to express GFP-(GA)50 or GFP in the presence or absence of exogenous Myc-tagged HR23B. Note that HR23B overexpression restores XPC levels, attenuates poly(GA)-induced caspase-3 activation, as well as decreases high-molecular-weight (HMW) poly(GA) species while increasing monomeric poly(GA). Full-length immunoblots are presented in Supplementary Figure 9. (c) Confocal microscopy of GFP-(GA)50 in primary neurons with or without HR23B-Myc coexpression. Nuclei were counterstained with Hoechst 33258 (blue). Scale bar, 50 μm. (d) Graphs showing poly(GA) inclusions in primary neurons expressing GFP-(GA)50 in the presence or absence of exogenous HR23B at 3, 5 or 7 d after transduction. (e) Immunofluorescence staining for GFP, HR23B and MAP2 in primary neurons transduced to express the indicated proteins. Nuclei were counterstained with Hoechst 33258 (blue). Scale bar, 10 μm. Data are presented as mean ± s.e.m. of three separate experiments for b, or as mean ± s.e.m. of counts from 10–20 images for d. In b (top): P < 0.0001, one-way ANOVA; ****P < 0.0001, Tukey’s post hoc analysis. In b (middle): P = 0.0001, one-way ANOVA; ****P < 0.0001 (GFP + vector versus GFP-(GA)50 + vector), **P = 0.0041 (GFP + vector versus GFP-(GA)50 + HR23B-Myc) and **P = 0.0036 (GFP-(GA)50 + vector versus GFP-(GA)50 + HR23B-Myc), Tukey’s post hoc analysis. In b (bottom): ***P = 0.0006 (HMW) and *P = 0.0355 (monomer), unpaired t-test. In d: P < 0.0001, two-way ANOVA; **P = 0.0077 and ***P = 0.0006, Sidak post hoc analysis.

Similar articles

Cited by

References

    1. DeJesus-Hernandez M, et al. Expanded GGGGCC hexanucleotide repeat in noncoding region of C9ORF72 causes chromosome 9p-linked FTD and ALS. Neuron. 2011;72:245–256. - PMC - PubMed
    1. Renton AE, et al. A hexanucleotide repeat expansion in C9ORF72 is the cause of chromosome 9p21-linked ALS-FTD. Neuron. 2011;72:257–268. - PMC - PubMed
    1. Belzil VV, et al. Reduced C9orf72 gene expression in c9FTD/ALS is caused by histone trimethylation, an epigenetic event detectable in blood. Acta Neuropathol. 2013;126:895–905. - PMC - PubMed
    1. Liu EY, et al. C9orf72 hypermethylation protects against repeat expansion-associated pathology in ALS/FTD. Acta Neuropathol. 2014;128:525–541. - PMC - PubMed
    1. Xi Z, et al. Hypermethylation of the CpG island near the G4C2 repeat in ALS with a C9orf72 expansion. Am J Hum Genet. 2013;92:981–989. - PMC - PubMed

MeSH terms