. 2016 Apr 26;133(17):1668-87.
doi: 10.1161/CIRCULATIONAHA.115.017443. Epub 2016 Mar 16.

Doxorubicin Blocks Cardiomyocyte Autophagic Flux by Inhibiting Lysosome Acidification

Affiliations

Doxorubicin Blocks Cardiomyocyte Autophagic Flux by Inhibiting Lysosome Acidification

Dan L Li et al. Circulation. .

Abstract

Background: The clinical use of doxorubicin is limited by cardiotoxicity. Histopathological changes include interstitial myocardial fibrosis and the appearance of vacuolated cardiomyocytes. Whereas dysregulation of autophagy in the myocardium has been implicated in a variety of cardiovascular diseases, the role of autophagy in doxorubicin cardiomyopathy remains poorly defined.

Methods and results: Most models of doxorubicin cardiotoxicity involve intraperitoneal injection of high-dose drug, which elicits lethargy, anorexia, weight loss, and peritoneal fibrosis, all of which confound the interpretation of autophagy. Given this, we first established a model that provokes modest and progressive cardiotoxicity without constitutional symptoms, reminiscent of the effects seen in patients. We report that doxorubicin blocks cardiomyocyte autophagic flux in vivo and in cardiomyocytes in culture. This block was accompanied by robust accumulation of undegraded autolysosomes. We go on to localize the site of block as a defect in lysosome acidification. To test the functional relevance of doxorubicin-triggered autolysosome accumulation, we studied animals with diminished autophagic activity resulting from haploinsufficiency for Beclin 1. Beclin 1(+/-) mice exposed to doxorubicin were protected in terms of structural and functional changes within the myocardium. Conversely, animals overexpressing Beclin 1 manifested an amplified cardiotoxic response.

Conclusions: Doxorubicin blocks autophagic flux in cardiomyocytes by impairing lysosome acidification and lysosomal function. Reducing autophagy initiation protects against doxorubicin cardiotoxicity.

Keywords: autophagy; cardiotoxicity; doxorubicin; drug therapy; myocytes, cardiac.


Figures

Figure 1
Figure 1
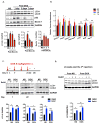
Doxorubicin inhibits autophagic flux in mouse heart. (A) Temporal changes in LC3-II, p62 and Beclin 1 protein levels after one dose of doxorubicin. Hearts were harvested at different time points after IV injection of doxorubicin (5 mg/kg, DOX) or normal saline (NS). Immunoblotting of LC3, p62 and Beclin 1 in heart lysates and quantifications are shown. N = 3–5 mice per group. One-way ANOVA analysis followed by Tukey post hoc test was used to compare doxorubicin-treated animals with control animals. (B) Transcript abundance of multiple autophagy-related genes (including p62/Sqstm1) at different time points after doxorubicin treatment. N = 3–6 mice per group. One-way ANOVA analysis followed by Tukey post hoc test was used to compare doxorubicin-treated mice with control mice. (C) Doxorubicin inhibited cardiac autophagic flux. Bafilomycin A1 (1.5 mg/kg, BafA1) was administered 22 hours after one dose of doxorubicin (5 mg/kg) to assess acute autophagic changes, as well as 22 hours and 7 days after 4 serial doxorubicin injections to assess autophagic changes in a chronic doxorubicin model. Immunoblotting of LC3 is shown. N = 4–5 per group. Asterisks on the schematics point to time points of assessment of autophagic flux. Two-way ANOVA analysis followed by Tukey post hoc test was used to compare multiple groups. (D) Autophagic flux was increased in mouse hearts 4 weeks after the fourth injection of DOX. N = 6 per group. Two-way ANOVA analysis followed by Tukey post hoc test was used to compare multiple groups. *, p < 0.05; **, p < 0.01; ns, not significant.
Figure 2
Figure 2
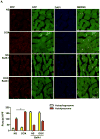
Doxorubicin induces autolysosome accumulation in mouse heart. (A) Representative fluorescence images of heart tissue sections from CAG-RFP-GFP-LC3 transgenic mice 24 hours after one-dose DOX injection. Bafilomycin A1 (1.5 mg/kg, BafA1) was injected intraperitoneally 2 hours before sacrifice. Autophagosome (yellow puncta) and autolysosome (red puncta) numbers in heart after DOX/NS treatment were calculated. N = 4–5 hearts per group with 6 microscopic fields (14,000 μm2) per heart section analyzed. Scale bar, 20 μm. NS, normal saline. DOX, doxorubicin. HPF, high-power field. One-way ANOVA and subsequent Tukey tests were performed for analyzing autophagosome numbers and autolysosome numbers respectively, among different groups. *, p < 0.05.
Figure 3
Figure 3
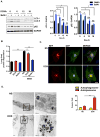
Doxorubicin inhibits autophagic flux in cultured neonatal rat ventricular myocytes (NRVM). (A) Time-dependent blockage of autophagic flux by doxorubicin. Quantification of LC3-II/GAPDH and p62/GAPDH were analyzed in 3 independent experiments. (B) Long-lived protein degradation assay revealed that doxorubicin decreased autophagic protein degradation in NRVM. N = 3 independent experiments in duplicates. (C) Representative fluorescence images of NRVM expressing RFP-GFP-LC3 and treated with DOX for 8 hours. Nuclei were stained with DAPI. Numbers of autophagosomes and autolysosomes in each cell were quantified. N = 40–50 cells per group. Scale bar, 10 μm. (D) Representative transmission electron microscopy images of cardiomyocytes treated overnight with doxorubicin. Arrows, lysosomes/autolysosomes containing electron-dense contents; Arrowhead, autophagosome. Scale bars, 1 μm in left- and 0.5 μm right-side images, respectively. Two-way ANOVA and subsequent Tukey tests were performed for statistical analysis. *, p < 0.05; **, p < 0.01; ns, not significant.
Figure 4
Figure 4
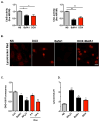
Doxorubicin inhibits lysosomal acidification in NRVM. (A) Doxorubicin inhibited activities of lysosomal enzymes cathepsin B and cathepsin L in live cardiomyocytes examined by FACS. Quantifications were based on 4 independent experiments. (B) Lysotracker Red (DND-99, 100nM for 30 minutes) positive puncta in cytosol was significantly reduced after 8-hour doxorubicin treatment (the nuclear fluorescence in doxorubicin-treated NRVM derives from doxorubicin). Bafilomycin A1 treatment (50 nM for 2 hours) served as a positive control. (C) Doxorubicin decreased Lysosensor DND-189 fluorescence, determined by FACS. Bafilomycin A1 (50 nM for 2 hours) and NH4Cl (10 mM for 0.5 hour) are positive controls. N = 3 independent experiments in duplicates. (D) Doxorubicin (overnight treatment) increased lysosomal pH. Lysosomal pH was examined using Dextran, Oregon Green 514. Bafilomycin A1 and NH4Cl are positive controls. Three independent experiments with a total of 100–120 cells were examined. CtsB, cathepsin B. CtsL, cathespsin L. Scale bar, 10 μm. T-test between NS group and other treatment groups was performed for statistical analysis. *, p < 0.05; **, p < 0.01.
Figure 5
Figure 5
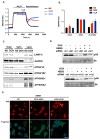
Doxorubicin impairs V-ATPase function in NRVM. (A) Lysosome re-acidification in live cardiomyocytes after NH4Cl-induced alkalinization. Dextran, Oregon Green 514 was used to monitor relative change of lysosomal pH. Representative recordings of the fluorescence ratio of different treatment groups are illustrated. (B) Fluorescence ratios of different treatment groups were compared at different time points (t = 0 s, 1000 s, 2000 s) under basal conditions, during lysosomal alkanization, and during re-acidification. N = 22–25 cells in 5 independent experiments. Repeated measures ANOVA and subsequent Tukey post hoc tests were performed for statistical analysis. *, p < 0.05; **, p < 0.01. (C) Doxorubicin does not affect localization of V1 and V0 subunit proteins on lysosomes. Lysosome-enriched compartments were isolated from NRVM treated overnight with DOX. Immunoblotting of multiple subunits of V1V0 domains revealed no difference between NS and DOX groups. (D) Assembled V-ATPase is required for doxorubicin-induced mTORC1 activation. Knocking down of V-ATPase subunit ATP6V0D1 or ATP6V1B2, abolished doxorubicin-induced mTORC1 activation. (E) Impaired lysosomal acidification triggers oxidative injuries in NRVM. Knocking down of V-ATPase subunit ATP6V0D1 or ATP6V1B2 in NRVM increased cellular ROS as tracked by DHE staining.
Figure 6
Figure 6. Beclin 1+/− mice
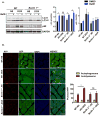
are protected from doxorubicin cardiotoxicity. (A) Autophagic flux inhibition by doxorubicin was rescued in Beclin 1+/− mouse hearts. LC3 and p62 levels were evaluated by Western blotting in hearts 24 hours after doxorubicin (5 mg/kg) injection, with or without BafA1 treatment. N = 4 per group. Two-way ANOVA and subsequent Tukey tests were performed for statistical analysis. *, p < 0.05; ns, not significant. (B) Representative fluorescence imaging of heart tissue sections from CAG-RFP-GFP-LC3 transgenic mice or Beclin 1+/−/CAG-RFP-GFP-LC3 24 hours after DOX injection. Autophagosome (yellow puncta) and autolysosome numbers (red puncta) were quantified with 6 microscopic fields (14,000 μm2) per heart section. N = 4 mice per group. Scale bar, 20 μm. One-way ANOVA and subsequent Tukey tests were performed for analyzing autophagosome numbers and autolysosome numbers respectively, among different groups. *, p < 0.05. (C) Cardiac function was preserved in doxorubicin-treated Beclin 1+/− mice compared to WT mice. Representative echocardiograms from WT and Beclin 1+/− mice treated with NS and DOX, taken 1 day before sacrifice, are shown. N = 7–8 mice per group. Repeated measures ANOVA analysis followed by Tukey post hoc test was used to compare multiple groups at each time point. * p < 0.05, DOX-treated WT mice compared to NS-treated WT mice. # p < 0.05, DOX-treated Beclin 1+/− mice compared with DOX-treated WT mice. Scale bar, 0.1 s, 5 mm. (D) Beclin 1+/− mice showed less pathological cardiac remodeling after chronic doxorubicin treatment, examined by relative mRNA levels of fetal genes and fibrotic genes. N = 6–7 per group. One-way ANOVA analysis followed by Tukey post hoc test was used to compare multiple groups for each gene. *, p < 0.05; **, p < 0.01. (E) Doxorubicin-induced ROS formation (by DHE staining) was decreased in Beclin 1+/− mice. N = 3 mice per group. Scale bar, 100 μm. HPF, high-power field. Two-way ANOVA analysis followed by Tukey post hoc test was used to compare multiple groups. *, p < 0.05.
Figure 7
Figure 7
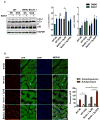
Doxorubicin cardiotoxicity is exacerbated in αMHC-Beclin 1 transgenic mice. (A) Autophagic flux in WT and αMHC-Beclin 1 transgenic (Beclin 1 Tg) mouse hearts examined by immunoblotting LC3 and p62 24 hours after doxorubicin (5 mg/kg) injection, with or without Bafilomycin A1 treatment. N = 4 per group. One-way ANOVA analysis followed by Tukey post hoc test was used to compare multiple groups. Two-way ANOVA analysis followed by Tukey post hoc test was used to compare multiple groups. *, p < 0.05; ns, not significant. (B) Representative fluorescence images of heart tissue sections from CAG-RFP-GFP-LC3 transgenic mice or αMHC-Beclin 1/CAG-RFP-GFP-LC3 mice. Quantification of autophagosome (yellow puncta) and autolysosome numbers (red puncta) was based on 6 microscopic fields (14,000 μm2) per heart section. Scale bar, 20 μm. N = 4 mice per group. One-way ANOVA analysis followed by Tukey post hoc test was used to compare multiple groups for autophagosome numbers and autolysosome numbers respectively. *, p < 0.05. (C) Cardiac function was exacerbated in doxorubicin-treated Beclin 1 Tg mice compared to WT mice. Representative echocardiograms from WT and Beclin 1 Tg mice treated with NS and DOX at week 7 were shown. Scale bar, 0.1 s, 5 mm. N = 8 mice per group. One-way ANOVA analysis followed by Tukey post hoc test was used to compare multiple groups. *, p < 0.05, DOX-treated WT mice compared to NS-treated WT mice; #, p < 0.05, DOX-treated Beclin 1 Tg mice compared with DOX-treated WT mice. *, p < 0.05; ns, not significant. (D) Beclin 1 Tg mice showed exacerbated pathological cardiac remodeling after chronic doxorubicin treatment, examined by relative mRNA levels of fetal genes and fibrotic genes. N = 6 per group. Repeated measures ANOVA analysis followed by Tukey post hoc test was used to compare multiple groups at each time point. *, p < 0.05; **, p < 0.01. (E) Doxorubicin-induced ROS formation (determined by DHE staining of hearts treated with DOX for 20 hours) was decreased in Beclin 1 Tg mice. N = 4 mice per group. Two-way ANOVA analysis followed by Tukey post hoc test was used to compare multiple groups. Scale bar, 100 μm. HPF, high-power field. *, p < 0.05.
Figure 7
Figure 7
Doxorubicin cardiotoxicity is exacerbated in αMHC-Beclin 1 transgenic mice. (A) Autophagic flux in WT and αMHC-Beclin 1 transgenic (Beclin 1 Tg) mouse hearts examined by immunoblotting LC3 and p62 24 hours after doxorubicin (5 mg/kg) injection, with or without Bafilomycin A1 treatment. N = 4 per group. One-way ANOVA analysis followed by Tukey post hoc test was used to compare multiple groups. Two-way ANOVA analysis followed by Tukey post hoc test was used to compare multiple groups. *, p < 0.05; ns, not significant. (B) Representative fluorescence images of heart tissue sections from CAG-RFP-GFP-LC3 transgenic mice or αMHC-Beclin 1/CAG-RFP-GFP-LC3 mice. Quantification of autophagosome (yellow puncta) and autolysosome numbers (red puncta) was based on 6 microscopic fields (14,000 μm2) per heart section. Scale bar, 20 μm. N = 4 mice per group. One-way ANOVA analysis followed by Tukey post hoc test was used to compare multiple groups for autophagosome numbers and autolysosome numbers respectively. *, p < 0.05. (C) Cardiac function was exacerbated in doxorubicin-treated Beclin 1 Tg mice compared to WT mice. Representative echocardiograms from WT and Beclin 1 Tg mice treated with NS and DOX at week 7 were shown. Scale bar, 0.1 s, 5 mm. N = 8 mice per group. One-way ANOVA analysis followed by Tukey post hoc test was used to compare multiple groups. *, p < 0.05, DOX-treated WT mice compared to NS-treated WT mice; #, p < 0.05, DOX-treated Beclin 1 Tg mice compared with DOX-treated WT mice. *, p < 0.05; ns, not significant. (D) Beclin 1 Tg mice showed exacerbated pathological cardiac remodeling after chronic doxorubicin treatment, examined by relative mRNA levels of fetal genes and fibrotic genes. N = 6 per group. Repeated measures ANOVA analysis followed by Tukey post hoc test was used to compare multiple groups at each time point. *, p < 0.05; **, p < 0.01. (E) Doxorubicin-induced ROS formation (determined by DHE staining of hearts treated with DOX for 20 hours) was decreased in Beclin 1 Tg mice. N = 4 mice per group. Two-way ANOVA analysis followed by Tukey post hoc test was used to compare multiple groups. Scale bar, 100 μm. HPF, high-power field. *, p < 0.05.
Figure 8
Figure 8
Working model. Doxorubicin, by inhibiting lysosomal acidification and lysosomal function, blocks cardiomyocyte autophagic flux. Accumulation of autolysosomes leads to increased ROS production and cardiac injury. Slowing autophagy initiation by decreasing Beclin 1 partially rescues the autophagic flux blockage and protects heart from cardiotoxicity; conversely, increasing autophagosome formation exacerbates autophagic flux inhibition and increases doxorubicin cardiotoxicity.

Similar articles

Cited by

References

    1. Singal PK, Deally CM, Weinberg LE. Subcellular effects of adriamycin in the heart: A concise review. J Mol Cell Cardiol. 1987;19:817–828. - PubMed
    1. Lipshultz SE, Colan SD, Gelber RD, Perez-Atayde AR, Sallan SE, Sanders SP. Late cardiac effects of doxorubicin therapy for acute lymphoblastic leukemia in childhood. N Engl J Med. 1991;324:808–815. - PubMed
    1. Octavia Y, Tocchetti CG, Gabrielson KL, Janssens S, Crijns HJ, Moens AL. Doxorubicin-induced cardiomyopathy: From molecular mechanisms to therapeutic strategies. J Mol Cell Cardiol. 2012;52:1213–1225. - PubMed
    1. Zhang S, Liu X, Bawa-Khalfe T, Lu LS, Lyu YL, Liu LF, Yeh ET. Identification of the molecular basis of doxorubicin-induced cardiotoxicity. Nat Med. 2012;18:1639–1642. - PubMed
    1. Ichikawa Y, Ghanefar M, Bayeva M, Wu R, Khechaduri A, Naga Prasad SV, Mutharasan RK, Naik TJ, Ardehali H. Cardiotoxicity of doxorubicin is mediated through mitochondrial iron accumulation. J Clin Invest. 2014;124:617–630. - PMC - PubMed

Publication types