. 2016 Mar 15;30(6):660-72.
doi: 10.1101/gad.274910.115. Epub 2016 Mar 10.

Nucleosome repositioning underlies dynamic gene expression

Affiliations

Nucleosome repositioning underlies dynamic gene expression

Nicolas Nocetti et al. Genes Dev. .

Abstract

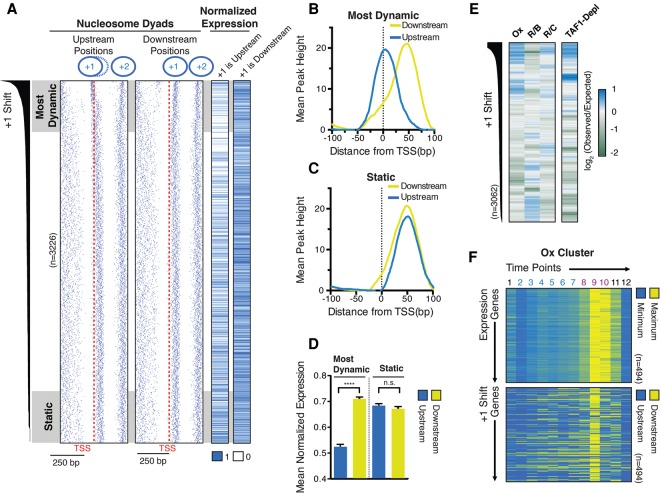
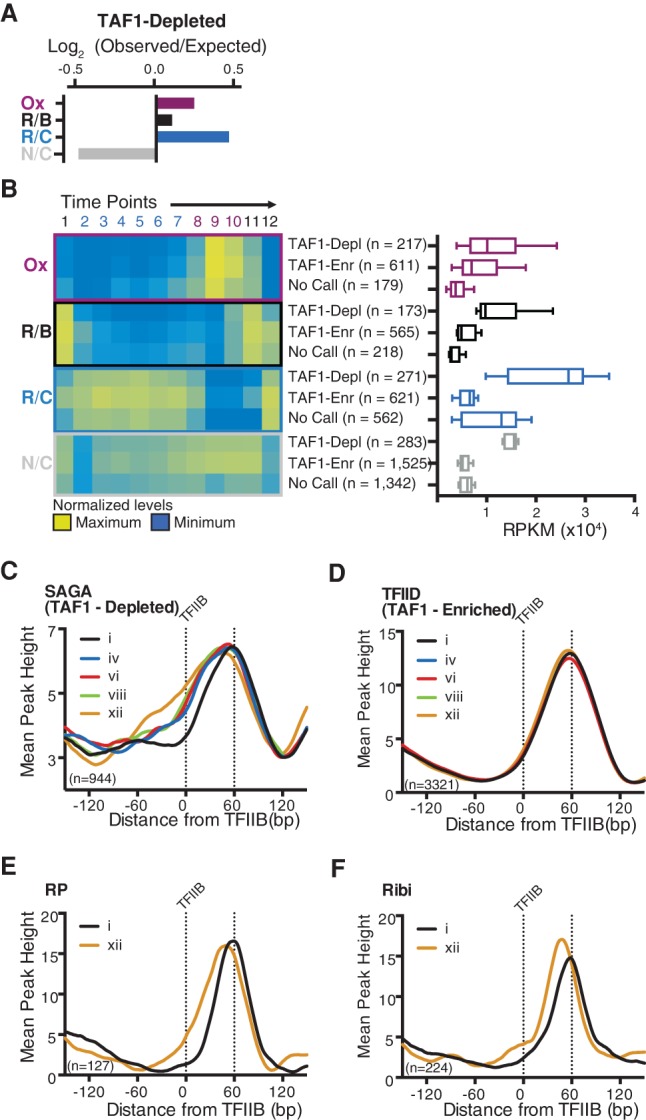
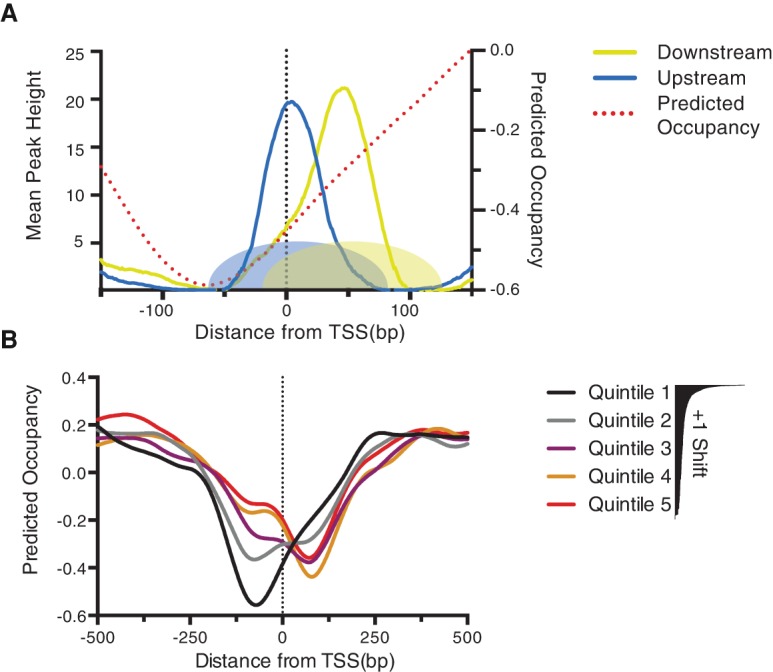
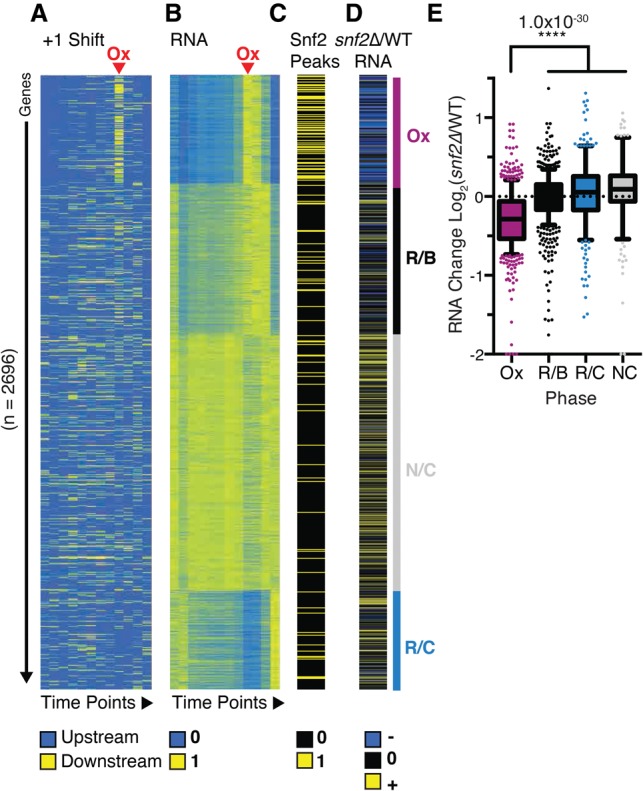
Nucleosome repositioning at gene promoters is a fundamental aspect of the regulation of gene expression. However, the extent to which nucleosome repositioning is used within eukaryotic genomes is poorly understood. Here we report a comprehensive analysis of nucleosome positions as budding yeast transit through an ultradian cycle in which expression of >50% of all genes is highly synchronized. We present evidence of extensive nucleosome repositioning at thousands of gene promoters as genes are activated and repressed. During activation, nucleosomes are relocated to allow sites of general transcription factor binding and transcription initiation to become accessible. The extent of nucleosome shifting is closely related to the dynamic range of gene transcription and generally related to DNA sequence properties and use of the coactivators TFIID or SAGA. However, dynamic gene expression is not limited to SAGA-regulated promoters and is an inherent feature of most genes. While nucleosome repositioning occurs pervasively, we found that a class of genes required for growth experience acute nucleosome shifting as cells enter the cell cycle. Significantly, our data identify that the ATP-dependent chromatin-remodeling enzyme Snf2 plays a fundamental role in nucleosome repositioning and the expression of growth genes. We also reveal that nucleosome organization changes extensively in concert with phases of the cell cycle, with large, regularly spaced nucleosome arrays being established in mitosis. Collectively, our data and analysis provide a framework for understanding nucleosome dynamics in relation to fundamental DNA-dependent transactions.

Keywords: SWI/SNF; chromatin; nucleosome; transcription.


Figures

Figure 1.
Figure 1.
Dynamic transcription and nucleosomes through the YMC. (A) Example of respiratory oscillations during continuous culture. Level of DO (DO%) indicates whether cells are in Ox or reductive growth phases. The arrowhead specifies when the continuous addition of fresh medium was begun. (B) Individual oscillation from which samples were taken. Numbered dots indicate the 12 time points sampled. (C) Outline describing the processing of samples for RNA-seq and MNase sequencing (MNase-seq). (D) k-means clustering of normalized RNA-seq data showing a heat map of the three periodically transcribed classes of transcript: R/C, Ox, and R/B. (E) Heat map showing the location of mapped nucleosome for each time point at the TEA1 locus. Black boxes above represent nucleosomes; by convention, +1 lies adjacent to the transcription start site (TSS). Nucleosome repositioning occurs at time point 9, which is coincident with maximal transcription (shown at the right).
Figure 2.
Figure 2.
Dynamic positioning of +1 nucleosomes correlates to gene transcription. (A) Heat maps of the position of nucleosome dyads when furthest upstream of and downstream from the TSS as defined by Pelechano et al. (2013). Promoters are arranged by decreasing variability of +1 nucleosome positioning from top to bottom, indicated by +1 shift at the far left. Only genes with an annotated TSS and a +1 nucleosome for all 12 time points are included in this and subsequent analyses. n = 3226. Normalized expression levels for each gene when nucleosomes are furthest upstream or downstream are shown as heat maps at the right. (B,C) Distance from the TSS to the nucleosome dyad for “dynamic” (B) and “static” (C) promoters when the nucleosome is furthest upstream (upstream) and downstream (downstream) across 12 time points. (D) Analysis of normalized RNA (RPKM [reads per kilobase per million mapped reads]) values of “dynamic” and “static” promoters when +1 nucleosomes occupy their farthest upstream and downstream positions. Error bars represent the SEM. (****) P-value < 0.0001. (E) Log2 (observed/expected) examining the enrichment of “dynamic” and “static” promoters in each of the three periodically transcribed clusters. Promoters are arranged by +1 shift and compiled into 100 gene bins. (F) Heat maps illustrating the correlation between +1 nucleosome positioning and gene expression of the Ox cluster; expression and nucleosome position changes for each gene are normalized to the same range. n = 494.
Figure 3.
Figure 3.
Dynamic gene expression and chromatin structure at SAGA and TFIID promoters. (A) Log2 (observed/expected) values for TAF1-depleted genes belonging to clusters exhibiting cyclic (Ox, R/B, and R/C) and noncyclic (N/C) expression. (B) Transcript abundance through the YMC for TAF1-depleted (TAF1-Depl), TAF1-enriched (TAF1-Enr), and unclassified (No Call) promoters. The heat map (left) displays normalized expression levels, and the box plot (right) shows maximum transcript abundance for genes in each category. (C,D) Nucleosome dyads plotted against TFIIB-binding sites as mapped by Rhee and Pugh (2012) with respect to transcriptional output at TAF1-depleted (SAGA) and TAF-enriched (TFIID) genes; expression at each time point is ranked from i (maximum) to xii (minimum). (E,F) Nucleosome dyads plotted against TFIIB-binding sites (Rhee and Pugh 2012) with respect to transcriptional output of ribosomal protein (RP) genes (E) and ribosomal biosynthesis (Ribi) genes (F).
Figure 4.
Figure 4.
A DNA signature for nucleosome repositioning. (A) +1 nucleosome dyads at maximum upstream or downstream positions for dynamic promoters compared with the predicted nucleosome occupancy as calculated by Kaplan et al. (2009) (right Y-axis). Shapes at the bottom of the graph represent the space occupied by nucleosome at upstream (blue) and downstream (yellow) positions. (B) All promoters were ranked according to the degree of +1 shift (as in Fig. 2A) and then separated into quintiles with the most nucleosome shift (quintile 1) and least (quintile 5). Predicated occupancy is then plotted for each quintile with respect to the TSS.
Figure 5.
Figure 5.
Histone PTMs and chromatin remodeling factors at dynamic and static promoters. (A) Heat maps illustrating the association between +1 shift and features of gene transcription and chromatin structure. n = 3226. All data are ranked according to the degree of +1 shift, illustrated at the left. Htz1 enrichment (Weiner et al. 2015), TAF1 depletion (Rhee and Pugh 2012), range of expression, and H3 exchange (Dion et al. 2007) all scale accordingly in relation to +1 nucleosome shift. (Right panel) Snf2-enriched regions from Parnell et al. (2015) near the TSS at promoters ranked by +1 nucleosome shift. (B) Bar graphs demonstrating the depletion of H4K5ac, H4K8ac, H4K12ac, and Htz1 (Weiner et al. 2015) at +1 nucleosomes at “dynamic” promoters. Error bars represent SEM. (****) P-value < 0.00001. (C,D) Box plot analysis of +1 nucleosome shift associated with promoters bound and not bound by various chromatin remodeling factors. (****) P-value < 0.00001; (**) P-value < 0.001; (*) P-value < 0.01. Factor occupancy data are from Yen et al. (2012) (C) and Parnell et al. (2015) (D). (E) Analysis of Snf2 enrichment at Ox, R/B, R/C, and noncycling (N/C) promoters; numbers in brackets represent the expected proportions (data are from Parnell et al. 2015). (F) Analysis of Snf2 enrichment at TAF1-depleted and TAF1-enriched promoters; numbers in brackets represent the expected proportions (data are from Parnell et al. 2015).
Figure 6.
Figure 6.
Snf2 controls expression of the Ox cluster by remodeling of +1 nucleosomes. (A) Normalized +1 shift for each gene through 12 time points. n = 2696. Data are separated into YMC superclusters according to RNA expression. Ox genes are highlighted by the purple bar. (B) Gene expression is shown by normalized RPKM values from RNA-seq. (C) Peaks of Snf2 binding within 100 bp upstream of and downstream from TSSs (Parnell et al. 2015). (D) Change in transcript abundance as a result of snf2Δ in minimal medium (Sudarsanam et al. 2000). (E) Relative change in RNA abundance in each of the superclusters in a snf2Δ mutant (Sudarsanam et al. 2000).
Figure 7.
Figure 7.
Global alteration in chromatin through the YMC. (A) Heat map demonstrating nucleosome occupancy and organization changes at the HCA4 promoter and gene body. (B) Frequency of internucleosome distances (dyad–dyad) in R/B, early R/C (R/C E), late R/C (R/C L), and Ox. (C,D) Heat maps illustrating the variation in nucleosome positioning across gene lengths with respect to transcriptional activity. n = 2696. (E) The genome was segmented into 5-kb bins, and the standard deviation (SD) of internucleosomeal distances was calculated for each gene bin. n = 2423 bins. Data are aligned with respect to chromosomal position, denoted at the left. (F) Normalized transcript levels are shown for key cyclins and cyclin-dependent kinase (CDK); cyclin expression signifies major cell cycle stages. (G) Number of nucleosome arrays with ≥10 nucleosomes at each time point; arrays are defined as consecutive nucleosomes with a repeat length between 155 and 175 bp.

Similar articles

Cited by

References

    1. Altaf M, Auger A, Monnet-Saksouk J, Brodeur J, Piquet S, Cramet M, Bouchard N, Lacoste N, Utley RT, Gaudreau L, et al. 2010. NuA4-dependent acetylation of nucleosomal histones H4 and H2A directly stimulates incorporation of H2A.Z by the SWR1 complex. J Biol Chem 285: 15966–15977. - PMC - PubMed
    1. Anderson JD, Thastrom A, Widom J. 2002. Spontaneous access of proteins to buried nucleosomal DNA target sites occurs via a mechanism that is distinct from nucleosome translocation. Mol Cell Biol 22: 7147–7157. - PMC - PubMed
    1. Badis G, Chan ET, van Bakel H, Pena-Castillo L, Tillo D, Tsui K, Carlson CD, Gossett AJ, Hasinoff MJ, Warren CL, et al. 2008. A library of yeast transcription factor motifs reveals a widespread function for Rsc3 in targeting nucleosome exclusion at promoters. Mol Cell 32: 878–887. - PMC - PubMed
    1. Cai L, Tu BP. 2012. Driving the cell cycle through metabolism. Annu Rev Cell Dev Biol 28: 59–87. - PubMed
    1. Cai L, Sutter BM, Li B, Tu BP. 2011. Acetyl-CoA induces cell growth and proliferation by promoting the acetylation of histones at growth genes. Mol Cell 42: 426–437. - PMC - PubMed

Publication types

MeSH terms