. 2016 Mar 9;36(10):2926-44.
doi: 10.1523/JNEUROSCI.2513-15.2016.

Absence of Prenatal Forebrain Defects in the Dp(16)1Yey/+ Mouse Model of Down Syndrome

Affiliations

Absence of Prenatal Forebrain Defects in the Dp(16)1Yey/+ Mouse Model of Down Syndrome

Joseph W Goodliffe et al. J Neurosci. .

Abstract

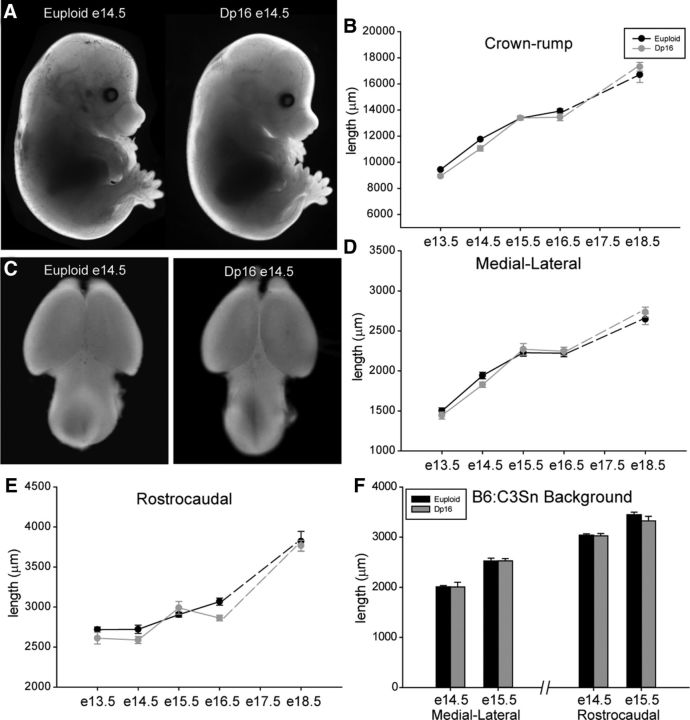
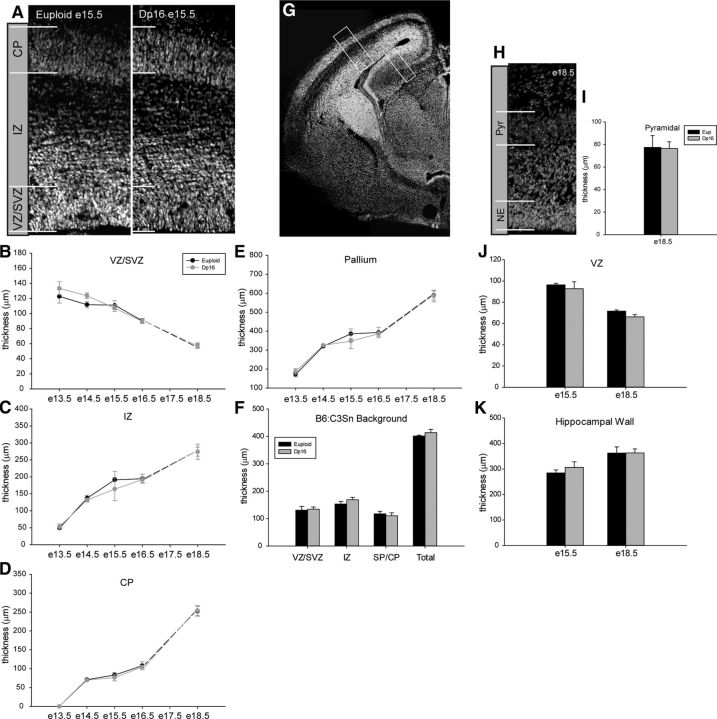
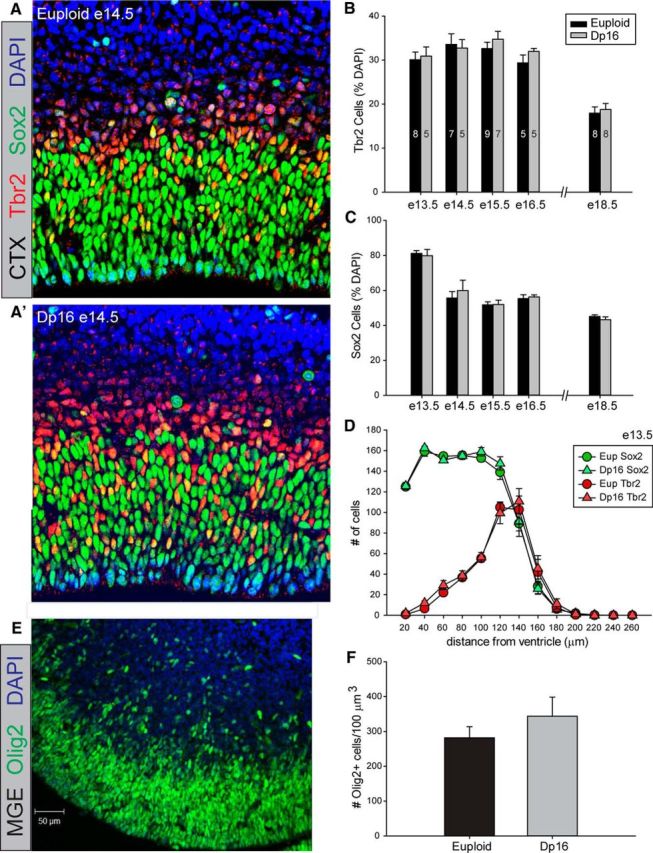
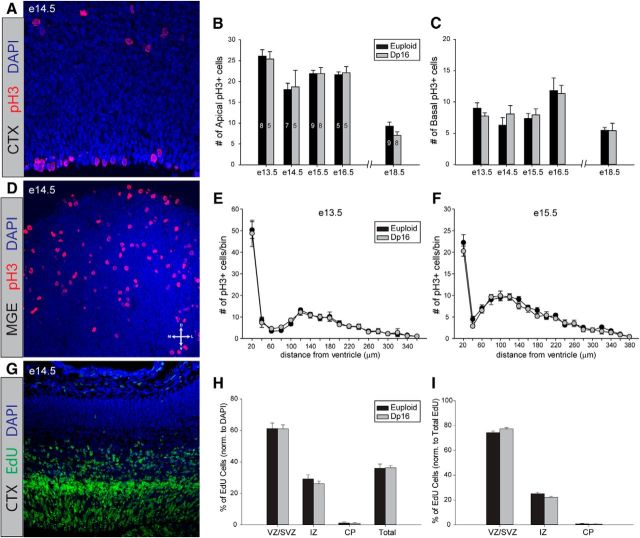
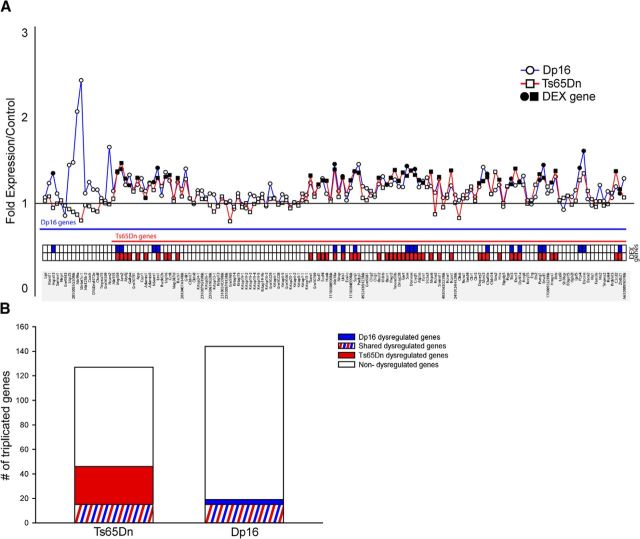
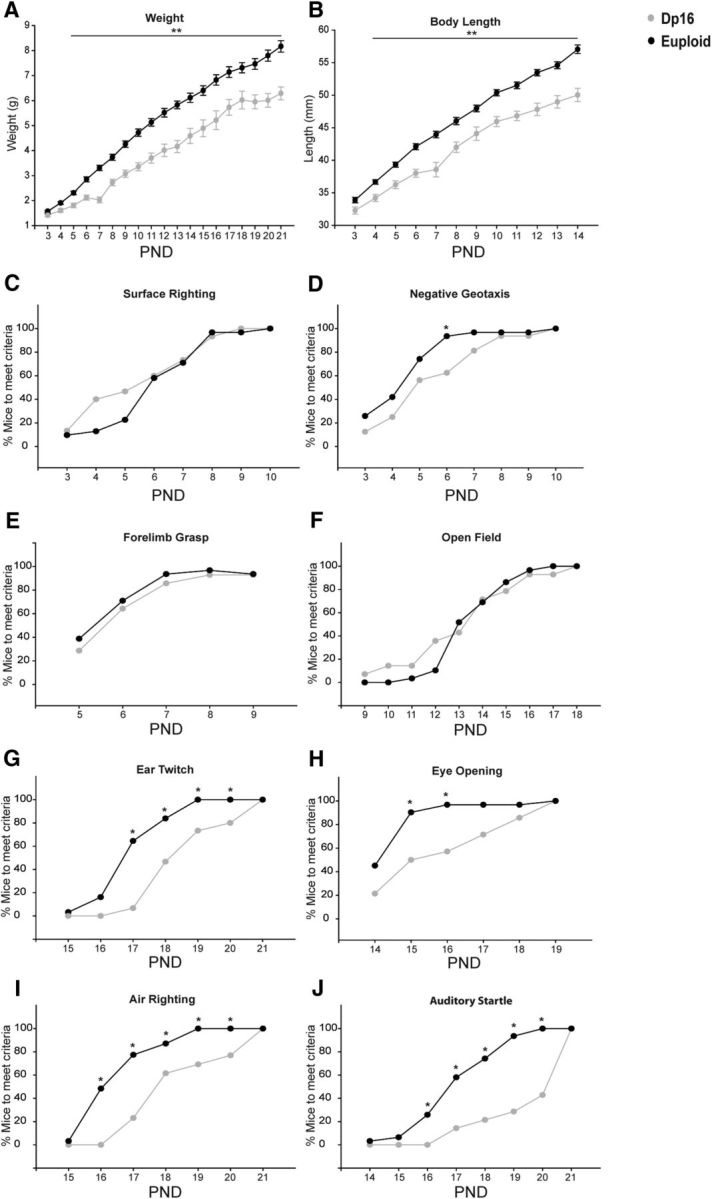
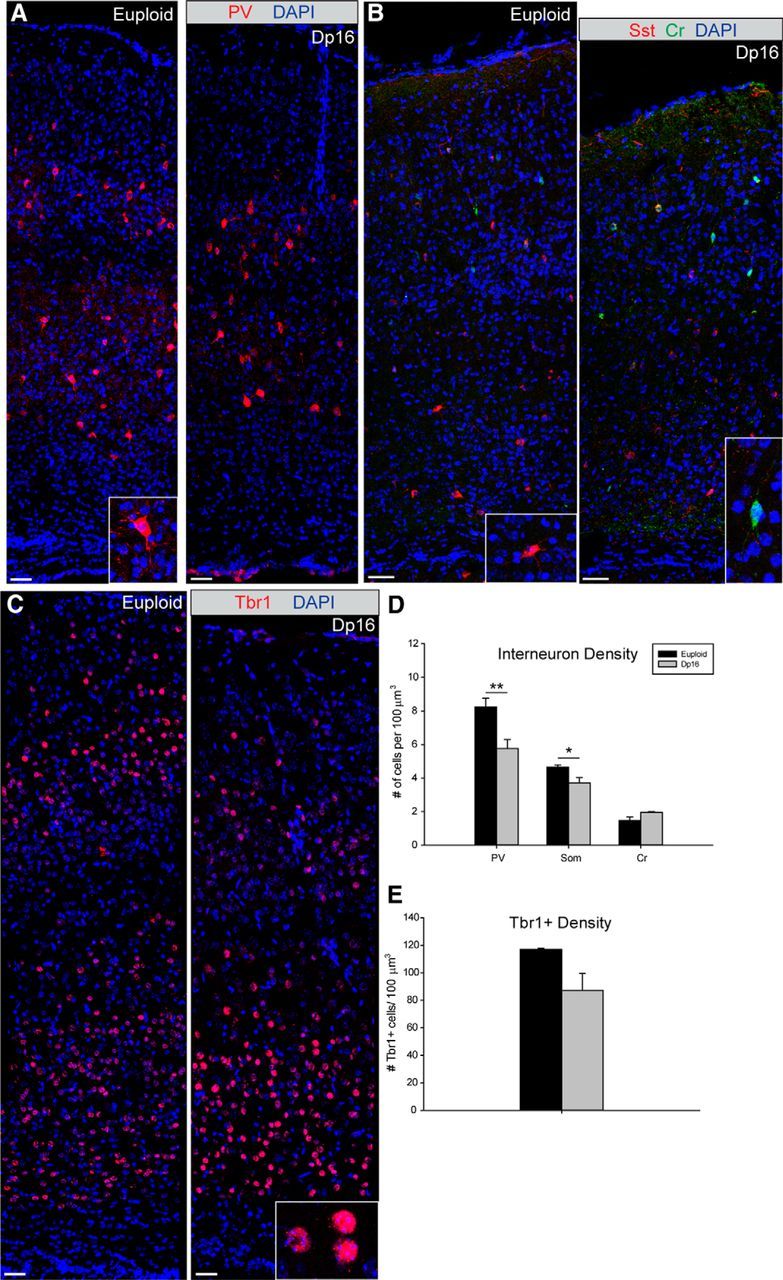
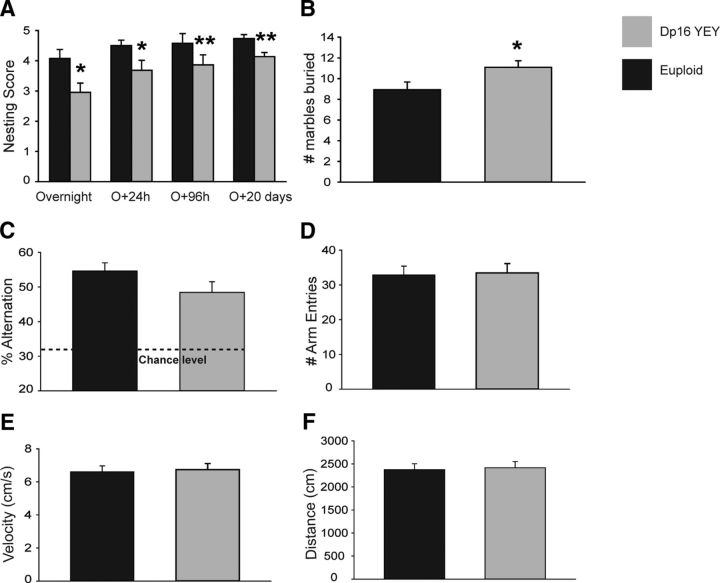
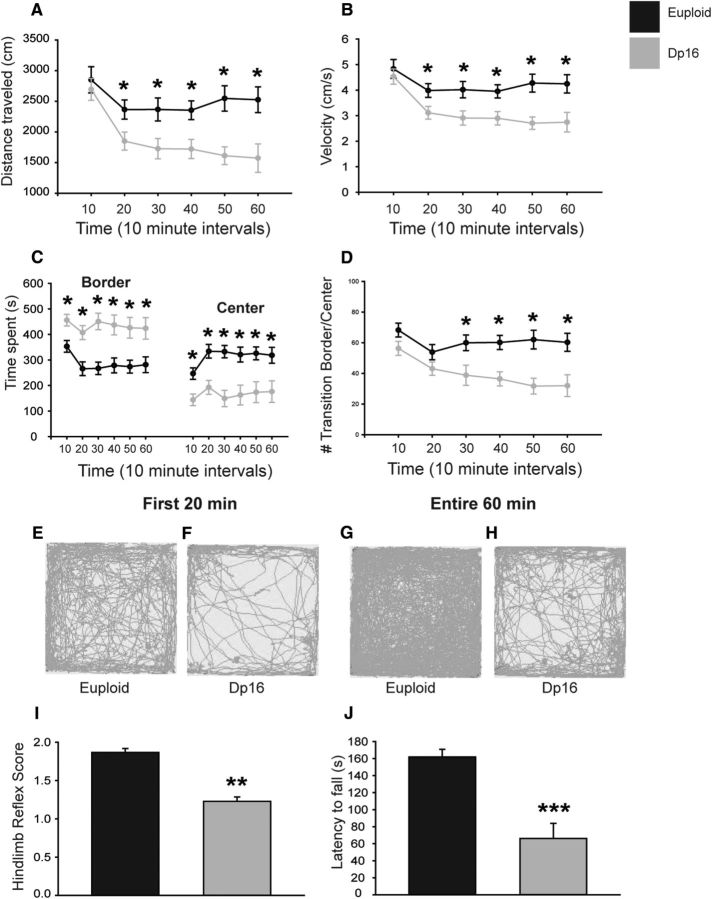
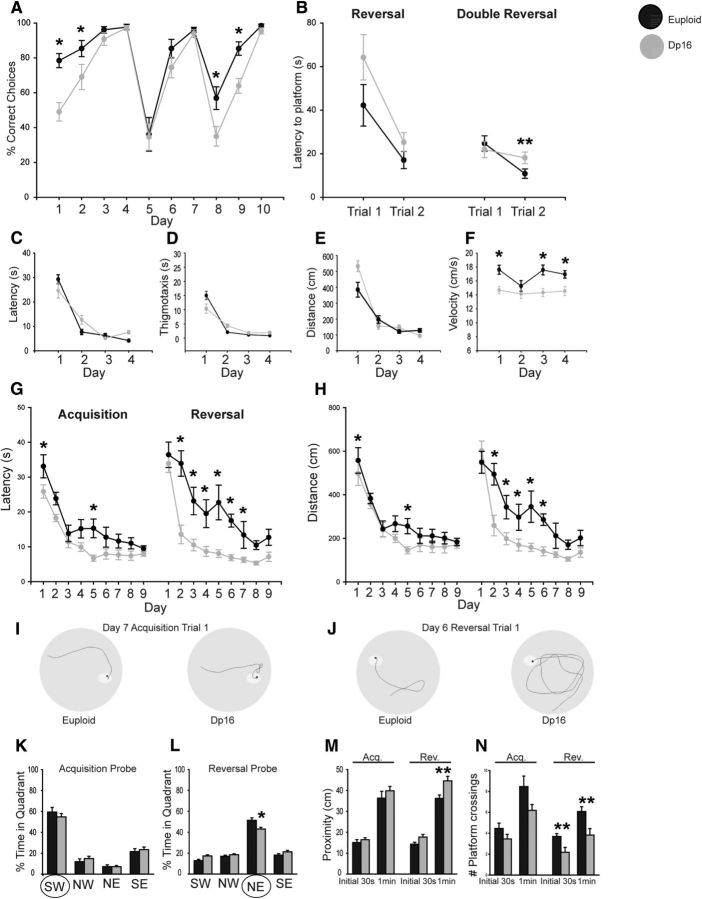
Studies in humans with Down syndrome (DS) show that alterations in fetal brain development are followed by postnatal deficits in neuronal numbers, synaptic plasticity, and cognitive and motor function. This same progression is replicated in several mouse models of DS. Dp(16)1Yey/+ (hereafter called Dp16) is a recently developed mouse model of DS in which the entire region of mouse chromosome 16 that is homologous to human chromosome 21 has been triplicated. As such, Dp16 mice may more closely reproduce neurodevelopmental changes occurring in humans with DS. Here, we present the first comprehensive cellular and behavioral study of the Dp16 forebrain from embryonic to adult stages. Unexpectedly, our results demonstrate that Dp16 mice do not have prenatal brain defects previously reported in human fetal neocortex and in the developing forebrains of other mouse models, including microcephaly, reduced neurogenesis, and abnormal cell proliferation. Nevertheless, we found impairments in postnatal developmental milestones, fewer inhibitory forebrain neurons, and deficits in motor and cognitive performance in Dp16 mice. Therefore, although this new model does not express prenatal morphological phenotypes associated with DS, abnormalities in the postnatal period appear sufficient to produce significant cognitive deficits in Dp16.

Keywords: cognition; developmental milestones; embryonic development; trisomy 21.


Figures

Figure 1.
Figure 1.
Gross brain and body size in Dp16 fetuses. A, Euploid (left) and Dp16 (right) fetuses at E14.5. B, Dp16 crown–rump length is comparable to euploid throughout prenatal development (E13.5: Eu = 13, Dp = 5; E14.5: Eu = 6, Dp = 3; E15.5: Eu = 9, Dp = 8; E16.5: Eu = 9, Dp = 5; and E18.5: Eu = 10, Dp = 8). C, Euploid (left) and Dp16 (right) brains at E14.5. D, Medial–lateral length of cerebral hemispheres is similar between genotypes. E, Rostrocaudal length of Dp16 telencephalon is normal throughout the embryonic time window (E13.5: Eu = 13, Dp = 5; E14.5: Eu = 9, Dp = 7; E15.5: Eu = 11, Dp = 8; E16.5: Eu = 11, Dp = 7; E18.5: Eu = 10, Dp = 8). F, Normal telencephalic size of Dp16 on B6:C3Sn background through paternal (E14.5: Eu = 12, Dp = 8) and maternal (E15.5: Eu = 9, Dp = 7) trisomic carriers. In each graph, the data points and bars represent the mean ± SEM.
Figure 2.
Figure 2.
Histology of the Dp16 neocortex and hippocampus. A, TO-PRO-3 stain of coronal neocortical sections at E15.5 (euploid, left; Dp16, right). VZ/SVZ, IZ, and CP are denoted. BE, Expansion of all neocortical layers occurs normally in Dp16 from midgestation to late gestation (E13.5: Eu = 8, Dp = 5; E14.5: Eu = 11, Dp = 14; E15.5: Eu = 8, Dp = 6; E16.5: Eu = 6, Dp = 6; E18.5: Eu = 8, Dp = 8). F, Thickness of laminae is normal in Dp16 B6:C3Sn animals at E15.5 (Eu = 4, Dp = 6). G, TO-PRO-3 stain of coronal section from an E15.5 brain at the brain level used for quantification of neocortical (solid line white box) and hippocampal (dashed line white box) growth. H, Hippocampal TO-PRO-3 stain at E18.5. IK, Hippocampal growth occurs normally in Dp16 animals (E15.5 Eu = 4, Dp = 4; E18.5 Eu = 3, Dp = 3). In each graph the data points and bars represent the mean ± SEM.
Figure 3.
Figure 3.
Dorsal and ventral neural progenitor populations are normal in Dp16. A, A′, Immunohistochemistry labeling apical (aPC, Sox2+, green) and basal intermediate progenitors (bIPC, Tbr2+, red) in euploid (A) and Dp16 (A′) E14.5 neocortex (DAPI, blue). B, C, Each cell population contains normal numbers in the Dp16 neocortical germinal zone at all ages studied. D, Spatial distributions of aPC and bIPCs are normal at all embryonic ages in Dp16 (E13.5 shown, E14.5–18.5 not shown; E13.5: u = 8, Dp = 5; E14.5: Eu = 7, Dp = 5; E15.5: Eu = 9, Dp = 7; E16.5: Eu = 5, Dp = 5; E18.5: Eu = 8, Dp = 8). E, F, Number of Olig2+ progenitors (green) in the E14.5 medial ganglionic eminence in the ventral germinal zone is normal in Dp16 animals. In each graph, the data points and bars represent the mean ± SEM.
Figure 4.
Figure 4.
Mitosis and neurogenesis in Dp16 embryonic development. A, Mitotic cells (pH3+, red) in the dorsal germinal zone of euploid E14.5 neocortex. B, C, Number of mitotic events occurring at the ventricular surface (B) and away from the ventricle (C) is consistent between genotypes at all embryonic ages (E13.5: Eu = 8, Dp = 5; E14.5: Eu = 7, Dp = 5; E15.5: Eu = 9, Dp = 8; E16.5: Eu = 5, Dp = 5; E18.5: Eu = 9, Dp = 8). D, Representative image of mitotic cells (pH3+, red) in the MGE of an E14.5 euploid animal. E, F, Distribution of mitotic cells in the MGE is normal in Dp16 animals (E13.5 and E15.5 shown; E13.5: Eu = 8, Dp = 5; E14.5: Eu = 6, Dp = 5; E15.5: Eu = 9, Dp = 7; E16.5: Eu = 5, Dp = 5). G, Position of EdU + S-phase cells 24 h after labeling (E14.5 euploid image; EdU+, green; DAPI, blue). H, I, EdU+ population size (H) and distribution (I) is consistent between genotypes (Eu = 4, Dp = 6). In each graph, the data points and bars represent the mean ± SEM.
Figure 5.
Figure 5.
Microarray analysis of Hsa21 homologs in Dp16 and Ts65Dn embryonic brain. A, Fold expression of Hsa21 homologs reveals prominent differences in differentially expressed genes (DEX genes) between Ts65Dn (square) and Dp16 (circle) at E15.5 (red, Ts65Dn DEX genes; blue, Dp16 DEX genes). B, Number of unique DEX genes is higher in Ts65Dn (red, Ts65Dn only DEX genes; blue, Dp16 only DEX genes; red and blue stripes, shared DEX genes).
Figure 6.
Figure 6.
Mean body weight and length and developmental milestones of Dp16 versus euploid mice. A, Daily mean body weights of euploid and Dp16 mice in grams measured from P3 until P21. B, Mean body length of euploid and Dp16 mice from P3 until P14. Both weight and body length are significantly reduced in Dp16 (**p < 0.0005). CJ, Early- and late-acquisition developmental milestones of surface righting (C), negative geotaxis (D), forelimb grasp (E), open field (F), ear twitch (G), eye opening (H), air righting (I), and auditory startle (J) of euploid and Dp16 mice. Each data point represents the percentage of animals that acquired the developmental milestone at a specific postnatal day. Fisher's exact test was used to examine significant differences between groups at each postnatal day. (Eu = 31, Dp = 16, *p < 0.05). In each graph, the data points represent the mean ± SEM.
Figure 7.
Figure 7.
Postnatal neuronal population abnormalities in Dp16 somatosensory cortex. A, B, Immunohistochemistry for parvalbumin (A, red), somatostatin (B, red), and calretinin (B, green) expressing interneurons in the P15 somatosensory cortex (left, euploid; right, Dp16). C, Immunohistochemistry for Tbr1-labeled excitatory neurons (Tbr1, red; DAPI, blue; left, euploid; right, Dp16). D, Significant reduction in parvalbumin and somatostatin interneuron density in Dp16 somatosensory cortex (PV, **p = 0.014; Eu = 4, Dp = 5; Sst, *p = 0.041; Eu = 4, Dp = 5), but not calretinin. E, Tbr1+ cell density was reduced in Dp16, but did not reach statistical significance (p = 0.07, Eu = 4, Dp16 = 5). In each graph, the bars represent the mean ± SEM and white scale bars indicate 50 μm.
Figure 8.
Figure 8.
Innate behaviors of Dp16 versus euploid mice. A, Nest-building ability. Nesting score was assessed from overnight up to 20 d. B, Digging behavior as measured by the number of marbles buried during 6 min. C, D, Spontaneous alternation is normal in Dp16. Measures of spontaneous alternation (C), number of arm entries (D), velocity (E), and distance traveled (F) were unchanged from euploids. In each graph, the bars represent the mean ± SEM (Eu = 11, Dp = 13, *p < 0.05, **p < 0.01).
Figure 9.
Figure 9.
Motor activity and function in Dp16 mice. AD, Locomotor activity was measured in a novel open field arena. Ambulatory activity (A), velocity (B), time spent in the border versus the center (C), and number of transitions between the border and the center (D) identify significant changes in Dp16. Each data point represents the mean ± SEM. EH, Representative traces showing locomotor activity and preferential location during the open field test. I, Hindlimb extension reflex is impaired in Dp16. J, Dp16 animals have a reduced latency to fall in the hanging wire test. In each graph, the bars represent the mean ± SEM (Eu = 11, Dp = 13; *p < 0.05, **p < 0.001, ***p = 0.002).
Figure 10.
Figure 10.
Spatial learning and memory performance in Dp16 mice. A, Percentage of correct choices using the water T-maze paradigm. Water T-maze assessment consisted of three phases: a training phase (days 1–4), a reversal phase (days 5–7), and a double reversal phase (days 8–10). B, Mean latencies to find the platform during reversal and double reversal periods. Note that mean latencies are calculated only for trials 1 and 2. CF, Quantitative measures of the visible platform test using the MWM paradigm. Escape latencies (C), thigmotaxis (D), distance swam (E), and swimming speed (F) are depicted. G, H, Quantification of the hidden platform test using the MWM paradigm. Escape latencies (G) and distance swam (H) are depicted. Note there are an acquisition phase and a reversal phase. I, J, Representative traces showing swimming path during acquisition and reversal phases. Each data point represents the mean ± SEM. (Figure legend continues. KN, Results of the reference memory (probe trial) test in the MWM paradigm. Note that probe trials were performed the day after acquisition and reversal phases were finished. Percentage of time spent in each of the quadrants after acquisition (K) and after reversal (L) is depicted. Proximity is defined as the mean average distance to the platform (M) and the number of virtually platform crossings (N). Note that these parameters were assessed in the initial 30 s and in the entire 60 s of the test. In each graph, the bars represent the mean ± SEM (Eu = 11, Dp = 13; *p < 0.05; **p < 0.01).

Similar articles

Cited by

References

    1. Anderson SA, Marín O, Horn C, Jennings K, Rubenstein JL. Distinct cortical migrations from the medial and lateral ganglionic eminences. Development. 2001;128:353–363. - PubMed
    1. Arendash GW, Lewis J, Leighty RE, McGowan E, Cracchiolo JR, Hutton M, García MF. Multi-metric behavioral comparison of APPsw and P301L models for Alzheimer's disease: linkage of poorer cognitive performance to tau pathology in forebrain. Brain Res. 2004;1012:29–41. doi: 10.1016/j.brainres.2004.02.081. - DOI - PubMed
    1. Belichenko PV, Masliah E, Kleschevnikov AM, Villar AJ, Epstein CJ, Salehi A, Mobley WC. Synaptic structural abnormalities in the Ts65Dn mouse model of Down syndrome. J Comp Neurol. 2004;480:281–298. doi: 10.1002/cne.20337. - DOI - PubMed
    1. Best TK, Siarey RJ, Galdzicki Z. Ts65Dn, a mouse model of Down syndrome, exhibits increased GABAB-induced potassium current. J Neurophysiol. 2007;97:892–900. doi: 10.1152/jn.00626.2006. - DOI - PubMed
    1. Brielmaier J, Matteson PG, Silverman JL, Senerth JM, Kelly S, Genestine M, Millonig JH, DiCicco-Bloom E, Crawley JN. Autism-relevant social abnormalities and cognitive deficits in engrailed-2 knockout mice. PLoS One. 2012;7:e40914. doi: 10.1371/journal.pone.0040914. - DOI - PMC - PubMed

Publication types

MeSH terms

Supplementary concepts