A novel enrichment strategy reveals unprecedented number of novel transcription start sites at single base resolution in a model prokaryote and the gut microbiome
- PMID: 26951544
- PMCID: PMC4782308
- DOI: 10.1186/s12864-016-2539-z
A novel enrichment strategy reveals unprecedented number of novel transcription start sites at single base resolution in a model prokaryote and the gut microbiome
Abstract
Background: The initiating nucleotide found at the 5' end of primary transcripts has a distinctive triphosphorylated end that distinguishes these transcripts from all other RNA species. Recognizing this distinction is key to deconvoluting the primary transcriptome from the plethora of processed transcripts that confound analysis of the transcriptome. The currently available methods do not use targeted enrichment for the 5'end of primary transcripts, but rather attempt to deplete non-targeted RNA.
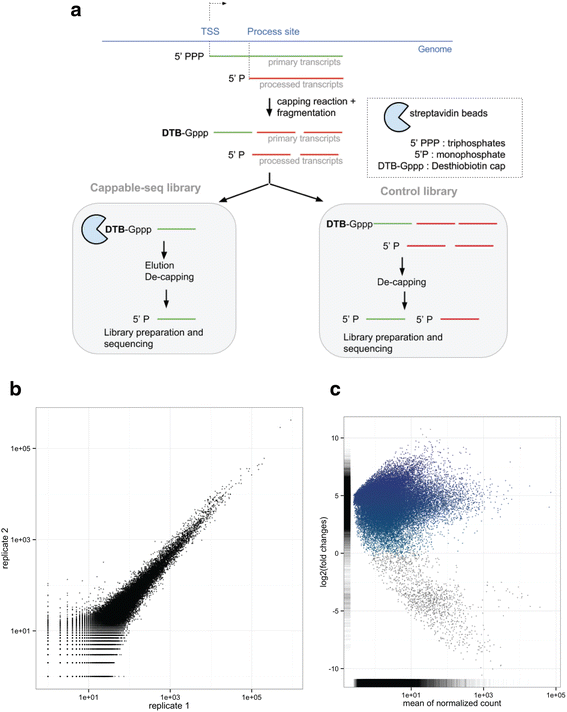
Results: We developed a method, Cappable-seq, for directly enriching for the 5' end of primary transcripts and enabling determination of transcription start sites at single base resolution. This is achieved by enzymatically modifying the 5' triphosphorylated end of RNA with a selectable tag. We first applied Cappable-seq to E. coli, achieving up to 50 fold enrichment of primary transcripts and identifying an unprecedented 16539 transcription start sites (TSS) genome-wide at single base resolution. We also applied Cappable-seq to a mouse cecum sample and identified TSS in a microbiome.
Conclusions: Cappable-seq allows for the first time the capture of the 5' end of primary transcripts. This enables a unique robust TSS determination in bacteria and microbiomes. In addition to and beyond TSS determination, Cappable-seq depletes ribosomal RNA and reduces the complexity of the transcriptome to a single quantifiable tag per transcript enabling digital profiling of gene expression in any microbiome.
Figures
Similar articles
-
ToNER: A tool for identifying nucleotide enrichment signals in feature-enriched RNA-seq data.PLoS One. 2017 May 25;12(5):e0178483. doi: 10.1371/journal.pone.0178483. eCollection 2017. PLoS One. 2017. PMID: 28542466 Free PMC article.
-
TSS-EMOTE, a refined protocol for a more complete and less biased global mapping of transcription start sites in bacterial pathogens.BMC Genomics. 2016 Nov 2;17(1):849. doi: 10.1186/s12864-016-3211-3. BMC Genomics. 2016. PMID: 27806702 Free PMC article.
-
RNA-Seq-Based Transcript Structure Analysis with TrBorderExt.Methods Mol Biol. 2018;1751:89-99. doi: 10.1007/978-1-4939-7710-9_6. Methods Mol Biol. 2018. PMID: 29508291
-
Obtaining Detailed Phage Transcriptomes Using ONT-Cappable-Seq.Methods Mol Biol. 2024;2793:207-235. doi: 10.1007/978-1-0716-3798-2_14. Methods Mol Biol. 2024. PMID: 38526733 Review.
-
Complete Transcriptome Analysis by 5'-End Single-Cell RNA-Seq with Random Priming.Methods Mol Biol. 2022;2490:141-156. doi: 10.1007/978-1-0716-2281-0_11. Methods Mol Biol. 2022. PMID: 35486244 Review.
Cited by
-
Dual-level autoregulation of the E. coli DeaD RNA helicase via mRNA stability and Rho-dependent transcription termination.RNA. 2020 Sep;26(9):1160-1169. doi: 10.1261/rna.074112.119. Epub 2020 May 15. RNA. 2020. PMID: 32414857 Free PMC article.
-
Mapping direct and indirect MarA/SoxS/Rob/RamA regulons in Salmonella Typhimurium reveals repression of csgD and biofilm formation.Microbiology (Reading). 2023 May;169(5):001330. doi: 10.1099/mic.0.001330. Microbiology (Reading). 2023. PMID: 37204124 Free PMC article.
-
An overview of gene regulation in bacteria by small RNAs derived from mRNA 3' ends.FEMS Microbiol Rev. 2022 Sep 2;46(5):fuac017. doi: 10.1093/femsre/fuac017. FEMS Microbiol Rev. 2022. PMID: 35388892 Free PMC article. Review.
-
Xenogeneic silencing strategies in bacteria are dictated by RNA polymerase promiscuity.Nat Commun. 2022 Mar 3;13(1):1149. doi: 10.1038/s41467-022-28747-1. Nat Commun. 2022. PMID: 35241653 Free PMC article.
-
A Novel pH-Regulated, Unusual 603 bp Overlapping Protein Coding Gene pop Is Encoded Antisense to ompA in Escherichia coli O157:H7 (EHEC).Front Microbiol. 2020 Mar 20;11:377. doi: 10.3389/fmicb.2020.00377. eCollection 2020. Front Microbiol. 2020. PMID: 32265854 Free PMC article.
References
MeSH terms
Substances
LinkOut - more resources
Full Text Sources
Other Literature Sources

