. 2016 Apr 6;138(13):4439-47.
doi: 10.1021/jacs.5b13107. Epub 2016 Mar 23.

A Programmable DNA Origami Platform to Organize SNAREs for Membrane Fusion

Affiliations

A Programmable DNA Origami Platform to Organize SNAREs for Membrane Fusion

Weiming Xu et al. J Am Chem Soc. .

Abstract

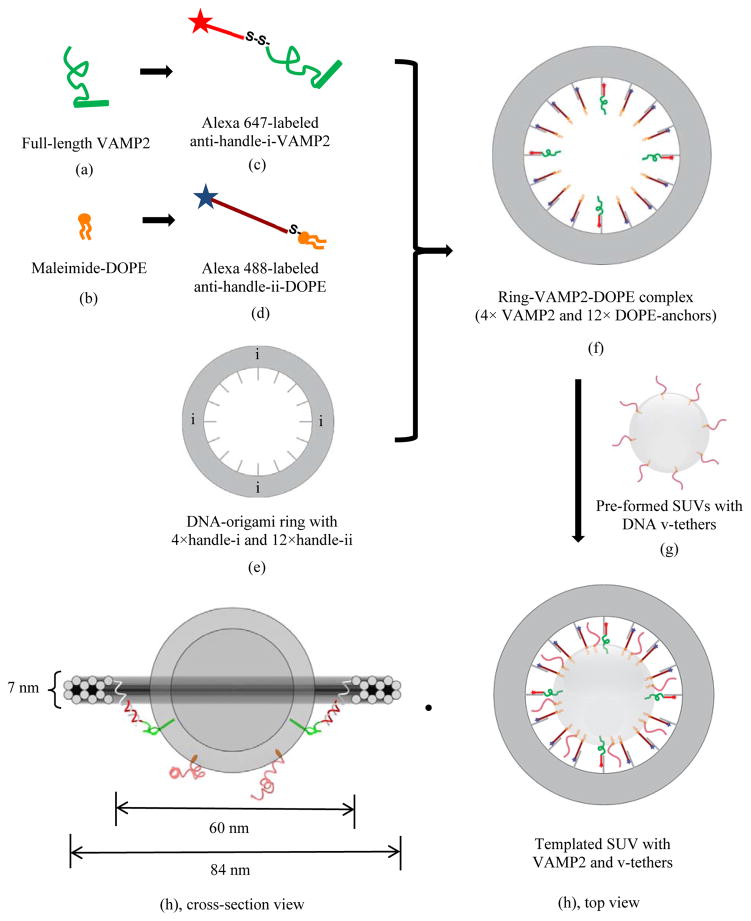
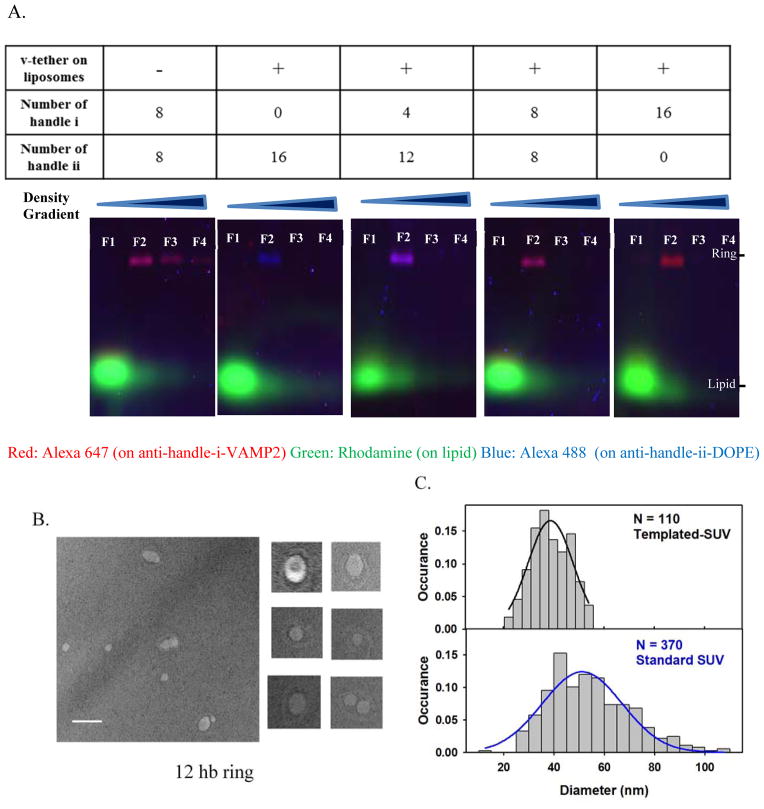
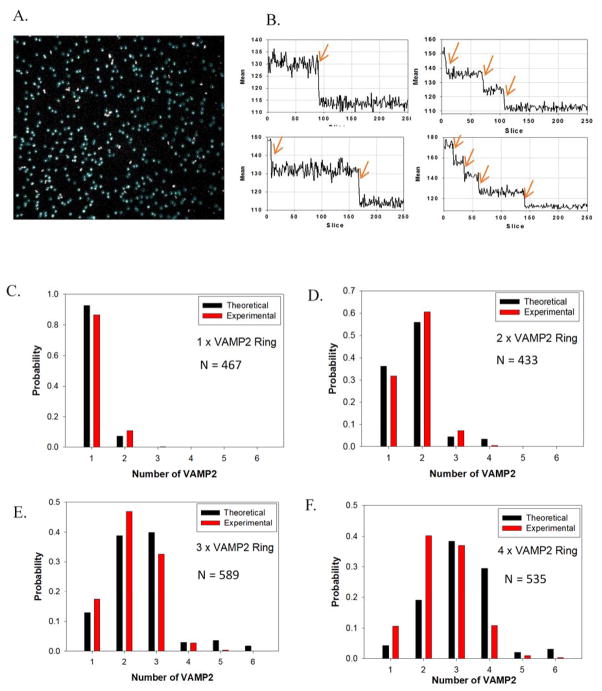
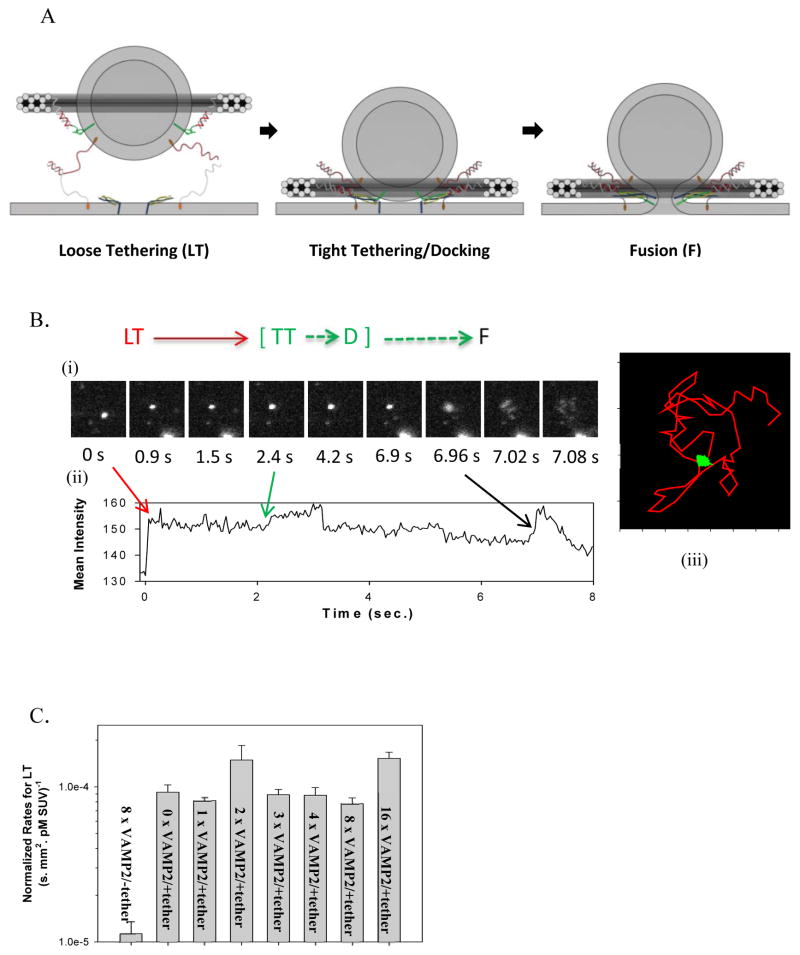
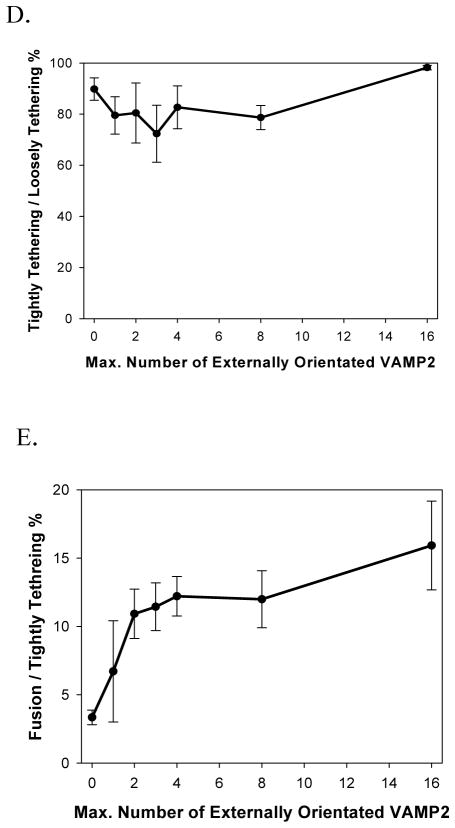
Soluble N-ethylmaleimide-sensitive factor attachment protein receptor (SNARE) complexes are the core molecular machinery of membrane fusion, a fundamental process that drives inter- and intracellular communication and trafficking. One of the questions that remains controversial has been whether and how SNAREs cooperate. Here we show the use of self-assembled DNA-nanostructure rings to template uniform-sized small unilamellar vesicles containing predetermined maximal number of externally facing SNAREs to study the membrane-fusion process. We also incorporated lipid-conjugated complementary ssDNA as tethers into vesicle and target membranes, which enabled bypass of the rate-limiting docking step of fusion reactions and allowed direct observation of individual membrane-fusion events at SNARE densities as low as one pair per vesicle. With this platform, we confirmed at the single event level that, after docking of the templated-SUVs to supported lipid bilayers (SBL), one to two pairs of SNAREs are sufficient to drive fast lipid mixing. Modularity and programmability of this platform makes it readily amenable to studying more complicated systems where auxiliary proteins are involved.


Figures

Figure 1
Figure 1
Manufacture of uniform-sized DNA-origami templated SUV that bears pre-determined numbers of VAMP2 (v-SNAREs) and v-tethers. Illustrated is an example of a DNA origami-templated vesicle, where the template displays 4 full length VAMP2 (aa 1–116), 12 ssDNA-lipid anchors. A number of v-tethers, not attached to the template, diffuse freely on the external surface of a vesicle. The detailed preparation procedure is described in the Material and Methods section in the Supplementary Information. Briefly, (f) was first prepared by mixing and incubating individually purified components (c), (d), and (e). After purification, complex (f) was reconstituted into (g) and the final product (h) was obtained. Anti-handles holding DOPE anchors are not shown in (h) cross-section view for clarity. Color codes: Grey annulus, DNA origami-ring containing a total of 16 inner handles, with 4 of “handle i” to direct VAMP2 and 12 of “handle ii” to direct DOPE lipid anchors; Green, full-length VAMP2; Orange, DOPE lipid anchors; Red in different shades, ssDNA with different sequences on templated-SUV, serving as anti-handles and v-tethers (see Table S1 for oligonucleotide sequences).
Figure 2
Figure 2
Characterization of DNA origami-templated SUVs containing v-tethers. (A) SDS-agarose gel for the templated vesicles. Gel runs from the top to the bottom as in the images. Fractions obtained after equilibrium density gradient separation (from the Fraction 1, “F1” on the top layer of the density gradient to the Fraction 12 on the bottom layer) were loaded on the gel. As shown in the images, Fraction 1 contained liposomes without ring complexes, Fraction 2 contained the ring-templated SUV, and later fractions contained little amount of detectable substances. Aggregates were absent in all the fractions. Limited by the space, gel images were shown till fraction 4 for each preparation. Fraction 2 (“F2” in gel image) was collected for further measurement in the fusion assay. The color of the product bands gradually changed from pure blue to pure red, with the number of VAMP2 (conjugated to anti-handle i-Alexa647, coded as red) increasing from 0 to 16, and the number of balancing lipid anchors (conjugated to anti handle ii-Alexa488, coded as blue) decreasing from 16 to 0. (B–C) Transmission Electronic Microscopy (TEM) characterization of the final templated vesicles. (B) Representative TEM images with a selection of zoomed-in images (100 nm × 100 nm). Scale bar, 100 nm. (C) Size distribution of the vesicles on ring-templates. The measured mean size of vesicles was 39.1 ± 7.7 nm in diameter (N = 110 vesicles). The solid black line represents a Gaussian fit for the size-distribution histogram. The solid blue line represents a Gaussian fit for the size-distribution histogram for vesicles prepared by standard detergent-dialysis method that contained v-tethers and v-SNAREs with a measured mean diameter of 54.5 ± 16.3 nm (N = 370 vesicles).
Figure 3
Figure 3
Single-molecule step-bleaching experiments confirming the number of SNAREs on each vesicle. (A) Selected fluorescent spots (particles in blue circles) for analysis of 4×VAMP2 ring (for an area of 91 μm × 91 μm). (B) Examples of mean fluorescence intensity (area of 6×6 pixels) time courses showing bleaching steps. (C) – (F) Distribution of bleaching steps of rings with different numbers of labeled VAMP2. The observed distributions match calculated distributions assuming 75% yield of binding of VAMP2 to each handle and 10% probability of two spots co-localized with one another during the measurements.
Figure 4
Figure 4
Templated SUVs fused with SBL after capture mediated by tether pairings. (A) Cartoon illustrating the transition from the Loosely Tethered (LT) stage, to the Tightly Tethered/Docked (TT/D) stage, and to the Fusion (F) stage. For clarity, DOPE anchors on the template are omitted, and only t-SNARE and the t-tethers facing upward are shown. Color codes: Blue, Syntaxin 1; Yellow, SNAP25; Light grey curls, t-tethers. The other colors have the same meaning as in Figure 1. (B) An example of fusion event, in which a vesicle was observed to undergo an LT to TT to F transition sequence. (i) Image series during measurement (11 μm × 11 μm area). (ii) Mean intensity time course of the area (5 μm × 4 μm area exclude other particles). (iii) 2D diffusion traces of the observed vesicle (5 μm × 4 μm area). The vesicle (bright spot) was first captured onto the SBL by tether pairings (noted as entry into the LT state, at time 0 s in (i) and (ii)); then the vesicle diffused on the bilayer (red trace in (iii)) until it was tightly tethered and immobile on the SBL (noted as entry into the TT state, at 2.4 s in (i) and (ii)); after v- and t-SNARE docking (noted as entry into the D state), certain fractions of the populations of these immobile vesicles proceeded to fusion (noted as entry into the F state, at about 6.9 s in (i) and (ii) ) while others remained immobilized until they became invisible due to photobleaching. Note that at the moment of immobilization (i.e. entry into the TT state), a characteristic intensity step-increase was observed, indicating the vesicle was pulled closer to the SBL. (C) Normalized rates for capture of vesicles into the LT state. Tethering of vesicles onto SBL is determined by hybridization of t- and v-tethers, and is independent of the presence or the density of SNAREs. (D) Percentage of the loosely tethered vesicles (LT) that proceeded to the tightly tethered (TT) state as a function of the maximal number of templated VAMP2. No correlation was observed, indicating that immobilization of the vesicles onto the SBL was dominated by the tether pairings and was independent of the presence or the density of SNAREs. (E) Percentage of tightly tethered (TT) vesicles that proceeded to fusion (i.e. fusion competency) as a function of the maximal number of templated VAMP2. In contrast to the two proceeding stages, fusion competency was observed to be dependent on the number of templated SNAREs on the vesicles. Error bars represent S.E.M. in (C) – (E). Detailed statistics are listed in Table S2.
Figure 4
Figure 4
Templated SUVs fused with SBL after capture mediated by tether pairings. (A) Cartoon illustrating the transition from the Loosely Tethered (LT) stage, to the Tightly Tethered/Docked (TT/D) stage, and to the Fusion (F) stage. For clarity, DOPE anchors on the template are omitted, and only t-SNARE and the t-tethers facing upward are shown. Color codes: Blue, Syntaxin 1; Yellow, SNAP25; Light grey curls, t-tethers. The other colors have the same meaning as in Figure 1. (B) An example of fusion event, in which a vesicle was observed to undergo an LT to TT to F transition sequence. (i) Image series during measurement (11 μm × 11 μm area). (ii) Mean intensity time course of the area (5 μm × 4 μm area exclude other particles). (iii) 2D diffusion traces of the observed vesicle (5 μm × 4 μm area). The vesicle (bright spot) was first captured onto the SBL by tether pairings (noted as entry into the LT state, at time 0 s in (i) and (ii)); then the vesicle diffused on the bilayer (red trace in (iii)) until it was tightly tethered and immobile on the SBL (noted as entry into the TT state, at 2.4 s in (i) and (ii)); after v- and t-SNARE docking (noted as entry into the D state), certain fractions of the populations of these immobile vesicles proceeded to fusion (noted as entry into the F state, at about 6.9 s in (i) and (ii) ) while others remained immobilized until they became invisible due to photobleaching. Note that at the moment of immobilization (i.e. entry into the TT state), a characteristic intensity step-increase was observed, indicating the vesicle was pulled closer to the SBL. (C) Normalized rates for capture of vesicles into the LT state. Tethering of vesicles onto SBL is determined by hybridization of t- and v-tethers, and is independent of the presence or the density of SNAREs. (D) Percentage of the loosely tethered vesicles (LT) that proceeded to the tightly tethered (TT) state as a function of the maximal number of templated VAMP2. No correlation was observed, indicating that immobilization of the vesicles onto the SBL was dominated by the tether pairings and was independent of the presence or the density of SNAREs. (E) Percentage of tightly tethered (TT) vesicles that proceeded to fusion (i.e. fusion competency) as a function of the maximal number of templated VAMP2. In contrast to the two proceeding stages, fusion competency was observed to be dependent on the number of templated SNAREs on the vesicles. Error bars represent S.E.M. in (C) – (E). Detailed statistics are listed in Table S2.

Similar articles

Cited by

References

    1. Weber T, Zemelman BV, McNew JA, Westermann B, Gmachl M, Parlati F, Sollner TH, Rothman JE. Cell. 1998;92:759. - PubMed
    1. Sudhof TC, Rothman JE. Science. 2009;323:474. - PMC - PubMed
    1. Li F, Pincet F, Perez E, Eng WS, Melia TJ, Rothman JE, Tareste D. Nat Struct Mol Biol. 2007;14:890. - PubMed
    1. Gao Y, Zorman S, Gundersen G, Xi Z, Ma L, Sirinakis G, Rothman JE, Zhang Y. Science. 2012;337:1340. - PMC - PubMed
    1. Zorman S, Rebane AA, Ma L, Yang G, Molski MA, Coleman J, Pincet F, Rothman JE, Zhang Y. Elife. 2014;3:e03348. - PMC - PubMed

Publication types