. 2016 Feb 10;19(2):240-53.
doi: 10.1016/j.chom.2016.01.008.

Preventing Age-Related Decline of Gut Compartmentalization Limits Microbiota Dysbiosis and Extends Lifespan

Affiliations

Preventing Age-Related Decline of Gut Compartmentalization Limits Microbiota Dysbiosis and Extends Lifespan

Hongjie Li et al. Cell Host Microbe. .

Abstract

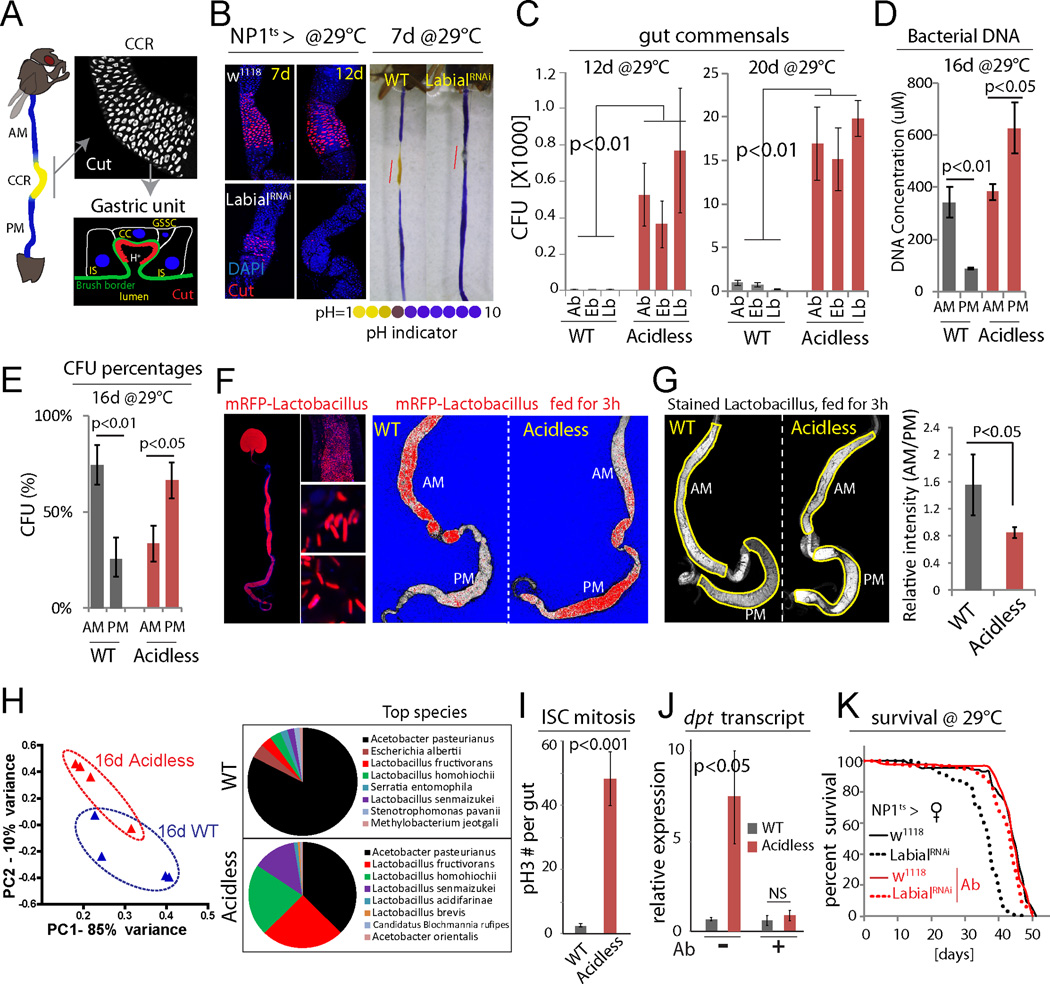
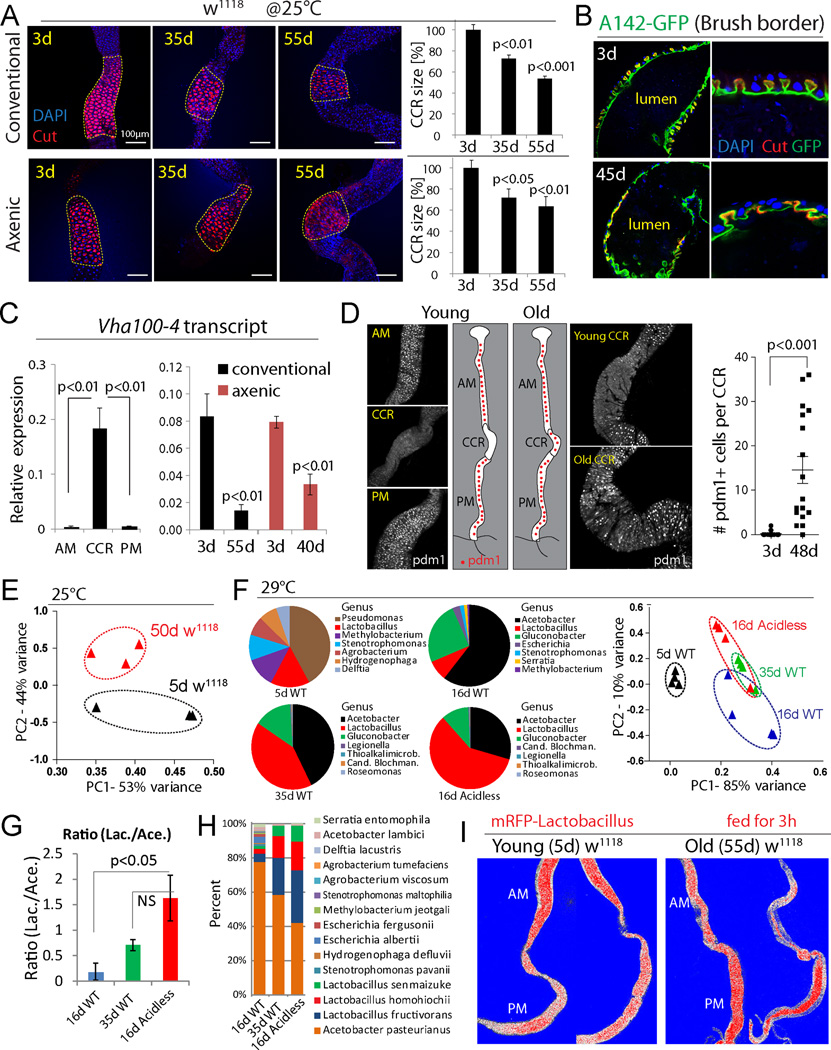
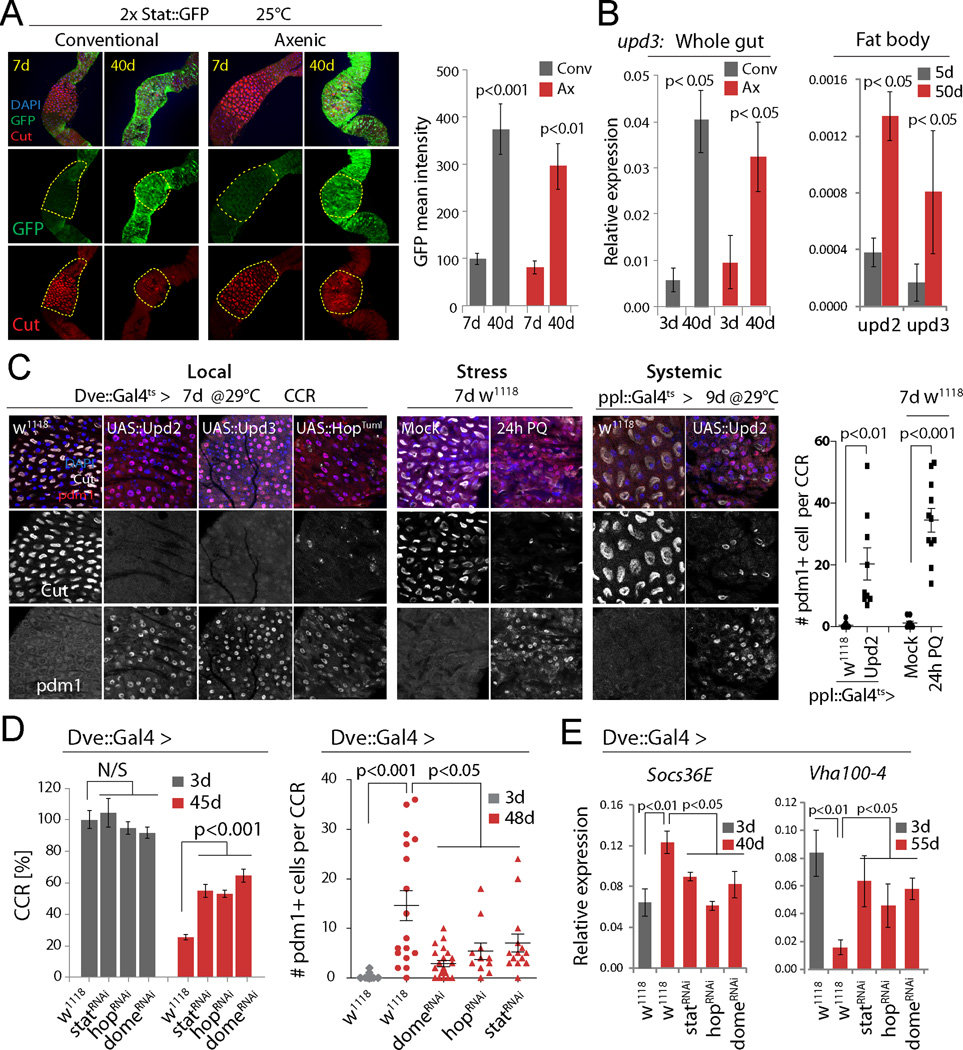
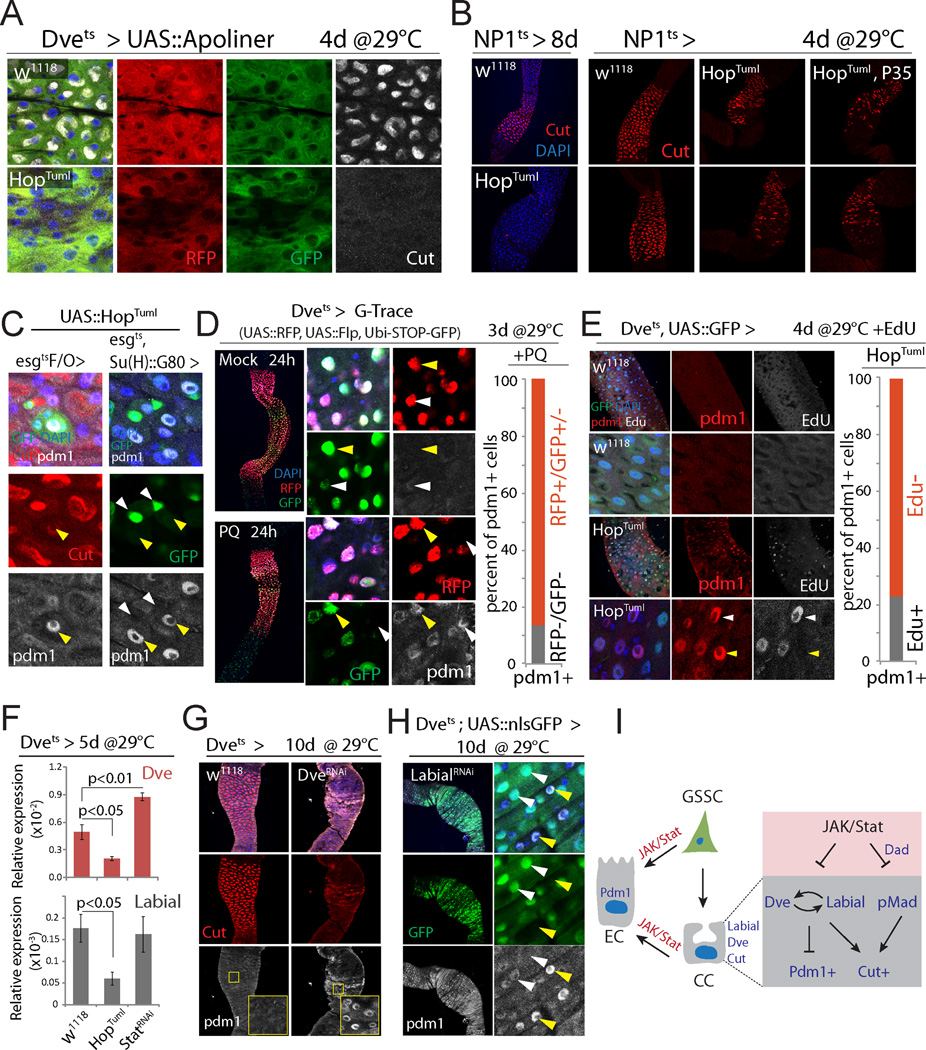
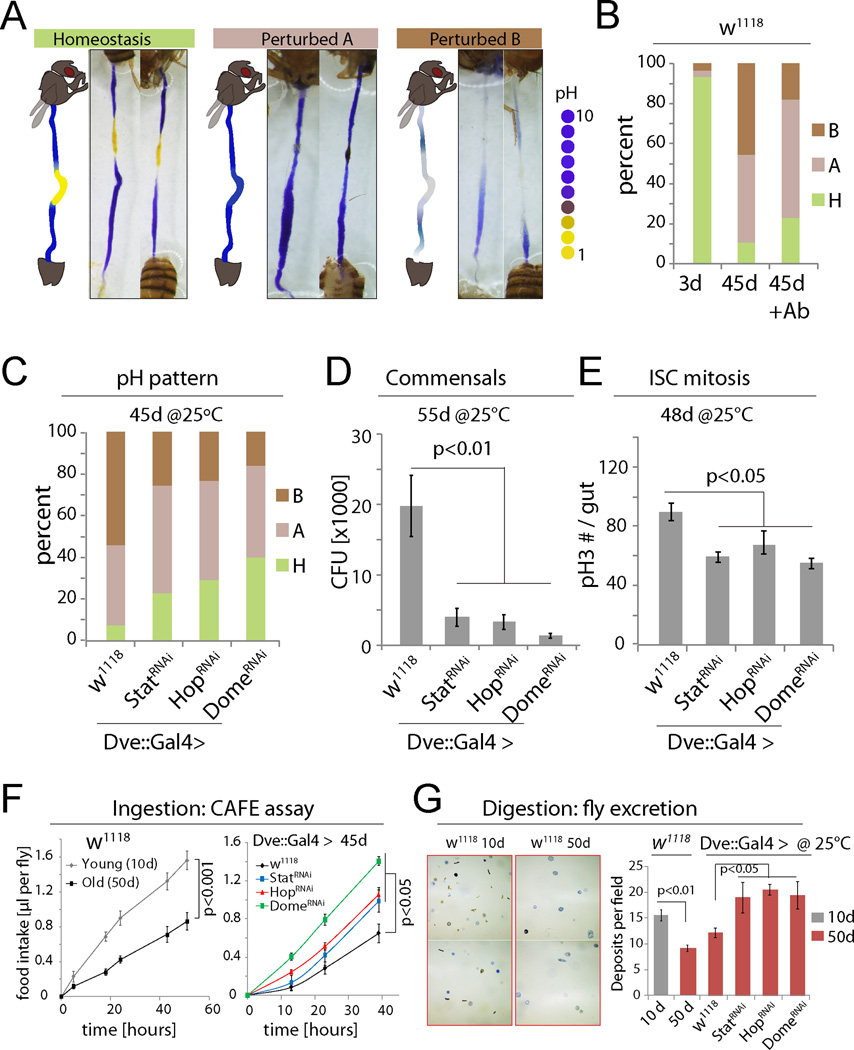
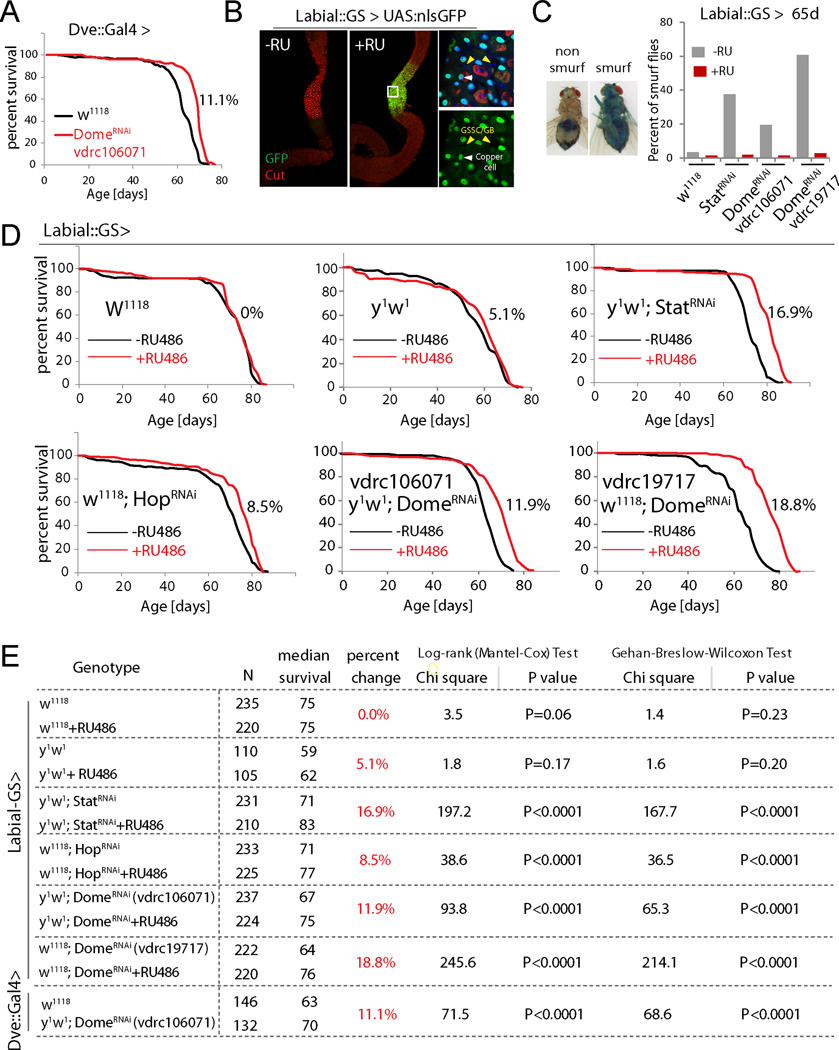
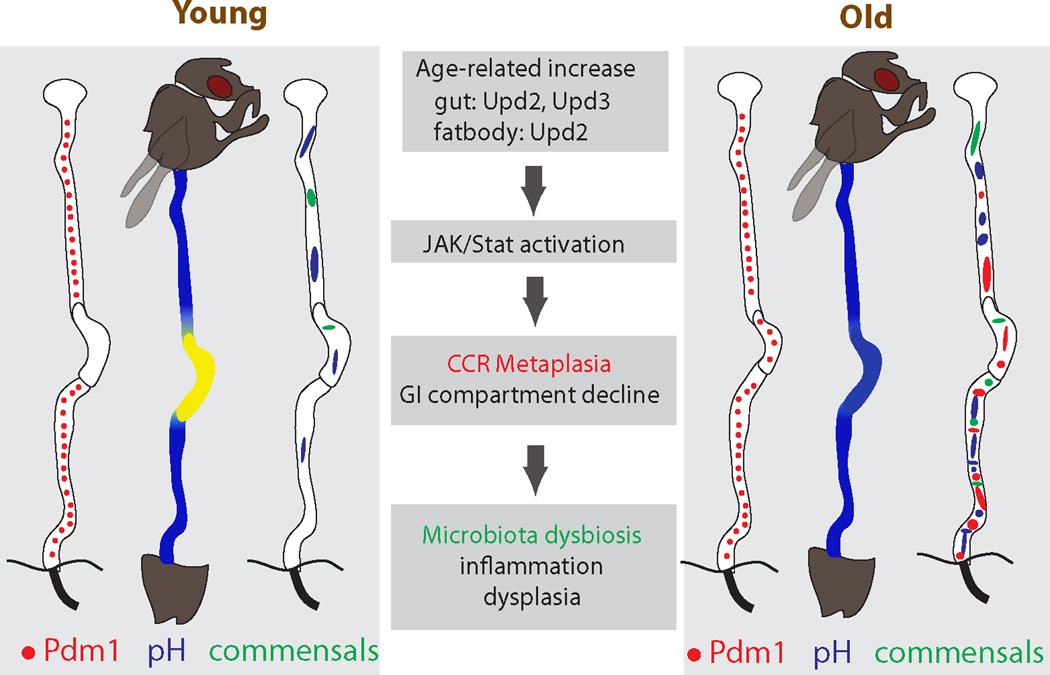
Compartmentalization of the gastrointestinal (GI) tract of metazoans is critical for health. GI compartments contain specific microbiota, and microbiota dysbiosis is associated with intestinal dysfunction. Dysbiosis develops in aging intestines, yet how this relates to changes in GI compartmentalization remains unclear. The Drosophila GI tract is an accessible model to address this question. Here we show that the stomach-like copper cell region (CCR) in the middle midgut controls distribution and composition of the microbiota. We find that chronic activation of JAK/Stat signaling in the aging gut induces a metaplasia of the gastric epithelium, CCR decline, and subsequent commensal dysbiosis and epithelial dysplasia along the GI tract. Accordingly, inhibition of JAK/Stat signaling in the CCR specifically prevents age-related metaplasia, commensal dysbiosis and functional decline in old guts, and extends lifespan. Our results establish a mechanism by which age-related chronic inflammation causes the decline of intestinal compartmentalization and microbiota dysbiosis, limiting lifespan.


Figures

Figure 1
Figure 1. Intestinal compartmentalization impacts gut microbiota
(A) Left: the Drosophila GI tract consists of anterior midgut (AM), middle midgut (MM) with copper cell region (CCR), and posterior midgut (PM). Right: anti-Cut (white) labels acid-producing copper cells (CCs). A gastric unit. IS: interstitial cell, GSSC: gastric stem cell. (B) Expression of LabialRNAi results in loss of CCs. Acidic regions (yellow) indicated by pH indicator Bromophenol blue. Representative images of 3 independent experiments. N=7 for each genotype and time point. (C) Commensal numbers in 12d and 20d old WT (NP1ts>w1118) and acidless flies (NP1ts>LabialRNAi). Colony-forming units (CFUs) of three common commensal phylotypes (Acetobacter, Ab; Enterobacter, Eb; Lactobacillus, Lb) are quantified using selective plates. Averages and s.e.m. (t-test), N=6, 6, 6, 10, 10, 10 (both 12d and 20d). Representative from 3 independent experiments. (D) Bacterial DNA concentration of the AM and PM from 16d old WT and acidless flies. Averages and s.e.m. (t-test), N=3×10 guts each. (E) Commensal distribution in 16d old WT and acidless guts. Percent averages of colony-forming units (CFUs) in AMs and PMs are shown. N=12, 11. Averages and s.e.m. (t-test). (F) Distribution of RFP-tagged Lactobacillus plantarum in 16d old WT and acidless flies. Left: representative images of RFP-tagged Lactobacillus in the gut. Right: representative saturation images of WT and acidless guts with RFP-tagged Lactobacillus. Saturated signal red, un-saturated signal white and background blue. False color images generated from confocal images in ZEN. Representative of 3 independent experiments. (G) Distribution of stained Lactobacillus (by SYTO 9) in 16d old WT and acidless flies. Relative fluorescent intensity is quantified. N=6, 9. Averages and s.e.m. (t-test). (H) Commensal composition of 16d old WT and acidless guts. Principal component analysis (PCA) based on percentages of classified bacterial species determined by 16S rRNA sequencing. Pie charts show top bacterial species. For PCA, each dot represents 10 guts; for pie charts, each represents the average of four samples (4×10 guts). (I) Quantification of pH3+ cells in guts of 16d old flies at 29°C. Averages and s.e.m. (t-test); N=12, 11. Data are representative of 3 independent experiments. (J) qRT-PCR showing dpt expression of 16d old flies on normal or antibiotic (Ab) food. Averages and s.e.m. (t-test) of N=3 biological replicates. (K) Lifespan of acidless flies compared to WT controls on normal or antibiotic (Ab) food. Without antibiotics: WT N=88, acidless N=93, Log-rank P value <0.0001, 17.8% change of median lifespan; Antibiotics: WT N=110, acidless N=100, Log-rank P value =0.02, no change of median lifespan. See also Fig. S1
Figure 2
Figure 2. Age-related gastric decline and metaplasia
(A) CCRs (outlined) of w1118 flies decline with age. CCR area is quantified on the right. Averages and s.e.m. (t-test) from one experiment representative of more than three independent repeats. Conventional: N=5, 7, 7; Axenic: N=7, 11, 11. (B) Age-related decline of gastric units of w1118 flies. Anti-Cut (red) and brush border (green, A142-GFP). Representative images of 6 flies at each age in 2 independent experiments. (C) qRT-PCR measuring expression of Vha100-4 (normalized to actin5C) in different regions of young w1118 flies (left) and in whole guts of w1118 flies (right). Averages and s.e.m. (t-test), N=3 biological replicates. (D) Pdm1 expression along the GI tract. Representative images, experiment has been repeated at least three times in three wild-type genetic backgrounds (y1,w1/w1118; Dve::Gal4/+, y1,w1/w1118; w1118, S1106::GS/+). Pdm1+ cells per CCR are quantified. Averages and s.e.m. (t-test). N=20, 17. (E) Principal component analysis (PCA) based on percentages of classified bacterial species from 5d and 50d old w1118 flies at 25°C. Each dot represents 10 guts. (F) Pie charts show top bacterial genera of 5d old WT (NP1ts>w1118), 16d WT, 35d WT and 16d acidless (NP1ts>LabialRNAi) flies. Flies are cultured at 29°C to induce driver expression. PCA is based on percentages of classified bacterial species. For PCA, each dot represents 10 guts; for pie charts, each represents the average of four samples (40 guts). (G, H) Ratios of total Lactobacillus and Acetobacter (G), and distribution of top 15 bacterial species (H), in flies of three conditions shown in (F). Averages and s.e.m. (t-test) for (G). Averages of four samples for (H). (I) Change of Lactobacillus distribution in old guts (compare Fig. 1F). See also Fig. S2
Figure 3
Figure 3. Age-related activation of JAK/Stat causes CC loss and metaplasia
(A) Expression of 2xStat::GFP (green) in young and old CCRs. GFP intensity quantified on the right (normalized to 100 for young conv. condition). Averages and s.e.m. (t-test). Conv.: N=8, 8. Axenic: N=5, 9. Representative of 3 independent experiments. (B) qRT-PCR measuring upd3 expression (normalized to actin5C) in guts, and upd2 and upd3 in fat bodies, of w1118 flies. Averages and s.e.m. (t-test). N=3 biological replicates. (C) Immunostaining detecting Cut+ CCs and Pdm1+ cells in the CCR. (Local) wild-type flies or flies over-expressing Upd2, Upd3, or HopTuml. (Stress) treatment with 80mM Paraquat (PQ). (Systemic) over-expression of Upd2 using the fat body driver ppl::Gal4ts. Quantifications of Pdm1+ cells per CCR from stress and systemic conditions are shown. Averages and s.e.m. (t-test), N=12, 10, 10, 12. Data are representative of 3 independent experiments for Local, and 2 independent experiments for Stress and Systemic conditions. (D) Knockdown of JAK/Stat signaling components limits age-induced gastric decline. Left: N=12, 11, 11, 12, 20, 20, 16, 22. Right: N=20, 17, 22, 12, 15. Averages and s.e.m. (t-test). Representative from 3 independent experiments. (E) qRT-PCR detecting Socs36E and Vha100-4 in guts of wild-type (w1118) or StatRNAi, HopRNAi or DomeRNAi expressing flies. Averages and s.e.m. (t-test). N=3 biological replicates. See also Fig. S3
Figure 4
Figure 4. Mechanisms of metaplasia: GSSC mis-differentiation and CC trans-differentiation
(A) Expression of Apoliner in the CCR. No apoptosis is observed in CCs expressing HopTuml. Representative images of 7 flies per genotype. (B) Loss of CCs (red) upon over-expression of HopTuml using NP1::Gal4ts. Co-expression of P35 does not prevent CC loss. Representative images of 9 flies per genotype. (C) Pdm1+ cells (arrow) are generated in GSSC-derived clones (left; esgtsF/O> HopTuml, green), or when HopTuml is overexpressed only in the GSSCs (right; esg::Gal4ts with Su(H)::Gal80). Note that GFP+GSSCs (white arrow) do not express Pdm1. (D) G-Trace expression was initiated by incubating flies at 29°C for 3d before inducing Pdm1+ cells by Paraquat (PQ) treatment. All Dve+ cells express RFP (red), while GFP expression (green) remains mosaic, indicating that Flp-mediated recombination occurs only in a subset of these cells (yellow arrowhead strong GFP, recombined; white arrowhead background GFP, non-recombined). Graph shows the ratio of Pdm1+ cells that express RFP and/or GFP. N=239 cells from 3 guts. (E) EdU incorporation analysis to determine whether formation of Pdm1+ cells in the CCR involves DNA synthesis. Among induced Pdm1+ cells (red), 23% are EdU positive (white arrowhead), while 77% are EdU negative (yellow arrowhead). N= 126 cells from 4 guts. In w1118 CCRs, no Pdm1 or EdU is detected. (F) qRT-PCR showing Dve and Labial expression in CCRs of indicated genotypes. Averages and s.e.m. (t-test). N=3 biological replicates. (G) Dve knockdown results in loss of CCs (red) and generation of Pdm1+ cells (white). (H) Labial knockdown results in loss of CCs (red) and generation of Pdm1+ cells (white). Note that in the high Pdm1+ cells, GFP (Dve::Gal4>) signal is reduced (yellow arrow) compared to low- or non-Pdm1 cells (white arrow). (I) Model for the role of JAK/Stat signaling in promoting mis- and trans-differentiation of CCR cells. See also Fig. S4 and S5.
Figure 5
Figure 5. Inhibiting JAK/Stat signaling in the CCR promotes gut function and homeostasis
(A) GI tracts of flies fed the pH indicator Bromophenol Blue. Three phenotypic categories can be distinguished: homeostasis, a well-defined acidic CCR is flanked by basic AM and PM; ‘Perturbed A’, the acidic region is lost and the whole gut is basic; ‘Perturbed B’, the strongly acidic region is lost, while the rest of the gut also becomes less basic (weak blue). (B) Quantification of the three phenotypes in flies of indicated conditions. +Ab: Antibiotic treatment. N=28, 57, 39. Representative of 3 independent experiments. (C–E) Rescue of pH homeostasis (C; N=13, 25, 17, 39), commensal dysbiosis (D; N=10 each), and epithelial dysplasia (E; pH3+ cells in the gut, N= 12, 20, 12, 12, 12, 20, 12, 12) in old flies expressing StatRNAi, HopRNAi or DomeRNAi in the CCR. CFU: colony forming units. Representative of 3 independent experiments. (F) Food intake measured using CAFÉ assay. Averages and s.e.m. (t-test). N=18 flies from 6 replicates (w1118) or 21 flies from 7 replicates (other genotypes). (G) Excretion from flies fed Bromophenol blue. Images of deposits and quantification of deposit numbers are shown. Excretions are quantified in 8 to 24 fields for each group of 12 flies. Averages and s.e.m. (t-test). N= 24, 24, 8, 12, 12, 12 fields. See also Fig. S6
Figure 6
Figure 6. Inhibiting JAK/Stat signaling in the CCR extends lifespan (See also Fig. S7)
(A) Demography of flies expressing DomeRNAi in the CCR (w1118 as control). The percent change of median lifespan is indicated. All flies are female. (B) Characterization of Labial-GeneSwitch. In response to RU486, UAS::GFP expression is observed in the CCR specifically. High magnification (right) shows that this expression is in differentiated polyploid cells (including CCs, white arrowhead) but not in diploid cells (GSSCs and GBs, yellow arrowhead). Representative images of 7 flies for each condition. (C) Smurf assay for gut permeability of 65d old flies. Percent of Smurf flies are shown. N= 137, 139, 122, 121, 123, 147, 128, 143. (D) Demography of flies expressing StatRNAi, HopRNAi or two different DomeRNAi constructs under the control of Labial::GS, with w1118 and y1w1 as control. Graphs are combined from independent populations (only one population for y1w1) of F1 progeny from Labial::GS crossed to the indicated transgenes or to w1118 and y1w1 (control). The percent changes of median lifespan are indicated. All flies are female. Survival data was analyzed using GraphPad Prism. (E) Summary of parameters and statistics of the demography shown in (A) and (D). Survival data was analyzed using GraphPad Prism. See also Fig. S7
Figure 7
Figure 7. Origin and pathophysiological consequences of age-related gastric metaplasia
Age-related increase of JAK/Stat activity, induced by increased cytokines from the gut and/or fat body, causes metaplasia in the CCR. This results in pH imbalance, promoting commensal dysbiosis, inflammation and dysplasia in the old intestine.

Comment in

Similar articles

Cited by

References

    1. Alic N, Giannakou ME, Papatheodorou I, Hoddinott MP, Andrews TD, Bolukbasi E, Partridge L. Interplay of dFOXO and two ETS-family transcription factors determines lifespan in Drosophila melanogaster. PLoS genetics. 2014;10:e1004619. - PMC - PubMed
    1. Ayyaz A, Jasper H. Intestinal inflammation and stem cell homeostasis in aging. Frontiers in cellular and infection microbiology. 2013;3:98. - PMC - PubMed
    1. Bach EA, Ekas LA, Ayala-Camargo A, Flaherty MS, Lee H, Perrimon N, Baeg GH. GFP reporters detect the activation of the Drosophila JAK/STAT pathway in vivo. Gene expression patterns : GEP. 2007;7:323–331. - PubMed
    1. Bao S, Zhu L, Zhuang Q, Wang L, Xu PX, Itoh K, Holzman IR, Lin J. Distribution dynamics of recombinant Lactobacillus in the gastrointestinal tract of neonatal rats. PloS one. 2013;8:e60007. - PMC - PubMed
    1. Bardet PL, Kolahgar G, Mynett A, Miguel-Aliaga I, Briscoe J, Meier P, Vincent JP. A fluorescent reporter of caspase activity for live imaging. Proceedings of the National Academy of Sciences of the United States of America. 2008;105:13901–13905. - PMC - PubMed

Publication types

MeSH terms

LinkOut - more resources