. 2016 Apr 19;44(4):821-32.
doi: 10.1016/j.immuni.2016.01.003. Epub 2016 Feb 2.

MicroRNAs 24 and 27 Suppress Allergic Inflammation and Target a Network of Regulators of T Helper 2 Cell-Associated Cytokine Production

Affiliations

MicroRNAs 24 and 27 Suppress Allergic Inflammation and Target a Network of Regulators of T Helper 2 Cell-Associated Cytokine Production

Heather H Pua et al. Immunity. .

Abstract

MicroRNAs (miRNAs) are important regulators of cell fate decisions in immune responses. They act by coordinate repression of multiple target genes, a property that we exploited to uncover regulatory networks that govern T helper-2 (Th2) cells. A functional screen of individual miRNAs in primary T cells uncovered multiple miRNAs that inhibited Th2 cell differentiation. Among these were miR-24 and miR-27, miRNAs coexpressed from two genomic clusters, which each functioned independently to limit interleukin-4 (IL-4) production. Mice lacking both clusters in T cells displayed increased Th2 cell responses and tissue pathology in a mouse model of asthma. Gene expression and pathway analyses placed miR-27 upstream of genes known to regulate Th2 cells. They also identified targets not previously associated with Th2 cell biology which regulated IL-4 production in unbiased functional testing. Thus, elucidating the biological function and target repertoire of miR-24 and miR-27 reveals regulators of Th2 cell biology.


Figures

Figure 1
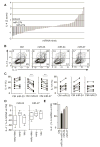
Figure 1. miRNA-deficient T cells have enhanced cytokine production in Th2 cell culture conditions
Intracellular cytokine staining of (A) Dgcr8Δ/+ and Dgcr8Δ/Δ and (B) wildtype (WT), Ago2 Δ/Δ, Ago1+/ΔAgo2 Δ/Δ and Ago1Δ/ΔAgo2 Δ/Δ CD4+ T cells cultured in Th2 cell conditions for 5 days. Also included are control and miRNA-deficient cells lacking T-bet (Dgcr8Δ/+Tbx21−/− and Dgcr8Δ/ΔTbx21−/−)(A). Numbers are percent of live CD4+ T cells singlets. For Dgcr8 cells, YFP+ pre-gating was performed to use a Rosa-YFP reporter as a measure of CRE activity and exclude cells that escaped deletion. Each graphed point represents an individual mouse. (n=4–8 mice from 2–3 independent experiments, one-way ANOVA with Bonferroni’s multiple comparison test for (A) (Dgcr8Δ/+or+/+ vs. Dgcr8Δ/Δ and Dgcr8Δ/+Tbx21−/− vs. Dgcr8Δ/ΔTbx21−/−) or Dunnett’s multiple comparison test for (B) (all samples compared to WT)). See also Figure S1
Figure 2
Figure 2. miR-24 and miR-27 inhibit IL-4 production in effector T cells
(A) Z scores for the frequency of IL-4+ Dgcr8Δ/ΔTbx21−/− T cells among live YFP+ CD4+ T cell singlets by intracellular staining. Each vertical bar represents a singlicate measure of an individual miRNA mimic transfected twice over a 5 day culture. (B,C) IL-4 and IL-13 production by Dgcr8Δ/ΔTbx21−/− T cells transfected with miR-23, miR-24, miR-27 or control mimic (CM). Numbers in quadrants are percent of live YFP+ CD4+ singlets and each dot represents an individual mouse (n=9 from 8 independent experiments, two-tailed paired t-test with Bonferroni’s multiple comparison test). (D) Change in percent of IL-4+ cells after transfection of Dgcr8Δ/ΔTbx21−/− CD4+ T cells with miR-24 or miR-27 versus CM at early (day 1), late (day 4) or early and late (day 1 and day 4) culture timepoints (n≥7 mice from at least 5 independent experiments, box interquartile with whiskers minimum and maximum). (E) Change in percent of IL-4+ cells versus CM after transfection of Dgcr8Δ/ΔTbx21−/− CD4+ T cells with miR-24, miR-27, or miR-24 plus miR-27 (n=4 mice, representative of 2 independent experiments, linear model with the two miRNAs as binary code predictors and an interaction term). See also Figure S2 and S3.
Figure 3
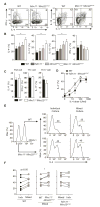
Figure 3. Loss of the Mirc11 and Mirc22 clusters in T cells enhances allergic airway inflammation and tissue pathology
(A,B) Intracellular cytokine staining of CD4+ T cells from WT and Mirc11−/−Mirc22ΔT/ΔT mice restimulated ex vivo 11 days after intraperitoneal OVA sensitization and 4 days after daily OVA airway challenge. Numbers in quadrants are percent of live CD4+ singlets (n≥10 mice from 2 independent experiments, two-tailed t-test). (C) Flow cytometry phenotyping of inflammatory cells in BAL from the same experiments quantifying the frequency of eosinophils (Eos, CD11b+SiglecF+), neutrophils (PMN, CD11b+Ly6G+), alveolar macrophage (Mac, CD11c+CD11blo), CD4+ T cells (CD4, CD11bCD11cCD4+) and CD8+ T cells (CD8, CD11bCD11cCD8+) among live hematopoietic cells (n≥10 mice from 2 independent experiments, one-way ANOVA with Bonferroni’s multiple comparison test). (D) Periodic Acid Shift (PAS) histologic staining for epithelial cell mucus metaplasia (pink) in lungs from the same experiment. PAS Score is the summed product of the percent of bronchioles with 0% (x0), 1–25% (x1), 26–50% (x2), 51–75% (x3) and 76–100% (x4) PAS positive cells (n≥10 mice from 2 independent experiments, 38–91 bronchioles counted per mouse, two-tailed t-test). See also Figure S4.
Figure 4
Figure 4. Mirc11−/−Mirc22ΔT/ΔT T cells have enhanced Th2 cell-associated cytokine production in cultures with limiting exogenous cytokines
Intracellular cytokine staining of wildtype (WT) and Mirc11−/−Mirc22ΔT/ΔT CD4+ T cells cultured in vitro for 5 days in ThN (A,B) (n=6–9 mice from 4 independent experiments, one-way ANOVA with Dunnett’s multiple comparison test), and Th1, Th2 and Th17 cell conditions (C) (n≥5 mice from 3 independent experiments, two-tailed t-test). Numbers in quadrants are percent of live CD4+ singlets. (D) Dose response of WT and Mirc11−/−Mirc22ΔT/ΔT T cells cultured in vitro for 5 days over a range of exogenous IL-4 doses and measured by intracellular cytokine staining (n=6 mice from 2 independent experiments, least squares four parameter nonlinear regression with logEC50 F-test). (E, F) Representative data and quantitation of intracellular cytokine staining of CD45.1+ WT and CD45.2+ Mirc11−/−Mirc22ΔT/ΔT T cells cultured individually or together in mixed cultures (n=6 pairs of mice from 3 independent experiments, two-tailed paired t-tests).
Figure 5
Figure 5. miR-24 and miR-27 affect networks of genes upstream of IL-4
(A) Cumulative distribution frequency plots depicting global mRNA expression by RNA sequencing as a log2 fold ratio of Dgcr8Δ/ΔTbx21−/− CD4+ T cells transfected with miR-23, miR-24, or miR-27 versus control mimic (CM) plotted against the cumulative fraction of all genes (black), miRNA TaregtScan targets (dark grey), and miRNA 8mer match TargetScan targets (light grey). (B) Gene Set Enrichment Analysis of same data for miRNA 8mer match TargetScan targets. Plotted are the enrichment curve for and positional location of each target in the total gene set arrayed in ranked order from most upregulated to most downregulated (left to right) (Nominal p-value <0.001 and FDR q-value <0.001 for each) (C,D) IPA pathway analysis of gene and target networks regulated upstream of IL-4 after transfection with miR-24 (C) or miR-27 (D) mimic versus control mimic in Dgcr8Δ/ΔTbx21−/− CD4+ T cells. Interactions between genes or targets and IL-4 (tan) and targets with genes or targets upstream of IL-4 (black) are depicted. RNA sequencing was performed on 3–4 biologic replicates for each sample. See also Figure S5.
Figure 6
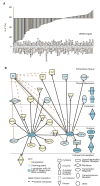
Figure 6. miR-24 and miR-27 candidate targets include known and novel genes that support Th2 cell differentiation and cytokine production
(A) siRNA screen of candidate miRNA target genes. Pools of siRNAs were transfected twice over a 5 day culture period in Mirc11−/−Mirc22ΔT/ΔT CD4+ T cells and IL-4 production measured by intracellular staining. Each bar represents a singlicate measurement. (B) IPA pathway analysis of 9 candidate direct targets of miR-24 and miR-27 that inhibit IL-4 production after re-testing and their connection to downstream expression changes in respective RNAseq expression data sets. All connections to genes that are upstream of IL-4 were also mapped (tan). See also Figure S6.
Figure 7
Figure 7. miR-24 and miR-27 regulate the 3′UTR of target genes
(A) Intracellular staining for GATA3 one day after transfection of Dgcr8Δ/ΔTbx21−/− CD4+ T cells with miRNA mimic or control mimic (CM). Values are expressed as a percent of the CM mean fluorescence intensity (MFI). Each point represents an individual mouse (n=9 from 2 independent experiments, one sample t-test). (B,C) Intracellular staining for GATA3 in ThN conditions in WT and Mirc11−/− Mirc22ΔT/ΔT T cells. Values are expressed as a percent of wildtype (WT) mean fluorescence intensity (MFI) (n=9 from 4 independent experiments, two-tailed t-test). (D) Dual luciferase assay measuring the activity miR-23, miR-24, miR-27 or CM as a ratio of renilla to firefly luciferase on the 3′UTR of select target genes in Dgcr8Δ/ΔTbx21−/− CD4+ T cells one day after transfection. Values are normalized to the global mean across all transfection condition (n=6–12, 3 technical replicates each from 2–5 independent experiments, one-way ANOVA for reduced expression with Dunnett’s multiple comparison test). (E) Dual luciferase assay measuring regulation of the 3′UTR of select target genes in WT and Mirc11−/−Mirc22ΔT/ΔT T cells one day after transfection. Values are normalized to the mean of WT cells transfected with vector alone in each experiment (n=6–18 mice from 2–6 independent experiments, each dot represents the average of technical triplicates for an individual mouse, two-tailed t-test).

Similar articles

Cited by

References

    1. Ansel KM, Djuretic I, Tanasa B, Rao A. Regulation of Th2 differentiation and Il4 locus accessibility. Annu Rev Immunol. 2006;24:607–656. - PubMed
    1. Barski A, Jothi R, Cuddapah S, Cui K, Roh TY, Schones DE, Zhao K. Chromatin poises miRNA- and protein-coding genes for expression. Genome Res. 2009;19:1742–1751. - PMC - PubMed
    1. Baumjohann D, Ansel KM. MicroRNA-mediated regulation of T helper cell differentiation and plasticity. Nat Rev Immunol. 2013;13:666–678. - PMC - PubMed
    1. Behm-Ansmant I, Rehwinkel J, Doerks T, Stark A, Bork P, Izaurralde E. mRNA degradation by miRNAs and GW182 requires both CCR4:NOT deadenylase and DCP1:DCP2 decapping complexes. Genes Dev. 2006;20:1885–1898. - PMC - PubMed
    1. Chong MM, Rasmussen JP, Rudensky AY, Littman DR. The RNAseIII enzyme Drosha is critical in T cells for preventing lethal inflammatory disease. J Exp Med. 2008;205:2005–2017. - PMC - PubMed

Publication types

MeSH terms