Comparative Study
. 2016 Feb 4;61(3):341-351.
doi: 10.1016/j.molcel.2016.01.008.

Synonymous Codons Direct Cotranslational Folding toward Different Protein Conformations

Affiliations
Comparative Study

Synonymous Codons Direct Cotranslational Folding toward Different Protein Conformations

Florian Buhr et al. Mol Cell. .

Abstract

In all genomes, most amino acids are encoded by more than one codon. Synonymous codons can modulate protein production and folding, but the mechanism connecting codon usage to protein homeostasis is not known. Here we show that synonymous codon variants in the gene encoding gamma-B crystallin, a mammalian eye-lens protein, modulate the rates of translation and cotranslational folding of protein domains monitored in real time by Förster resonance energy transfer and fluorescence-intensity changes. Gamma-B crystallins produced from mRNAs with changed codon bias have the same amino acid sequence but attain different conformations, as indicated by altered in vivo stability and in vitro protease resistance. 2D NMR spectroscopic data suggest that structural differences are associated with different cysteine oxidation states of the purified proteins, providing a link between translation, folding, and the structures of isolated proteins. Thus, synonymous codons provide a secondary code for protein folding in the cell.


Figures

Figure 1
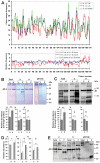
Figure 1. Effect of synonymous codon choice on the expression and stability of gamma-B crystallin in E. coli
(A) Top - codon frequency profiles of gamma-B crystallin variants in: B. taurus (green) and E. coli U (red), H (blue). Bottom - relative differences in usage frequencies. (B) Expression of U and H variants of gamma-B crystallin (γB) in E. coli. Top panel – SDS PAGE: total, soluble (S) and pellet (P) fractions and pET15b empty vector control. Proteins were visualized by Coomassie Brilliant Blue (CBB) staining. Bottom panel – quantification of full-length gamma-B crystallin (γB) and its distribution between S and P fractions. The total protein expression level (set to 100%) is the sum of S and P fractions. (C) Western blotting using polyclonal anti-γB antibodies. The parenthesis indicates truncated products of the U variant expression that are not present or less abundant with H variant. (D) Expression of U and H variants of gamma-B crystallin (γB) in E. coli based on quantitation of all bands detected by Western blotting in Figure 1C (dark grey bars) or by ELISA (light grey bars). The amounts of protein in soluble and pellet fractions are represented as a fraction of total protein. Error bars (B-D) represent the standard error of the mean (SEM); *p<0.05, **p<0.01 by Student’s t-test. (E) Detection of expression products of U and H variants that contain a C-terminal 6×His-tag in total, soluble (S) and pellet (P) fractions of E. coli extracts by Western blotting using monoclonal anti-poly-histidine antibody. See also Figure S1 and Tables S1-S3.
Figure 2
Figure 2. Physico-chemical and structural properties of gamma-B crystallin U and H variants expressed in E. coli as determined by RP-HPLC and 2D-1H-15N-correlation NMR
(A) Preparative pH-gradient ion exchange chromatography: U (red), H (blue). (B) Analytical RP-HPLC of ion exchange fractions U (red), H-P1 (blue), H-P2 (black). (C) Overlay of 2D-1H-15N correlated NMR backbone spectra of 15N-cysteine-labeled U, H-P1 and H-P2. Insets show 1D rows to visualize differential cysteine peak intensities, which are normalized against C109. Full list of peak integrals is presented in Table 1. Lower right quadrant: Crystal structure of bovine gamma-B crystallin (PDB-ID 4GCR); cysteine residues highlighted. (D) 1D summation of rows extracted from 2D-1H-15N backbone datasets recorded for U, H-P1 and H-P2 expressed in 15N-labeled rich medium. Upper panel: Spectra comparison. Lower panel: Spectra after treatment of samples with 10 mM DTT. (E,F) Overlay of 2D-1H-15N correlated NMR spectra for U, H-P1 and U, H-P2. Addition of DTT resulted in full convergence to U-like spectra (Figure S3A). See also Table 1, Figure S3B and S4.
Figure 3
Figure 3. Different translation kinetics of U and H variants in a fully reconstituted E. coli cell-free translation system
(A) Accumulation and size distribution of U (upper panel) and H (lower panel) in vitro translation products. Peptides were separated by SDS-PAGE and visualized by the fluorescence of the BOP label attached to the N-terminus of the peptides. N and C indicate peptides arising during translation of the NTD and CTD, respectively; γBN is the fragment corresponding to the NTD. (B) Kinetic analysis of accumulation of full-length gamma-B crystallin. “Delay” is the time before appearance of the full-length product. “Rate” is the average translation rate (amino acids per second). Error bars show standard deviations (SD) calculated from n=3 replicates. We further tested whether the difference in delay times for H and U is statistically equivalent to a single shared parameter for the delay time in synthesis of γB-crystallin from the U and H mRNA (null hypothesis) or alternatively if two independent parameters for the delay for U or H are justified. According to the extra sum-of-squares F test, the null hypothesis of an identical delay time for U/H is rejected with a significance of p<0.0001 (****). (C) Lifetime of translation intermediates corresponding to the NTD upon translation of U (red) and H (blue) mRNAs. The total intensity of all bands indicated as N in Figure 3A (U and H, respectively) after 10 s of translation was set to 1. (D) Stopped-flow kinetics of synthesis and movement through the ribosome exit tunnel of U (red) and H (blue) nascent chains monitored by a fluorescence reporter (BOP) at the N-terminus of the nascent peptides. The maximum delay in translation of the U sequence relative to H is indicated. Apparent variations in the height of fluorescence changes between U and H are due to differences in the accumulation of the respective nascent peptides resulting from the altered translation rates. (E) Same as D, except using BOF fluorescence as the reporter. See also Figure S5.
Figure 4
Figure 4. Co-translational folding of the NTD monitored in real-time by FRET
Left panel, positions of the donor (BOF) and acceptor (BOP) dyes in the structure of gamma-B crystalline. Middle and right panels, Time-resolved folding of U (red) and H (blue) peptides monitored by FRET between BOP-Met at position 1 and BOF-Cys at position 88 in the stopped-flow apparatus. DA, both donor and acceptor dyes were present; A, control in the absence of the donor. Middle panel: direct comparison of FRET due to folding for the U and H variants. Right panel: FRET signal vs. acceptor direct excitation at donor wavelength; for better comparison, the traces with and without the donor for the U or H variants, respectively, were adjusted to the same starting level; the H traces are arbitrarily shifted from the U traces for visual clarity. Time courses were evaluated using a two-step model comprising a delay phase which shows no change in fluorescence and an exponential phase corresponding to a monomolecular folding reaction using GraphPad Prism. Delay times are 35 ± 0.3 s for H and 50 ± 0.5 s for U. The folding times determined by exponential fitting after delay are 39 ± 1 s for H and 59 ± 1 s for U. See also Figure S5.
Figure 5
Figure 5. Sensitivity of U and H polypeptide chains to pulse proteolysis
(A) Proteolysis of ribosome-bound gamma-B crystallin chains assessed by SDS-PAGE. At different time points of in vitro translation, chains were digested with 5.4 pmol PK for 2 min at 37°C. γB (full-length protein) and γBN (N-terminal domain) protease-resistant products are indicated by arrows. (B) Time courses of accumulation of PK-resistant N-terminal (open circles) and full-length (closed circles) products relative to the undigested protein. The last data point (60 min) was excluded from the exponential fitting, as it represents a decrease in the portion of PK-resistant NTD due to accumulation of the full-length protein. Error bars show the SEM for n=7 replicates. (C) Left panel: PK proteolysis of puromycin-released chains after 3 min of translation. Right panel: quantification of PK resistance of released U (black symbols) and H (gray symbols) products from the data shown in the left panel. Error bars show the SD for n=9 replicates. *p<0.05, **p<0.01, ***p<0.005, ****p<0.0001 by Student’s two-tailed unpaired t-test. See also Figure S6.
Figure 6
Figure 6. Synonymous codon usage directs co-translational folding towards different protein conformations

Similar articles

Cited by

References

    1. Angov E, Hillier CJ, Kincaid RL, Lyon JA. Heterologous protein expression is enhanced by harmonizing the codon usage frequencies of the target gene with those of the expression host. PLoS ONE. 2008;3:e2189. - PMC - PubMed
    1. Aslund F, Zheng M, Beckwith J, Storz G. Regulation of the OxyR transcription factor by hydrogen peroxide and the cellular thiol-disulfide status. Proc. Natl. Acad. Sci. U. S. A. 1999;96:6161–6165. - PMC - PubMed
    1. Bloemendal H, de Jong W, Jaenicke R, Lubsen NH, Slingsby C, Tardieu A. Ageing and vision: structure, stability and function of lens crystallins. Prog. Biophys. Mol. Biol. 2004;86:407–485. - PubMed
    1. Buchan JR, Stansfield I. Halting a cellular production line: responses to ribosomal pausing during translation. Biol. Cell. 2007;99:475–487. - PubMed
    1. Cabrita LD, Dobson CM, Christodoulou J. Protein folding on the ribosome. Curr. Opin. Struct. Biol. 2010;20:33–45. - PubMed

Publication types

MeSH terms