. 2016 Feb 1:7:10492.
doi: 10.1038/ncomms10492.

MDM2 E3 ligase-mediated ubiquitination and degradation of HDAC1 in vascular calcification

Affiliations

MDM2 E3 ligase-mediated ubiquitination and degradation of HDAC1 in vascular calcification

Duk-Hwa Kwon et al. Nat Commun. .

Abstract

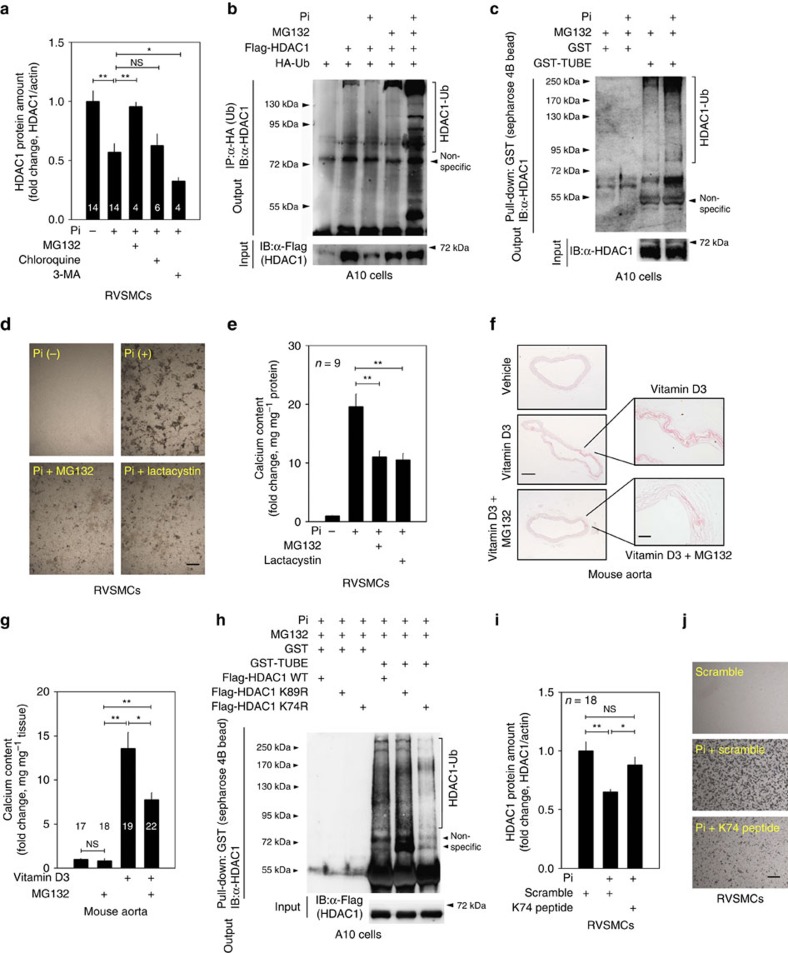
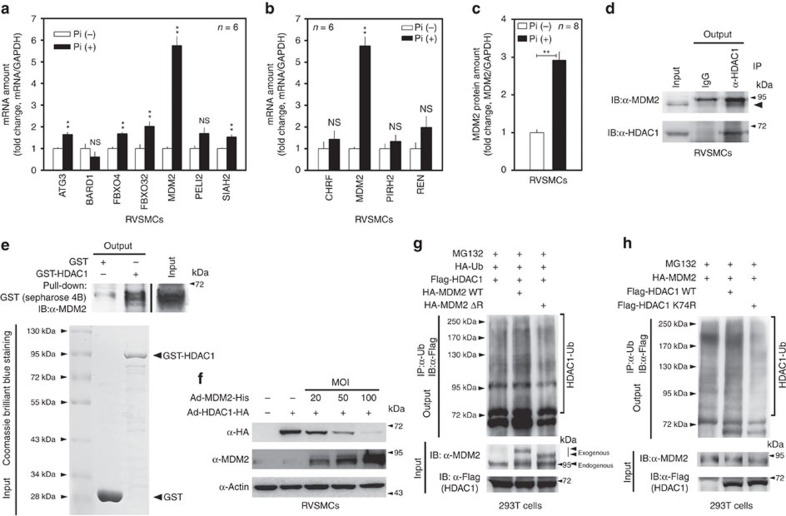
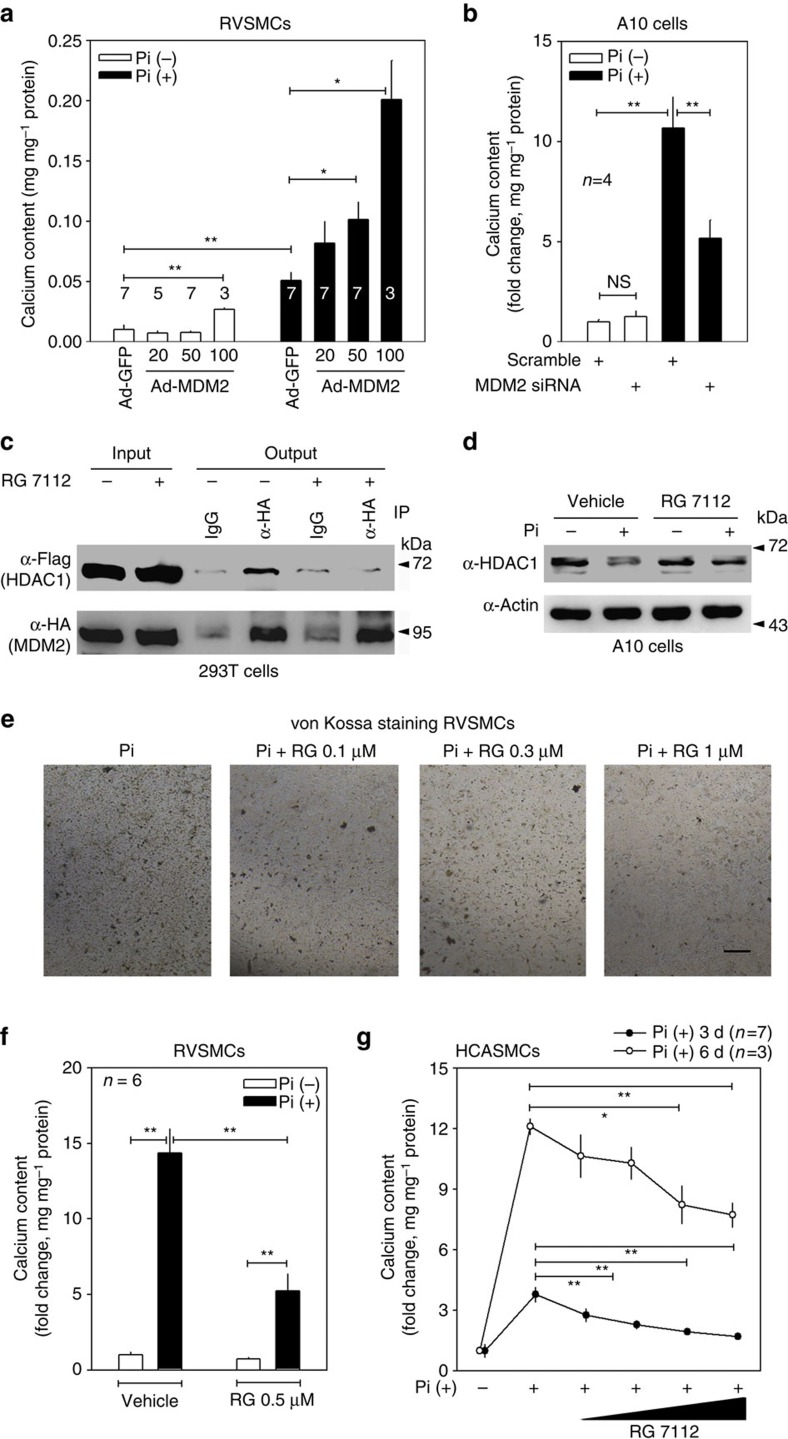
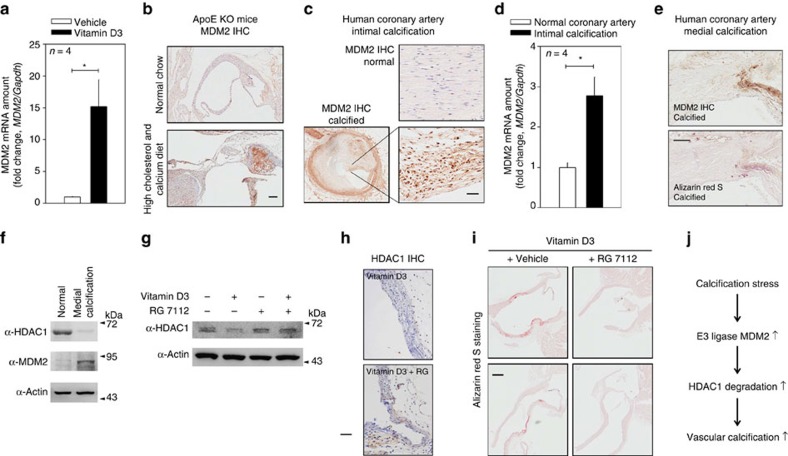
Vascular calcification (VC) is often associated with cardiovascular and metabolic diseases. However, the molecular mechanisms linking VC to these diseases have yet to be elucidated. Here we report that MDM2-induced ubiquitination of histone deacetylase 1 (HDAC1) mediates VC. Loss of HDAC1 activity via either chemical inhibitor or genetic ablation enhances VC. HDAC1 protein, but not mRNA, is reduced in cell and animal calcification models and in human calcified coronary artery. Under calcification-inducing conditions, proteasomal degradation of HDAC1 precedes VC and it is mediated by MDM2 E3 ubiquitin ligase that initiates HDAC1 K74 ubiquitination. Overexpression of MDM2 enhances VC, whereas loss of MDM2 blunts it. Decoy peptide spanning HDAC1 K74 and RG 7112, an MDM2 inhibitor, prevent VC in vivo and in vitro. These results uncover a previously unappreciated ubiquitination pathway and suggest MDM2-mediated HDAC1 ubiquitination as a new therapeutic target in VC.


Figures

Figure 1
Figure 1. HDAC inhibitors potentiate vascular calcification (VC).
(a) Apicidin, a class-I-selective HDACi, potentiated the Pi-induced VC in a dose-dependent manner. VC was induced either by inorganic phosphate (Pi) in rat vascular smooth muscle cells (RVSMCs) or by vitamin D3 (VD3) in mouse. Scale bar, 100 μm. (b) Quantification results. Samples (8–10)were measured from three independent experimental sets. (c) Both 10 nM TSA and 50 nM apicidin potentiated Pi-induced induction of Runx2. Quantitative real-time RT–PCR was performed. Each sample was measured in duplicate and counted as one case (n=5–7 from two sets). (d) Induction of calcification of aorta ex vivo revealed enhancement of VC by Pi. Alizarin red S staining. Scale bar, 100 μm. (e) TSA (0.6 mg kg−1, intraperitoneally for 9 days) potentiated VC induced by VD3 (5 × 10⁵ IU kg−1 per day, subcutaneous administered for the first 3 days). Calcification was determined with Alizarin red S staining. Scale bar, 3 mm. (f) Quantification results of calcium content in the proximal aorta. Calcium contents from four to five mice in one experimental set were measured. Error bars represent s.e.m. *P<0.05, **P<0.01, Numerals in bar graphs are the numbers of samples.
Figure 2
Figure 2. Loss of HDAC1 enhances vascular calcification (VC).
(a) Transfection of HDAC1 small interfering RNA (siRNA, 25 nM) potentiated Pi-induced VC. Von Kossa staining. Scale bar, 100 μm. (b) Quantification results of calcium content in HDAC1 siRNA-transfected A10 cells. Ten samples from three independent sets were measured. (c) Infection of adenoviral HDAC1 (Ad-HDAC1) to RVSMCs blunted Pi-induced VC. RVSMCs were treated with Ad-HDAC1 (50 MOI), kept in serum-free condition for 24 h and then switched to Pi-containing media. Cells were then treated with Ad-HDAC1 every 2 days (n=7 from two sets). (d) Reduction of HDAC2 by HDAC2 siRNA (25 nM) did not potentiate Pi-induced VC (n=15 samples from three sets). (e) Ad-HDAC1 reduced Runx2 mRNA amount. Each sample was measured in duplicate and counted as one case (n=4 from two sets). (f) Vascular smooth muscle cell-specific genetic ablation of HDAC1 (SM22α-cre;HDAC1fl/fl mice, HDAC1-cKO) caused exaggeration of VC induced by administration of VD3 in mice, compared with HDAC1fl/fl control. VD3 was administered to 6–8-week-old HDAC1-cKO or HDAC1fl/fl male mice. Alizarin red S staining. Scale bar, 3 mm. (g) Horizontal sections of aorta showing VC in HDAC1-cKO mice. Scale bar, 200 μm. (h) Quantification results of calcium deposition in HDAC1-cKO mouse aorta. (i) Computed tomography (CT) images showing enhanced calcification in the arch of aorta. Arrows indicate the calcification foci at the proximal aorta and its branches. Upper panels: CT images. Lower panels: three-dimensional reconstruction images. Scale bar, 1 mm. Error bars represent s.e.m. *P<0.05, **P<0.01, NS, not significant. Numerals in bar graphs are the numbers of samples.
Figure 3
Figure 3. HDAC1 protein, but not mRNA, is reduced in VC.
(a) Among the class I HDACs, HDAC1 and HDAC2 protein amounts were reduced by Pi treatment. (b) Time course of calcium deposition (open circle) and HDAC1 protein reduction (black circle). Note that HDAC1 protein reduction precedes substantial increase in calcium content. Calcium contents were measured in 22 samples from six sets and quantification results of HDAC1 protein amounts were obtained from five samples out of three independent sets of experiments. (c) Changes in HDAC1 mRNA levels. mRNA content was determined with quantitative real-time RT–PCR. Each sample was measured in duplicate and counted as one case (n=3 from one set). (d) Cycloheximide (CHX) chase study elicited enhancement of HDAC1 protein decay by Pi. After treatment with Pi (2 mM, 6 days), 20 μg ml−1 CHX was treated for the indicated interval. Values were averaged from two experiments. (e) VD3 significantly reduced the protein amount of HDAC1 in the aorta in a dose-dependent manner. Quantification results from 12 western blots from four independent experimental sets. (f) Immunohistochemical analysis showed the reduction of HDAC1 in atherosclerosis-associated calcification mouse models. Ten-week-old ApoE knockout (KO) male mice were fed a high-cholesterol diet for 10 weeks followed by a high-cholesterol plus calcium diet for the next 7 weeks. The HDAC1 expression level was downregulated in the tissues adjacent to the calcified focus (arrowheads). Scale bar, 100 μm. (g) Immunohistochemical analysis showed a reduction of HDAC1 in an alternative atherosclerosis animal model. ApoE KO male mouse aorta was subjected to carotid artery ligation to induce sheer stress and atherosclerosis developed. Some mice showed calcified foci (arrowheads) adjacent to the atherosclerotic plaque where HDAC1 expression was lowered. Scale bar, 25 μm. (h) HDAC1 protein level was downregulated in atherosclerosis-associated human coronary artery. Arrowheads indicate HDAC1-positive nuclei. Scale bar, 500 μm (low power); 25 μm (high power). *P<0.05, **P<0.01.
Figure 4
Figure 4. HDAC1 is ubiquitinated in VC.
(a) MG132 (10 μM, proteasome inhibitor) but not chloroquine (100 μM, lysosome inhibitor) nor 3-methyladenine (2 mM, autophagy inhibitor) blocked Pi-induced reduction of HDAC1. (b) Ubiquitination of HDAC1 was enhanced by Pi treatment for 3 days (fourth versus 5th lane). Twenty-four hours after transfection with Flag-HDAC1 and HA-Ub, A10 cells were treated with Pi. MG132 was added 4 h before collecting. The cell lysates were immunoprecipitated with anti-HA antibody and immunoblotted with anti-HDAC1 antibody. Western blots (4–14) from four to eight independent sets were analysed. (c) Tandem ubiquitin-binding entities (TUBEs) assay to check K48 ubiquitination of HDAC1 in response to Pi. Pi-treated RVSMCs were subjected to GST pull-down assay with either GST only or GST-TUBE and then HDAC1 was detected with immunoblot. HDAC1-bound multiple ubiquitin conjugation was detected. A10 cells were treated with Pi for 3 days. (d) Von Kossa staining showed that Pi-induced RVSMC calcification was blunted by either MG132 (10 μM) or lactacystin (10 μM). Scale bar, 100 μm. (e) Quantification results (n=9 from three sets). (f) Administration of MG132 to mice blunted VD3-induced VC. MG132 (2.5 mg kg−1 per day, intraperitoneally) was administered for 9 days, whereas VD3 was treated for the first 3 days. Scale bar, 250 μm (low power); 50 μm (high power). (g) Quantification of calcium deposition in proximal aorta (17–22 aortic samples from four to six independent experimental sets). (h) TUBE assay revealed that HDAC1 ubiquitination is dependent on K74. Treatment of A10 cells with Pi for 3 days failed to induce ubiquitination of HDAC1 K74R, whereas it successfully induced ubiquitination of HDAC1 K89R. (i) Decoy peptide spanning HDAC1 K74 attenuated Pi-induced reduction of HDAC1 protein amount (eight samples from two sets). (j) K74 peptide attenuated Pi-induced calcium deposition. Von Kossa staining was performed. Scale bar, 100 μm. *P<0.05, **P<0.01, NS. not significant. Numerals in bar graphs are the numbers of samples.
Figure 5
Figure 5. MDM2 E3 ligase induces degradation of HDAC1.
(a) Pi-induced changes in the mRNA level of seven candidate genes according to cDNA microarray analysis (n=6 from two sets). Each sample was measured in duplicate. (b) Pi-induced changes in the mRNA level of four candidate genes on the basis of reports in the literature of HDAC1-specific E3 ligases (n=6 from two sets). Note that MDM2 was listed among both the cDNA microarray-based candidates (a) and the literature-based ones (b). (c) Pi significantly increased MDM2 protein expression (n=8 from two sets). (d) Immunoprecipitation analysis showed that endogenous HDAC1 physically associated with endogenous MDM2 in RVSMCs. (e) GST pull-down assay to show the direct interaction between MDM2 and HDAC1. Both GST-HDAC1 and His-MDM2 proteins were generated from E. coli and then utilized for GST pull-down assay. MDM2-His was recruited by Sepharose 4B-bound GST-HDAC1. (f) Adenoviral infection of MDM2 induced dose-dependent reduction of HDAC1 protein in RVSMCs. Cells were treated with an equal amount of Ad-HDAC1 (20 MOI) in each case. (g) Transfection of wild-type MDM2 to 293T cells enhanced the ubiquitination of HDAC1 (second lane). However, transfection of MDM2ΔR that lacked the RING domain for E3 ligase activity failed to do so (third lane). Flag-HDAC1 and HA-Ub with either HA-MDM2 or HA-MDM2ΔR were transfected and maintained for 2 days. Cells were treated with MG132 4 h before collecting. The cell lysates were immunoprecipitated with Ub and immunoblotted with HDAC1. (h) MDM2-induced HDAC1 ubiquitination was attenuated in HDAC1 K74R. Ub assay was performed. **P<0.01, NS, not significant.
Figure 6
Figure 6. MDM2 induces VC.
(a) Adenoviral infection of MDM2 enhanced Pi-induced VC in a dose-dependent manner. Numbers under the horizontal axis are the MOI of adeno-MDM2 (n=3–7 from one to two experimental sets). (b) MDM2 siRNA blunted Pi-induced VC in A10 cells (n=9 from three sets). Either MDM2 siRNA or scramble was transfected with Lipofectamine RNAiMAX. (c) Immunoprecipitation analysis to show that RG 7112 (RG), an MDM2 inhibitor, interfered with the association of HDAC1 with MDM2. Note the physical interaction between HDAC1 and MDM2 (fourth lane) was attenuated by RG treatment (sixth lane). HA-MDM2 and Flag-HDAC1 were transfected and either RG (2.5 μM) or vehicle was treated for 24 h in 293T cells. (d) RG (0.1 μM) blocked the Pi-induced reduction of HDAC1 protein amount in A10 cells. (e) RG attenuated Pi-induced VC in RVSMCs in a dose-dependent manner. Pi-containing media with either RG or vehicle were replaced every 2 days for 6 days and von Kossa staining was performed. Scale bar, 100 μm. (f) Quantification results to show the inhibitory effect of RG on Pi-induced VC. RG (0.5 μM) significantly reduced the calcium deposition in RVSMCs (n=6 from two sets). (g) Dose-dependent attenuation of calcium deposition by RG compound (0.1–3 μM) in human coronary artery smooth muscle cells (HCASMCs). Pi was treated for 3 days (filled circle, n=7 from two sets) or 6 days (open circle, n=3 from one set). *P<0.05, **P<0.01.
Figure 7
Figure 7. MDM2 is upregulated in VC models and inhibition of MDM2 activity reduces VC in mice.
(a) MDM2 mRNA level was upregulated in the aorta of VD3-administered mice (four mice from two sets). Each sample was measured in duplicate. (b) Immunohistochemical analysis showing MDM2 expression in ApoE mice fed high cholesterol and calcium as explained in Fig. 3f. Scale bar, 100 μm. (c) Immunohistochemical analysis showing that MDM2 expression is increased in the atherosclerosis-associated intimal calcification model of human coronary artery. The adjacent section slide was used with Fig. 3h. Scale bar, 50 μm. (d) Quantitative real-time RT–PCR results show that MDM2 mRNA level is significantly increased in the intimal calcification model of human coronary artery (four samples in duplicate). (e) MDM2 expression was increased at the site of calcification in human coronary artery with medial calcification in association with diabetes. Scale bar, 200 μm. (f) HDAC1 was downregulated, whereas MDM2 was upregulated, in human coronary artery sample with medial calcification. (g) Administration of RG (intraperitoneally, 50 mg kg−1 per day, 9 days) prevented VD3-induced reduction of HDAC1 protein amount in mouse aorta. (h) Immunohistochemical analysis showing HDAC1 expression in VD3-treated mice. Note that nuclear expression of HDAC1 was restored by administration of RG. Scale bar, 50 μm. (i) Intraperitoneal administration of RG prevented VD3-induced VC in the ascending aorta. Scale bar, 250 μm. (j) Diagram of MDM2/HDAC1 signal cascade in VC. *P<0.05.

Similar articles

Cited by

References

    1. Frink R. J., Achor R. W., Brown A. L. Jr, Kincaid O. W. & Brandenburg R. O. Significance of calcification of the coronary arteries. Am. J. Cardiol. 26, 241–247 (1970). - PubMed
    1. Fitzgerald P. J., Ports T. A. & Yock P. G. Contribution of localized calcium deposits to dissection after angioplasty. An observational study using intravascular ultrasound. Circulation 86, 64–70 (1992). - PubMed
    1. Giachelli C. M. Ectopic calcification: gathering hard facts about soft tissue mineralization. Am. J. Pathol. 154, 671–675 (1999). - PMC - PubMed
    1. Luo G. et al. Spontaneous calcification of arteries and cartilage in mice lacking matrix GLA protein. Nature 386, 78–81 (1997). - PubMed
    1. Kuro-o M. et al. Mutation of the mouse klotho gene leads to a syndrome resembling ageing. Nature 390, 45–51 (1997). - PubMed

Publication types