. 2016 Jan 28;164(3):433-46.
doi: 10.1016/j.cell.2015.12.042.

Phosphoinositide 3-Kinase Regulates Glycolysis through Mobilization of Aldolase from the Actin Cytoskeleton

Affiliations

Phosphoinositide 3-Kinase Regulates Glycolysis through Mobilization of Aldolase from the Actin Cytoskeleton

Hai Hu et al. Cell. .

Abstract

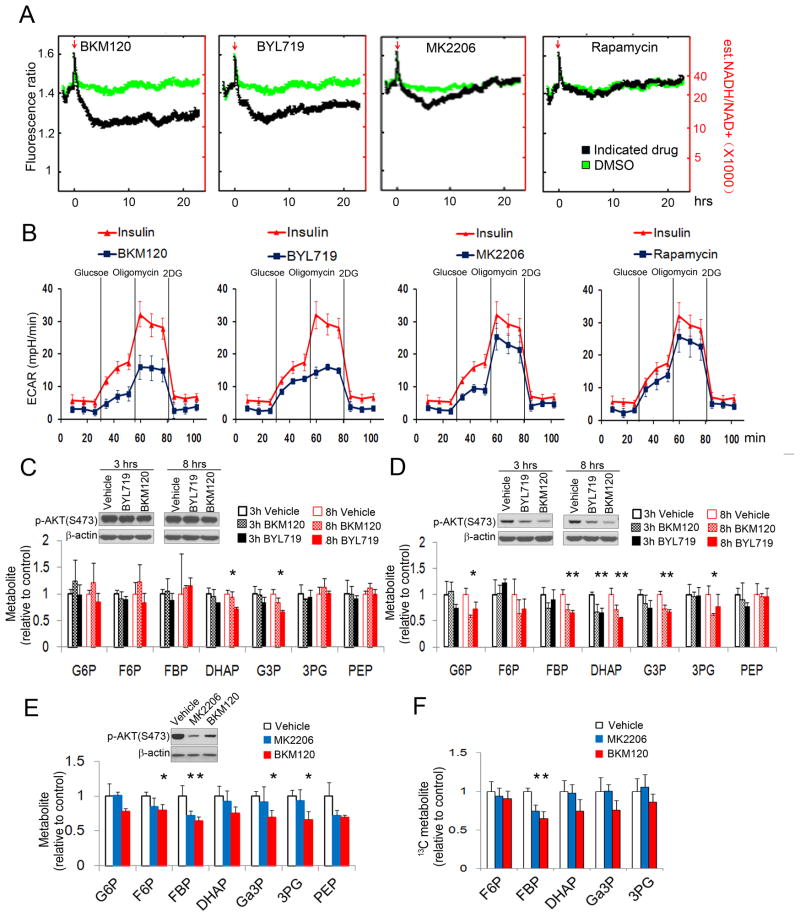
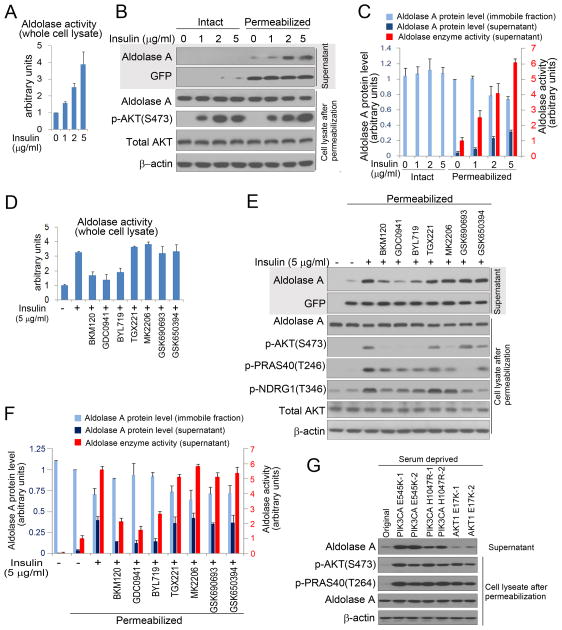
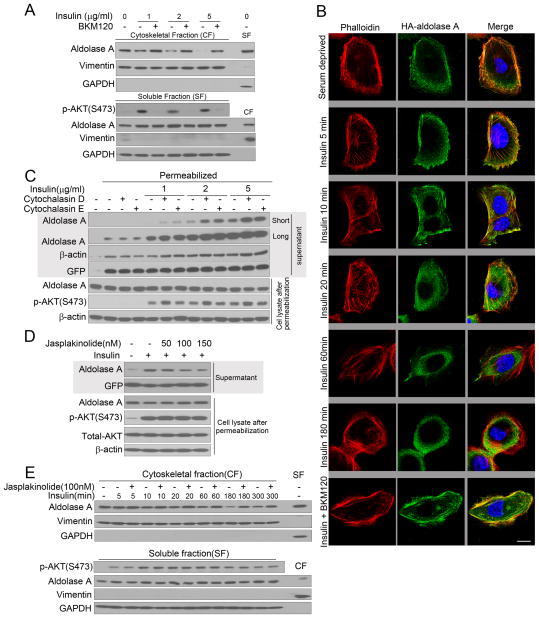
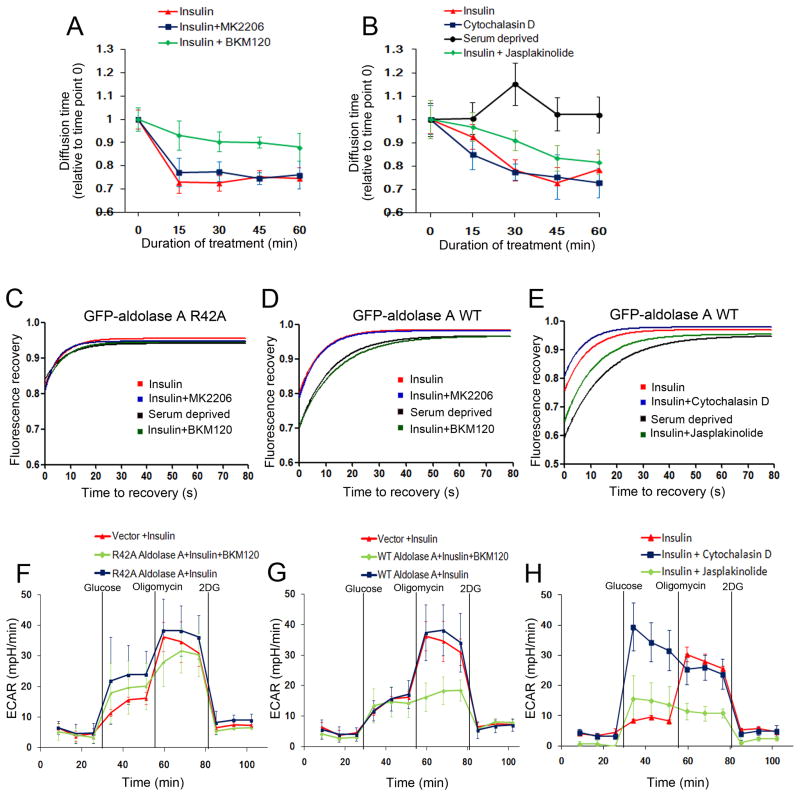
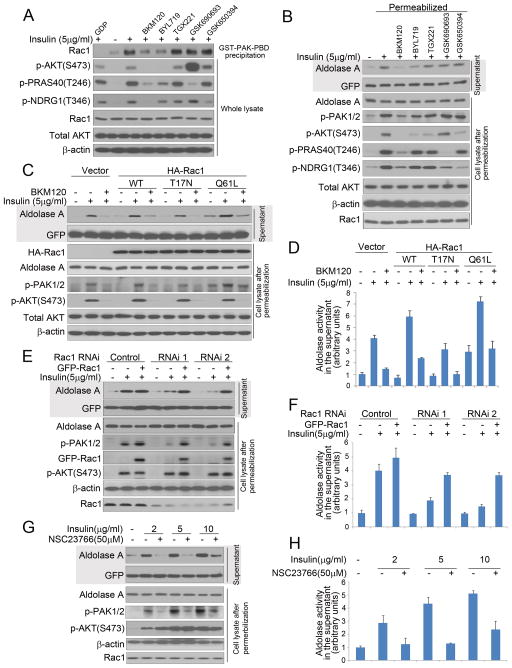
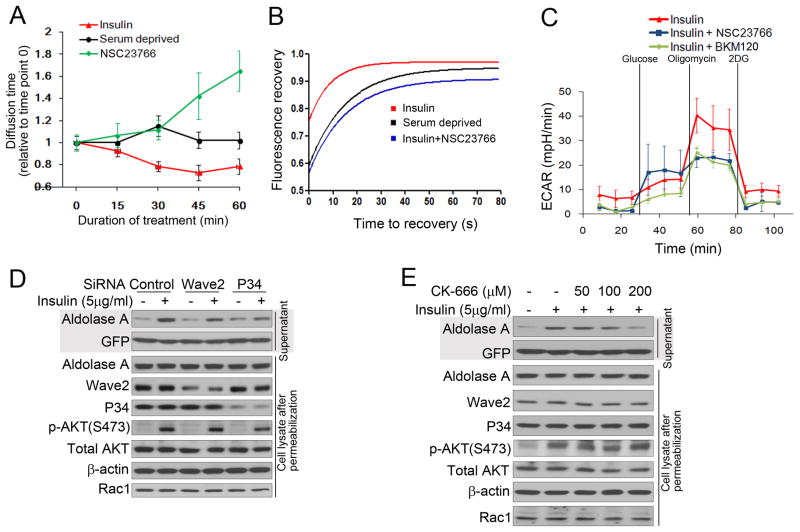
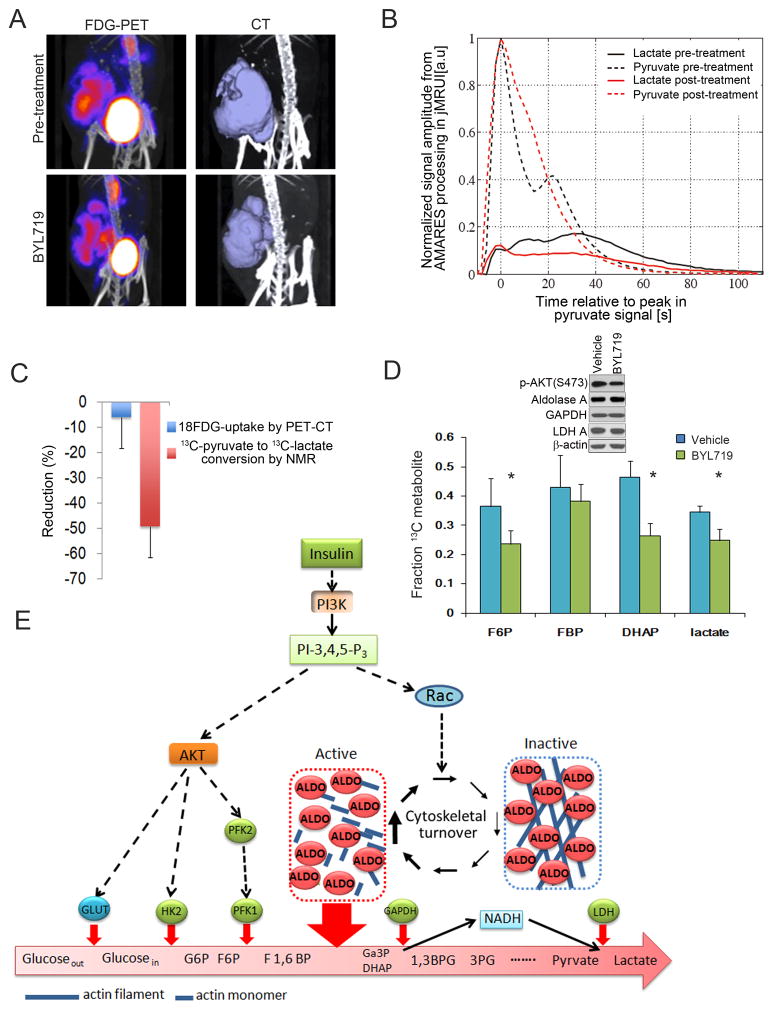
The phosphoinositide 3-kinase (PI3K) pathway regulates multiple steps in glucose metabolism and also cytoskeletal functions, such as cell movement and attachment. Here, we show that PI3K directly coordinates glycolysis with cytoskeletal dynamics in an AKT-independent manner. Growth factors or insulin stimulate the PI3K-dependent activation of Rac, leading to disruption of the actin cytoskeleton, release of filamentous actin-bound aldolase A, and an increase in aldolase activity. Consistently, PI3K inhibitors, but not AKT, SGK, or mTOR inhibitors, cause a significant decrease in glycolysis at the step catalyzed by aldolase, while activating PIK3CA mutations have the opposite effect. These results point toward a master regulatory function of PI3K that integrates an epithelial cell's metabolism and its form, shape, and function, coordinating glycolysis with the energy-intensive dynamics of actin remodeling.


Conflict of interest statement

Conflicts of interest: LCC has consulted for Novartis, which is developing BKM120 and BYL719 for cancer treatment; he is a member of the board of directors and a consultant/advisory board member for Agios, for which he also has ownership interests (including patents).

Figures

Figure 1
Figure 1
Inhibition of AKT does not phenocopy the effects of PI3K inhibition on glycolysis. A, B. PI3K-, but not AKT- or mTOR-inhibitors decrease the cytosolic NADH/NAD+ ratio and glycolysis in MCF10A cells. The NADH/NAD+ ratio (A) was determined in MCF10A cells expressing the fluorescent biosensor Peredox (Hung et al., 2011) treated with inhibitors of pan-PI3K (BKM120, 2.5 μM), PI3Kα (BYL719, 2.5 μM), AKT (MK2206, 200 nM), or mTOR (Rapamycin, 100 nM; see Tab S1 for a list of the inhibitors). The ratio of NADH/NAD+ (right scale, red numbers) was estimated based on in vitro calibration experiments shown in (Hung et al., 2011). The red arrow indicates start of treatment. Each curve represents the median biosensor response for a population of ~300–700 cells, acquired in two independent assays. B. Glycolysis, including glycolytic reserve (mobilized and extinguished with Oligomycin or 2-deoxy-glucose (2DG) respectively) were measured using a Seahorse instrument after pre-incubation with drugs or insulin. Shown are ECAR means ± SD of experimental triplicates. C, D. Effect of the pan-PI3K inhibitor BKM120 and the PI3Kα inhibitor BYL719 on glycolytic intermediates in MCF10A cells expressing constitutively active mAKT1 (C) or WT AKT1 (D). Cells were treated with BKM120 (1 μM) or BYL719 (1 μM) for 3 or 8 hours, and metabolite abundance determined by mass spectrometry. E, F. Effects of BKM120 or MK2206 on glycolytic intermediates in HCC1937 cells, E. Steady-state after 16 hours of treatment; F. cells were treated with inhibitors as indicated for 3 hours, glucose was replaced with [U-13C]-glucose for 0.5 min before extraction flux analysis. All metabolite levels (Tab. S2) were normalized to vehicle control, each bar represents the mean ± SD of experimental triplicates.
Figure 2
Figure 2
PI3K pathway activation promotes mobilization of aldolase and increases its catalytic activity. A. Aldolase activity in response to insulin stimulation. GFP-expressing MCF10A were serum-starved overnight, insulin-stimlated for 3 hours, lysed with Digitonin (100 μg/ml), followed by aldolase enzyme activity determination. B. Cells were treated as in A. Where indicated, cells were permeabilized with digitonin (30 μg/ml) for 5 min. Supernatant (upper two panels) and cell lysate (lower 4 panels) for each assay were subjected to immunoblotting as indicated. C. Quantification of aldolase A in the immobile (cell lysate) and the diffusible fraction (supernatant) by immunoblotting (for scan see Fig. S2A), and of aldolase activity in the immobile fraction (supernatant). Bar graphs represent means ± SD of three independent experiments. D. Serum- and growth factor deprived MCF10A cells were prepared as in A, pre-treated with drugs for 15 min, followed by addtion of insulin for 3 hours, lysed with Digitonin (100 μg/ml) and aldolase activity was determined. Bar graphs represent means ± SD of three independent experiments. E. MCF10 cells were treated as in D, and permeabilized with Digitonin (30 μg/ml). Supernatant and cell lysate were collected separately for immunoblotting. F. Quantification of aldolase A protein in the immobile fraction (cell lysate) and in the diffusible fraction (supernatant), and determination of aldolase activity in the supernatant (for scan see Fig. S2B and C). Bar graphs represent means ± SD of experimental triplicates. G. Determination of free aldolase in MCF10A cells with knock-in mutations of activating mutations in PIK3CA (E545K, H1047 R) or AKT1 (E17K). Digitonin permeabilization as in B; quantification of aldolase release in three independent experiments is provided in Fig. S3F. See Tab. 1 for details on drugs used.
Figure 3
Figure 3
PI3K activation mobilizes aldolase from F-actin. A. MCF10A cells were prepared as in Fig. 2 D, lysed and fractionated. Vimentin is used as a marker for the cytoskeletal (CF) and GAPDH for the soluble fraction (SF). Fractions from untreated cells are controls for the fractionation procedure (far-right lane) (also see Fig. S3G). B. Co-localization of aldolase with F-actin is disrupted by PI3K activation. HA-ALDOA (visualized with Alexa-green) was transfected into HMEC cells. Cells were serum-starved, pretreated with BKM120 or vehicle control for 15 min, followed by addition of insulin, fixation, immunostaining (green) and phalloidin staining (red). Scale bar represents 10 μm. C. The actin polymerization status affects insulin-induced aldolase mobilization from the cytoskeleton. MCF-10A were treated as in Fig. 2 D, except that cytochalasin D or E were used, permeabilized and supernatant and lysates were collected (also see Fig. S3H). D. MCF10A were treated as in Fig. 3C, except that Jasplakinolide was used to stabilize F-actin (also see Fig. S3I). E. Time course of aldolase mobilization from the cytoskeleton and its reversal by actin stabilization (also see Fig. S3J).
Figure 4
Figure 4
Regulation of aldolase dynamics and glycolytic flux by PI3K and F-actin remodeling. Fluorescence correlation spectroscopy (FCS) measures the mobility of GFP-aldolase molecules as they cross the path of a laser beam focused on a given point in the cytoplasm (also see Fig. S4 C, D). Fluorescence recovery after photobleaching (FRAP) measures the influx of fluorescent GFP-aldolase into a cytoplasmic area after photobleaching (Fig. S5 and S6). A, B. FCS of GFP-aldolase transfected into MCF10A cells. Serum or growth factor-deprived cells were scanned and treated with insulin in the absence or presence of drugs as indicated. Every 15 min, the diffusion time was obtained for at least 8 different cells. Displayed are means +/− SD relative to control, i.e. time point 0 prior to insulin and/or drug treatment. C, D, E. FRAP analysis of GFP-aldolase. HMEC cells expressing the aldolase mutant GFP-R42A ALDOA (C) or GFP-WT ALDOA (D, E) were serum-deprived and treated with BKM120, MK2206 (C, D) and the actin de-stabilizing Cytochalasin D or actin-stabilizing Jasplakinolide (E). Insulin was added 15 min after drugs for a total of 3 hours. Time point zero is set to the start of the recording of the recovery signal following completion of the laser pulsing (7 seconds) and recovery was recorded every 4 seconds. For each condition, at least 14 different cells were analyzed over time. Note that diffusion of the GFP-proteins continues during the bleach, leading to a y-intercept of 0.8 for GFP-R42A aldolase A (C) and 0.7 for GFP-WT aldolase A under serum starvation (D and E). F–H. The actin-aldolase interaction regulates glycolysis. MCF10A cells were transfected with vector control, HA-R42A-ALDOA (F) or HA-WT-ALDOA (G) (also see Fig. S4E) and treated with BKM120 (F, G) or Cytochalasin D or Jasplakinolide (H) and insulin and subjected to ECAR determination as described in Fig. 1 B. See Tab. S1 for details on drugs used.
Figure 5
Figure 5
Aldolase mobilization from the cytoskeleton is regulated by PI3K through the Rac pathway. A. Binding of endogenous, activated Rac1 to the PAK1-PBD is prevented by PI3K-inhibition. MCF10A cells were prepared as in Fig 2D and lysed. In lane 1, GDP (1 mM final concentration) was added prior to precipitation as a negative control. Immunoblotting of GST-PAK-PBD precipitates (first row) or total lysates (rows 2–7) as indicated (also see Fig. S7A). B Inhibition of total PI3K and PI3Kα but not inhibition of AKT, SGK or PI3Kβ, prevents insulin-induced PAK1/2 phosphorylation and aldolase mobilization (see Tab. S1 for details on drugs used). Treatment of cells and collection of supernatant and immobile fractions were as in Fig. 2E. C. Effects of Rac1 mutants on insulin-induced aldolase mobilization. MCF10A cells were transfected with control vector, HA-Rac1, dominant negative HA-Rac1T17N, or constitutively active HA-Rac1Q61L, treated with BKM120 and insulin, permeabilized and lysed as in Fig. 2E (also see Fig. S7D). D. Quantification of aldolase activity in the supernatant of cells treated in C as described in 2F. Bar graphs represent means ± SD of experimental triplicates. E. Depletion of Rac1 decreases insulin-induced aldolase mobilization from F-actin. MCF10A cells were transfected with Rac1 siRNAs or controls and treated as in Fig. 2B. SiRNA resistant GFP-Rac1 expression constructs were used to rescue the siRNA-mediated effects (also see Fig. S7E). F. Quantification of aldolase activity in the supernatant of cells treated in E, as described in Fig. 2C. Bar graphs represent means ± SD of three independent experiments. G. Rac inhibition prevents insulin induced mobilization of aldolase A. MCF10A cells were treated as in Fig. 2E except that a Rac inhibitor (NSC23766) was used (also see Fig. S7F). H. Quantification of aldolase activity in the supernatant of permeabilized cells treated in G. Bar graphs represent means ± SD of experimental triplicates.
Figure 6
Figure 6
Rac1 inhibition reduces insulin-induced aldolase mobilization from F-actin and glycolytic flux A. Two-photon fluorescence correlation spectroscopy of GFP-aldolase transfected into MCF10A cells. Serum or growth factor-deprived cells were scanned and then treated with insulin in the absence or presence of the Rac inhibitor NSC23766. FCS was performed as described in Fig. 4 A. B. FRAP analysis of GFP-aldolase. Cells expressing GFP-WT ALDOA were serum-deprived overnight, stimulated for 3 hours with insulin in the absence or presence of the Rac inhibitor and FRAP was determined as in Fig. 4C (also see Fig. S6). C. Rac-inhibtion decreases the glycolytic reserve similar to PI3K-inhibition. MCF10A cells were treated with PI3K- or Rac-inhibitor and insulin and subjected to ECAR determination as described in Fig. 1 B. D. Depletion of Wave2 or P34 decreases insulin-induced aldolase mobilization from F-actin. MCF10A cells were transfected with pooled siRNAs or controls and then treated as in Fig. 2B (also see Fig. S7I). E. Arp2/3 complex inhibition prevents insulin induced mobilization of aldolase A. MCF10A cells were treated as in Fig. 2E, except that a Arp2/3 complex inhibitor (CK-666) was used (also see Fig. S7J).
Figure 7
Figure 7
The PI3K-inhibitor BYL719 blocks glycolysis in breast cancers in vivo. Cohorts of mice with breast cancer were created through syngeneic transplantation of K14-Cre BRCA1f/f p53f/f tumors and randomized to control or BYL719. Mice were treated twice with BYL719, 12 hours and again 2 hours prior to the MRI or PET-CT scans. A. Effect of BYL719 on tumoral 18FDG uptake. Mice were scanned and tumor uptake determined before (upper panel) and after (lower panel) treatment with BYL719. FDG-PET (left panels) and computer tomography (right panels) were obtained simultaneously. B. Time dependence of the 1-13C-pyruvate and 1-13C-lactate signals in a representative tumor following injection of hyperpolarized 1-13C-pyruvate solution. Tumor-bearing mice (n=4) were scanned at baseline and after BYL719. For each scan a ~10 second bolus of 13C-pyruvate was given via tail vein injection and slice-selective 13C spectra were acquired every 2 seconds starting at the time of the injection. C. Summary of the reduction in 18FDG-uptake and pyruvate to lactate conversion upon in vivo treatment with BYL719. The bar graph represents the mean reduction observed between pre- and post-treatment scans (done within a 2–4 day window) for each of the two modalities. D. Effect of BYL719 on the metabolism of [U-13C6] glucose in breast tumors in vivo. Mice were injected intraperitoneally with a [U-13C6]-glucose solution and metabolites extracted from the tumors. Data are presented as the fractional labeling of the pool (Tab. S3). Error bars represent the means ± SD of four tumors per treatment group. Immunoblot insert shows target inhibition (pAKT) and metabolic enzyme levels in tumors. E. PI3K activation promotes glycolysis through mobilization of aldolase from the cytoskeleton. PI3K-initiated AKT activation leads to increased glucose import and positively regulates the hexokinase and phosphofructokinase reactions, providing increased substrate for the aldolase reaction. In parallel, PI3K-activation accelerates actin dynamics via Rac increasing levels of free, cytoplasmic aldolase thereby coordinates the generation of ATP and biomass with the energy-intensive process of cytoskeletal remodeling.

Similar articles

Cited by

References

    1. Albe KR, Butler MH, Wright BE. Cellular concentrations of enzymes and their substrates. J Theor Biol. 1990;143:163–195. - PubMed
    1. Arnold H, Pette D. Binding of aldolase and triosephosphate dehydrogenase to F-actin and modification of catalytic properties of aldolase. European journal of biochemistry/FEBS. 1970;15:360–366. - PubMed
    1. Barthel A, Kohn AD, Luo Y, Roth RA. A constitutively active version of the Ser/Thr kinase Akt induces production of the ob gene product, leptin, in 3T3-L1 adipocytes. Endocrinology. 1997;138:3559–3562. - PubMed
    1. Benard V, Bohl BP, Bokoch GM. Characterization of rac and cdc42 activation in chemoattractant-stimulated human neutrophils using a novel assay for active GTPases. The Journal of biological chemistry. 1999;274:13198–13204. - PubMed
    1. Brachmann SM, Yballe CM, Innocenti M, Deane JA, Fruman DA, Thomas SM, Cantley LC. Role of phosphoinositide 3-kinase regulatory isoforms in development and actin rearrangement. Mol Cell Biol. 2005;25:2593–2606. - PMC - PubMed

Publication types

Substances