p53 deficiency linked to B cell translocation gene 2 (BTG2) loss enhances metastatic potential by promoting tumor growth in primary and metastatic sites in patient-derived xenograft (PDX) models of triple-negative breast cancer
- PMID: 26818199
- PMCID: PMC4728775
- DOI: 10.1186/s13058-016-0673-9
p53 deficiency linked to B cell translocation gene 2 (BTG2) loss enhances metastatic potential by promoting tumor growth in primary and metastatic sites in patient-derived xenograft (PDX) models of triple-negative breast cancer
Abstract
Background: Despite advances in early diagnosis and treatment of cancer patients, metastasis remains the major cause of mortality. TP53 is one of the most frequently mutated genes in human cancer, and these alterations can occur during the early stages of oncogenesis or as later events as tumors progress to more aggressive forms. Previous studies have suggested that p53 plays a role in cellular pathways that govern metastasis. To investigate how p53 deficiency contributes to late-stage tumor growth and metastasis, we developed paired isogenic patient-derived xenograft (PDX) models of triple-negative breast cancer (TNBC) differing only in p53 status for longitudinal analysis.
Methods: Patient-derived isogenic human tumor lines differing only in p53 status were implanted into mouse mammary glands. Tumor growth and metastasis were monitored with bioluminescence imaging, and circulating tumor cells (CTCs) were quantified by flow cytometry. RNA-Seq was performed on p53-deficient and p53 wild-type tumors, and functional validation of a lead candidate gene was performed in vivo.
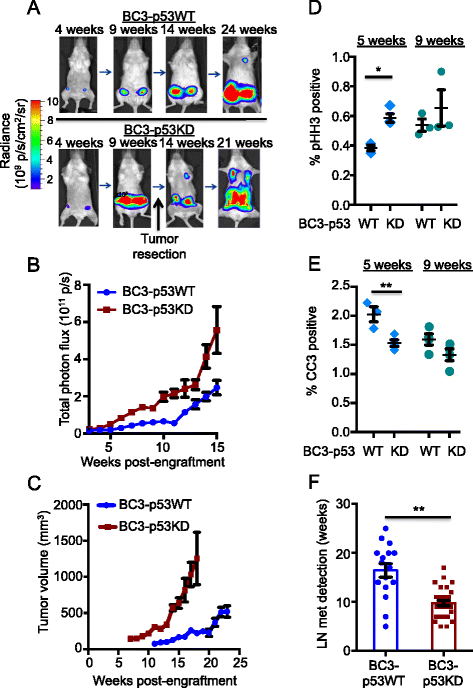
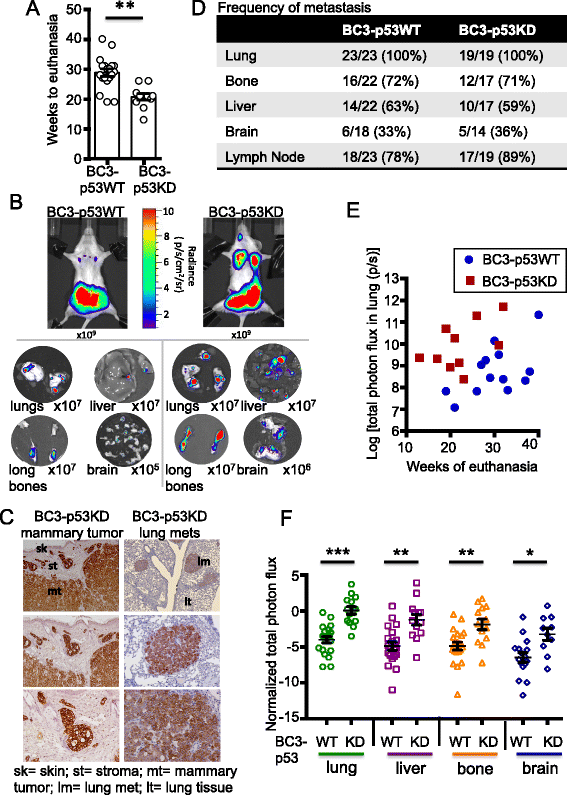
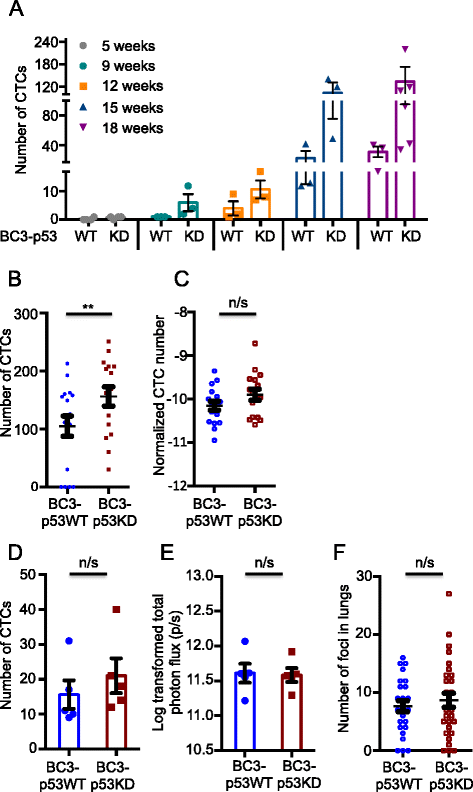
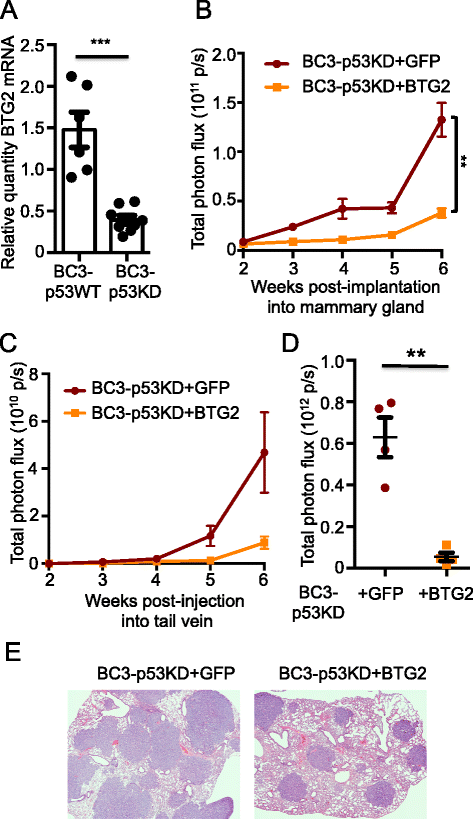
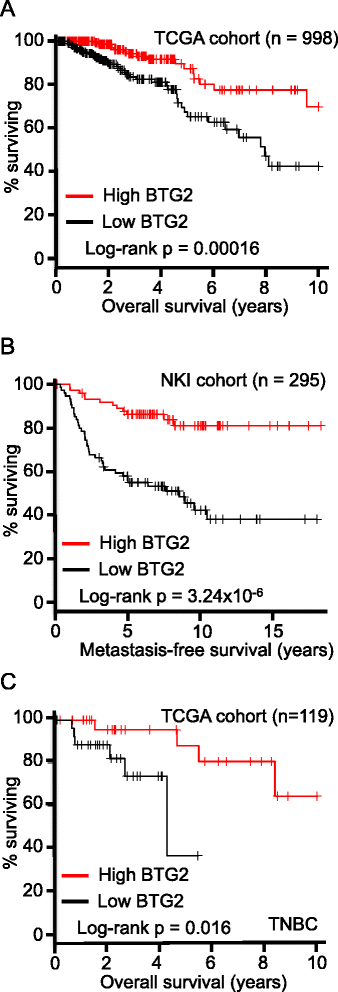
Results: Isogenic p53 wild-type and p53-deficient tumors metastasized out of mammary glands and colonized distant sites with similar frequency. However, p53-deficient tumors metastasized earlier than p53 wild-type tumors and grew faster in both primary and metastatic sites as a result of increased proliferation and decreased apoptosis. In addition, greater numbers of CTCs were detected in the blood of mice engrafted with p53-deficient tumors. However, when normalized to tumor mass, the number of CTCs isolated from mice bearing parental and p53-deficient tumors was not significantly different. Gene expression profiling followed by functional validation identified B cell translocation gene 2 (BTG2), a downstream effector of p53, as a negative regulator of tumor growth both at primary and metastatic sites. BTG2 expression status correlated with survival of TNBC patients.
Conclusions: Using paired isogenic PDX-derived metastatic TNBC cells, loss of p53 promoted tumor growth and consequently increased tumor cell shedding into the blood, thus enhancing metastasis. Loss of BTG2 expression in p53-deficient tumors contributed to this metastatic potential by enhancing tumor growth in primary and metastatic sites. Furthermore, clinical data support conclusions generated from PDX models and indicate that BTG2 expression is a candidate prognostic biomarker for TNBC.
Figures
Similar articles
-
MiR-25-3p promotes the proliferation of triple negative breast cancer by targeting BTG2.Mol Cancer. 2018 Jan 8;17(1):4. doi: 10.1186/s12943-017-0754-0. Mol Cancer. 2018. PMID: 29310680 Free PMC article.
-
Investigating circulating tumor cells and distant metastases in patient-derived orthotopic xenograft models of triple-negative breast cancer.Breast Cancer Res. 2019 Aug 28;21(1):98. doi: 10.1186/s13058-019-1182-4. Breast Cancer Res. 2019. PMID: 31462307 Free PMC article.
-
Targeted Pten deletion plus p53-R270H mutation in mouse mammary epithelium induces aggressive claudin-low and basal-like breast cancer.Breast Cancer Res. 2016 Jan 19;18(1):9. doi: 10.1186/s13058-015-0668-y. Breast Cancer Res. 2016. PMID: 26781438 Free PMC article.
-
BTG2: a rising star of tumor suppressors (review).Int J Oncol. 2015 Feb;46(2):459-64. doi: 10.3892/ijo.2014.2765. Epub 2014 Nov 18. Int J Oncol. 2015. PMID: 25405282 Review.
-
p53 in breast cancer subtypes and new insights into response to chemotherapy.Breast. 2013 Aug;22 Suppl 2:S27-9. doi: 10.1016/j.breast.2013.07.005. Breast. 2013. PMID: 24074787 Review.
Cited by
-
Predictors of success in establishing orthotopic patient-derived xenograft models of triple negative breast cancer.NPJ Breast Cancer. 2023 Jan 10;9(1):2. doi: 10.1038/s41523-022-00502-1. NPJ Breast Cancer. 2023. PMID: 36627285 Free PMC article.
-
Checkpoint Kinase 1 (CHK1) Functions as Both a Diagnostic Marker and a Regulator of Epithelial-to-Mesenchymal Transition (EMT) in Triple-Negative Breast Cancer.Curr Issues Mol Biol. 2022 Nov 23;44(12):5848-5865. doi: 10.3390/cimb44120398. Curr Issues Mol Biol. 2022. PMID: 36547059 Free PMC article.
-
MiR-25-3p promotes the proliferation of triple negative breast cancer by targeting BTG2.Mol Cancer. 2018 Jan 8;17(1):4. doi: 10.1186/s12943-017-0754-0. Mol Cancer. 2018. PMID: 29310680 Free PMC article.
-
The functional and clinical roles of liquid biopsy in patient-derived models.J Hematol Oncol. 2023 Apr 8;16(1):36. doi: 10.1186/s13045-023-01433-5. J Hematol Oncol. 2023. PMID: 37031172 Free PMC article. Review.
-
Current status and perspectives of patient-derived xenograft models in cancer research.J Hematol Oncol. 2017 May 12;10(1):106. doi: 10.1186/s13045-017-0470-7. J Hematol Oncol. 2017. PMID: 28499452 Free PMC article. Review.
References
-
- Powell E, Piwnica-Worms D, Piwnica-Worms H. Contribution of p53 to metastasis. Cancer Discov. 2014;4:405–14. doi: 10.1158/2159-8290.CD-13-0136. - DOI - PMC - PubMed
MeSH terms
Substances
Grants and funding
LinkOut - more resources
Full Text Sources
Other Literature Sources
Research Materials
Miscellaneous

