. 2016 Jan 27:7:10321.
doi: 10.1038/ncomms10321.

Bone marrow-derived monocytes give rise to self-renewing and fully differentiated Kupffer cells

Affiliations

Bone marrow-derived monocytes give rise to self-renewing and fully differentiated Kupffer cells

Charlotte L Scott et al. Nat Commun. .

Abstract

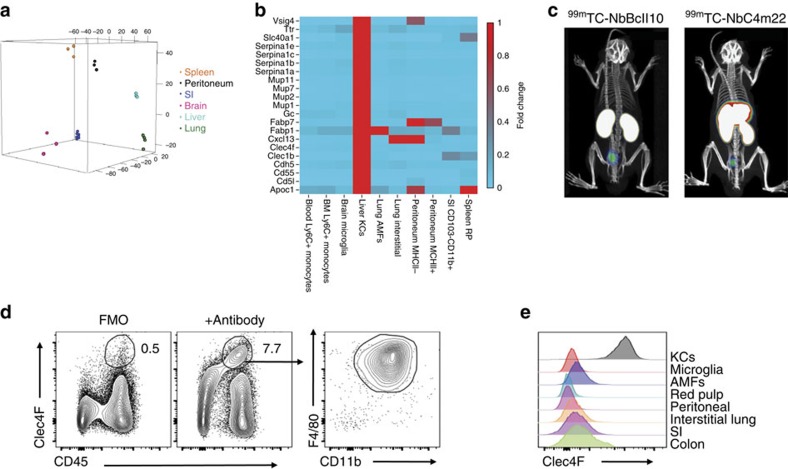
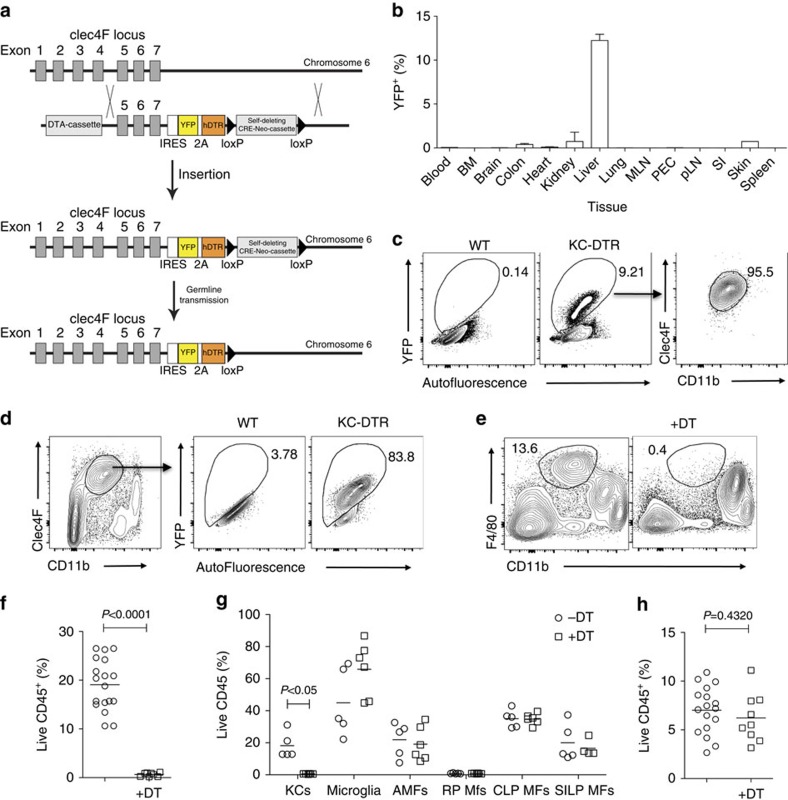
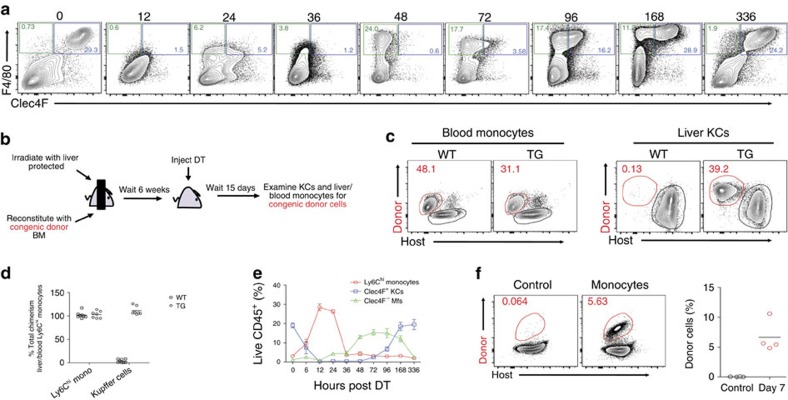
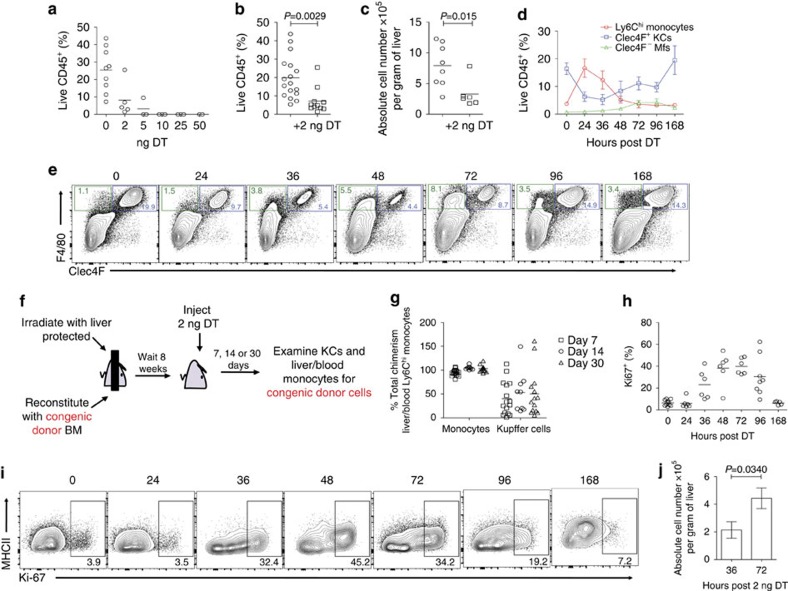
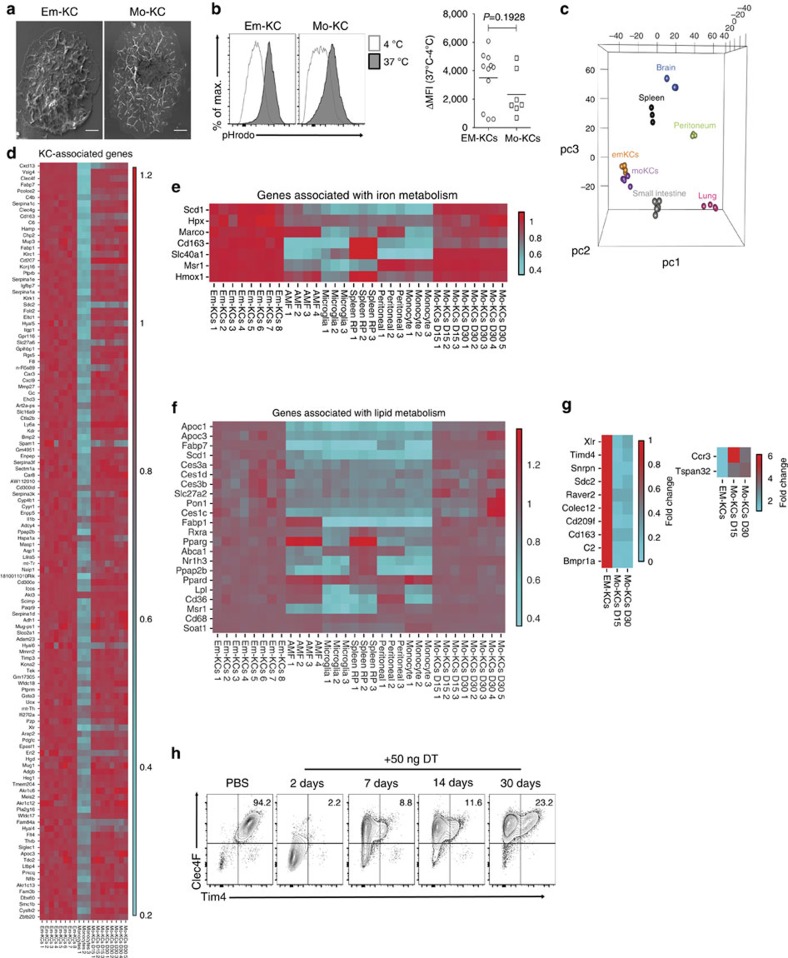
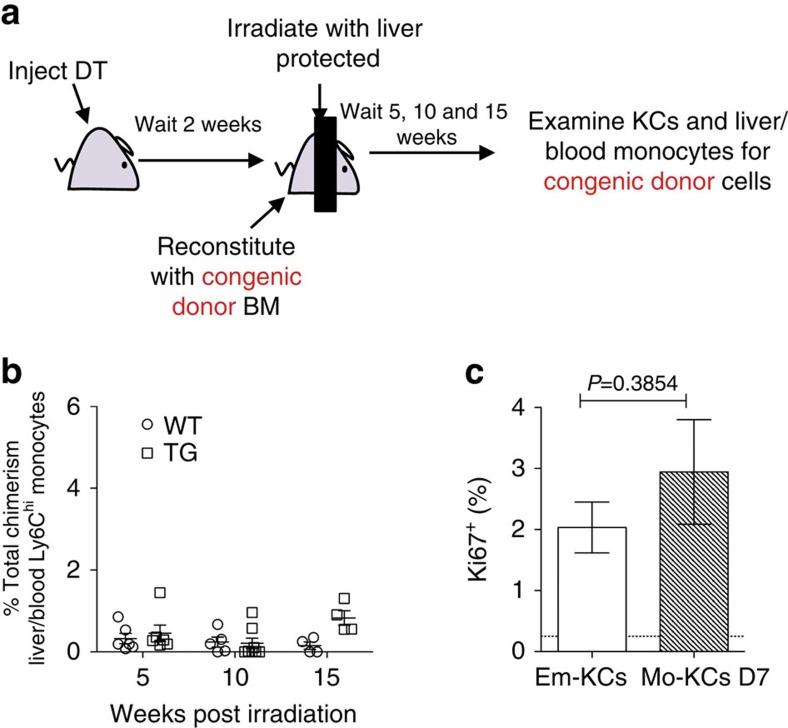
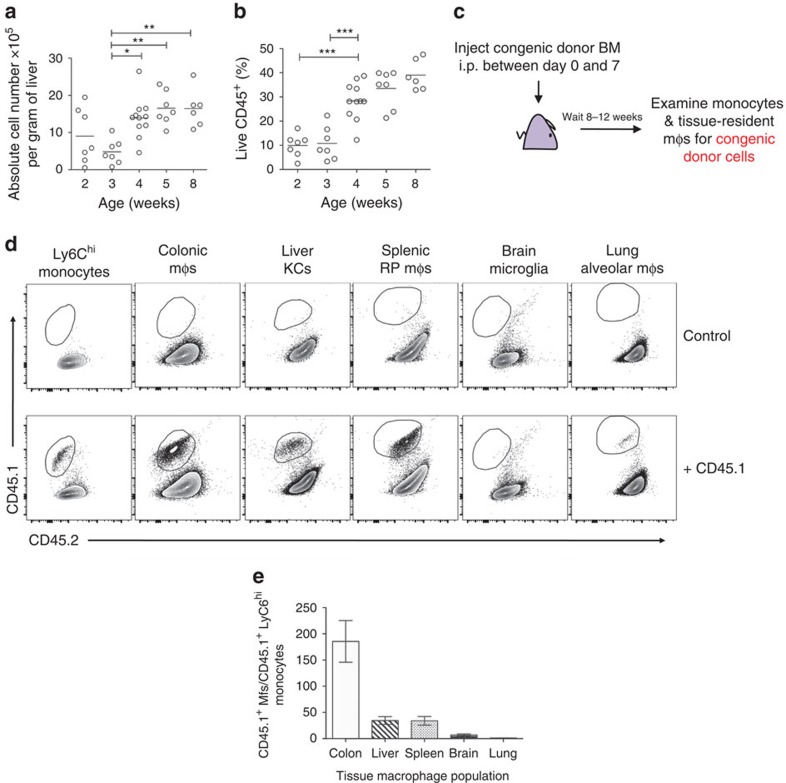
Self-renewing tissue-resident macrophages are thought to be exclusively derived from embryonic progenitors. However, whether circulating monocytes can also give rise to such macrophages has not been formally investigated. Here we use a new model of diphtheria toxin-mediated depletion of liver-resident Kupffer cells to generate niche availability and show that circulating monocytes engraft in the liver, gradually adopt the transcriptional profile of their depleted counterparts and become long-lived self-renewing cells. Underlining the physiological relevance of our findings, circulating monocytes also contribute to the expanding pool of macrophages in the liver shortly after birth, when macrophage niches become available during normal organ growth. Thus, like embryonic precursors, monocytes can and do give rise to self-renewing tissue-resident macrophages if the niche is available to them.


Figures

Figure 1
Figure 1. Identification of a KC-specific gene.
(a) Principle component analysis of transcriptional profiles of KCs compared with other tissue-resident mφs. (b) Heatmap of mean fold change in core KC genes. Expression level in KCs was set at one. (c) SPECT/μCT images 1 h post injection with control (NbBcII10) or anti-Clec4f (NbC4m22) 99mTechnetium-labelled nanobodies. Representative of two experiments with n=6. (d) Clec4F, CD45, F4/80 and CD11b expression in liver cells. Representative of 5 experiments. (e) Clec4F expression by mφ populations. AMFs, alveolar mφs; red pulp, splenic red pulp mφs; SI, small intestinal Mφs; Representative of two experiments.
Figure 2
Figure 2. Generation and validation of KC-specific KC-DTR mice.
(a) Schematic showing generation of KC-DTR mice. (b) Percentage of YFP-expressing cells amongst live cells in different tissues of KC-DTR mice. One experiment. n=3 per group. Error bars represent s.e.m. (c) Liver homogenates from KC-DTR mice or WT littermate controls were examined for YFP expression and YFP+ cells were examined for Clec4F and CD11b expression. Representative of three experiments. (d) YFP expression by Clec4F+CD11bint KCs from KC-DTR mice or WT littermate controls. Representative of three experiments. (e) F4/80 and CD11b expression amongst live CD45+ cells 24 h post administration of DT to KC-DTR mice or WT littermate controls. Representative of five experiments. (f) Proportion of KCs amongst live CD45+ cells 24 h post administration of DT. Data are pooled from three experiments. n=18 (controls) or 8 (+DT). P<0.0001 two-way Student's t-test. (g) Tissue-resident mφs (AMFs, Alveolar mφs; CLP MFs, Colonic Lamina Propria mφs; RP MFs, splenic red pulp mφs; SILP MFs, Small intestinal Lamina Propria mφs) as percentage of Live CD45+ cells 18 h post DT administration to KC-DTR mice or WT littermate controls. Data are pooled from two experiments. n=5 for all groups except SILP Mφs +DT where n=4. P<0.05 two-way analysis of variance (ANOVA) with Bonferroni post-test. (h) Neutrophils and eosinophils as percentage of live CD45+ cells 24 h post administration of DT (+DT) compared with controls. Data are pooled from three experiments. n=17 (control) or 9 (+DT). P=0.4320 two-way Student's t-test.
Figure 3
Figure 3. Depleted em-KCs are rapidly replaced by mo-KCs.
(a) Expression of Clec4F and F4/80 at indicated time-points (h) post administration of DT. FACS-plots are pre-gated on Live CD45+SiglecFLy6GLy6C single cells. Data are representative of three experiments. (b) Schematic for generation of shielded chimeras to test origin of repopulating Clec4F+ mφs. (c,d) KC-DTR (TG) or WT littermate control (WT) shielded chimeras were administered DT and blood Ly6Chi monocytes (live CD45+CD11b+Ly6GLy6Chi) and liver Clec4F+ mφs (live CD45+Ly6CLy6GSiglecFF4/80+Clec4F+) were examined for the proportion of congenic donor BM-derived cells. Percentage of total chimerism amongst liver Ly6Chi monocytes and Clec4F+ KCs is shown. Chimerism amongst blood Ly6Chi monocytes was set at 100%. Data are pooled from three experiments. n=8 (WT) or 7 (Tg). (e) Proportion of Ly6Chi monocytes, Clec4F+ KCs and Clec4F mφs in the liver as a percentage of live CD45+ cells at various time-points post DT administration. Data are pooled from three experiments. n=18 (0h), 6 (6, 36h), 10 (12, 96h), 8 (24, 48, 72h), 12 (168h) or 7 (336h). Error bars represent s.e.m. (f) 8 × 10⁵–10 × 105 BM Ly6Chi monocytes (live CD45+CD11b+Ly6GLy6ChiCD115+) from WT congenic mice were transferred into DT-administered KC-DTRxCCR2−/− recipients and 7 days later, live CD45+Clec4F+F4/80+CD11bint KCs in the liver were examined for the presence of congenic donor cells. Data are pooled from two experiments. n=4 per group.
Figure 4
Figure 4. Mo-KCs compete with em-KCs for KC niche repopulation after partial depletion.
(a) Percentage of KCs among live CD45+ cells 24 h following administration of various doses of DT. Data are from one experiment. n=9 (0 ng), 5 (2 ng), 3 (5, 10, 25 ng) or 2 (50 ng). (b) Percentage of KCs among live CD45+ cells in KC-DTR or WT littermate controls 24 h post administration of 2 ng DT. Data are pooled from 3 experiments. n=17 (control) or 11 (+2 ng DT). P=0.0029 two-way Student's t-test. (c) Absolute number of KCs per gram of liver tissue in KC-DTR or WT littermates 24 h post administration of 2 ng DT. Data are pooled from two experiments. n=8 (controls) or 6 (+2 ng DT). P=0.015 two-way Student's t-test. (d) Proportion of Ly6Chi monocytes, Clec4F+ KCs and Clec4F mφs in the liver as a percentage of live CD45+ cells at various time-points post administration of 2 ng DT. Data are pooled from two experiments. n=11 (0 h), 6 (24, 36, 48, 72 h), 8 (96 h) or 5 (168 h). Error bars represent s.e.m. (e) Clec4F and F4/80 expression on total Live CD45+Ly6CLy6GSiglecF cells from KC-DTR or WT littermate that received 2 ng DT at indicated time-points (h). (f) Schematic of shielded chimeras to determine origin of Clec4F+ KCs following partial KC depletion. (g) Percentage of total chimerism amongst Ly6Chi monocytes and KCs in mice treated with 2 ng DT 7, 14 and 30 days earlier. Chimerism amongst blood Ly6Chi monocytes was set at 100%. Data are pooled from three experiments. n=16 (d7), 9 (d14) or 14 (d30). (h) Percentage of Ki-67+ Clec4F+ KCs at indicated time-points post administration of 2 ng DT. Data are pooled from two experiments. n=11 (0 h), 6 (24, 36, 72 h), 8 (96 h) and 5 (168 h). (i) Ki-67 and MHCII expression on Clec4F+ KCs at indicated time-points (h) post administration of 2 ng DT. (j) Absolute number of KCs per gram of liver 36 and 72 h post partial depletion with 2 ng DT. Data are pooled from two experiments. n=6 per group. P=0.0370 two-way Student's t-test. Error bars represent s.e.m.
Figure 5
Figure 5. Mo-KCs are highly homologous to em-KCs.
(a) SEM imaging of em-KCs and mo-KCs 30 days post DT administration. Scale bar, 4 μm. Images are representative of n=3 per group. (b) Uptake of E. coli bioparticles conjugated to the pH-sensitive fluorescent pHrodo dye by em-KCs and day 7 mo-KCs shown as Δ mean fluorescence intensity at 37–4 °C (control). Data are pooled from two experiments. n=7 (mo-KCs) or 11 (em-KCs). P=0.1928 Two-way Student's t-test. (c) Principle component analysis of em-KCs, mo-KCs (pooled day 15 and day 30 post DT) sorted as shown in Supplementary Fig. 5b and other tissue-resident mφ populations sorted by the Immgen Consortium. (dg) Heatmap of fold change in expression of (d) top 100 genes enriched in Em-KCs when compared with all other tissue-resident mφ populations and blood Ly6Chi MHCII monocytes, which were sorted and arrayed by the Immgen Consortium (e) core iron metabolism genes enriched in em-KCs (f) core lipid metabolism genes enriched in em-KCs and (g) all genes differentially expressed by at least 1.5-fold between em-KCs and mo-KCs at day 30. In all heatmaps, mean expression of each gene by em-KCs was set at one. (h) Clec4F and Tim4 expression by live CD45+CD11b+Ly6CF4/80+ liver cells measured at 2, 7, 14 and 30 days post DT administration. Data are representative of 1–3 experiments at the various time-points with n=2–4 per group.
Figure 6
Figure 6. Mo-KCs acquire the capacity to self-renew.
(a) Schematic of shielded chimeras to determine lifespan of mo-KCs. (b) Percentage of total chimerism amongst KCs in fully depleted (50 ng DT) KC-DTR (TG) and WT littermate controls. Chimerism amongst blood Ly6Chi monocytes was set at 100%. Data are pooled from two experiments. n=6 (WT and TG 5weeks), 5 (WT 10 weeks), 8 (TG 10 weeks) or 4 (WT and TG 15 weeks). (c) Percentage of Ki-67+ em-KCs or mo-KCs at day 7 post administration of DT. Data are pooled from two experiments. n=6(em-KCs) and 7(mo-KCs). Dotted line represents FMO. P=0.3854, two-way Student's t-test. Error bars represent s.e.m.
Figure 7
Figure 7. Mo-KCs are generated during normal liver growth in the first weeks of life.
(a) Absolute number of KCs per gram of liver at indicated time-points after birth. Data are pooled from two experiments. n=7 (2, 3 ,5 weeks), 11 (4 weeks) or 6 (8 weeks). *P<0.05, **P<0.01. One way analysis of variance (ANOVA) with Bonferroni post-test. (b) Percentage of KCs among live CD45+ cells at indicated time-points after birth. Data are pooled from two experiments. n=7 (2, 3, 5 weeks), 11 (4 weeks) or 6 (8 weeks). ***P<0.001. One way ANOVA with Bonferroni post-test. (c) Schematic of adoptive transfer of congenic total BM to newborn pups to assess monocyte contribution to KC pool during growth. Mice were given a single injection of 8 × 10⁶ BM cells within the first 7 days after birth. (d) Representative FACS plots showing engraftment of congenic donor BM into liver Ly6Chi monocytes, colonic macrophages, liver KCs, splenic red pulp macrophages, brain microglia and lung alveolar macrophages, gated as shown in Supplementary Fig. 2. (e) Ratio (%) of macrophages derived from CD45.1 congenic BM and Ly6Chi monocytes derived from CD45.1 congenic BM 8–12 weeks post adoptive transfer (i.p.) of CD45.1 congenic BM to CD45.2 WT mice in the colon, liver, spleen, brain and lung. Data are pooled from five experiments. n=23. Error bars represent s.e.m.

Similar articles

Cited by

References

    1. Davies L. C., Jenkins S. J., Allen J. E. & Taylor P. R. Tissue-resident macrophages. Nat. Immunol. 14, 986–995 (2013). - PMC - PubMed
    1. Gomez Perdiguero E. et al.. Tissue-resident macrophages originate from yolk-sac-derived erythro-myeloid progenitors. Nature 518, 547–551 (2015). - PMC - PubMed
    1. Schulz C. et al.. A lineage of myeloid cells independent of Myb and hematopoietic stem cells. Science 336, 86–90 (2012). - PubMed
    1. Bain C. C. et al.. Constant replenishment from circulating monocytes maintains the macrophage pool in the intestine of adult mice. Nat. Immunol. 15, 929–937 (2014). - PMC - PubMed
    1. Yona S. et al.. Fate mapping reveals origins and dynamics of monocytes and tissue macrophages under homeostasis. Immunity 38, 79–91 (2013). - PMC - PubMed

Publication types