

Induction of DNA double-strand breaks and cellular senescence by human respiratory syncytial virus
- PMID: 26809688
- PMCID: PMC4871660
- DOI: 10.1080/21505594.2016.1144001
Induction of DNA double-strand breaks and cellular senescence by human respiratory syncytial virus
Abstract
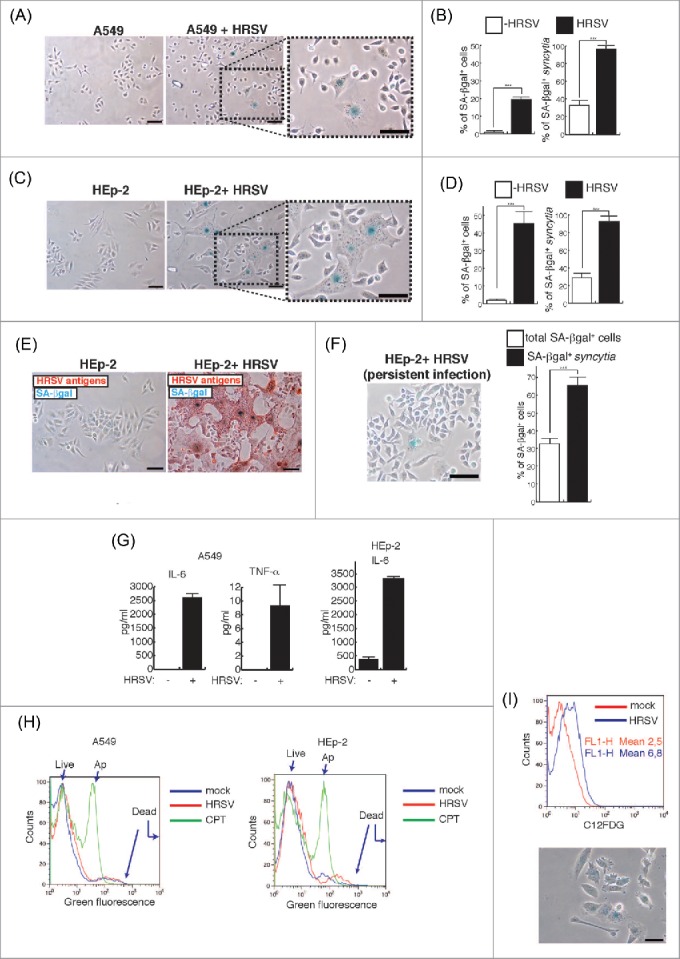
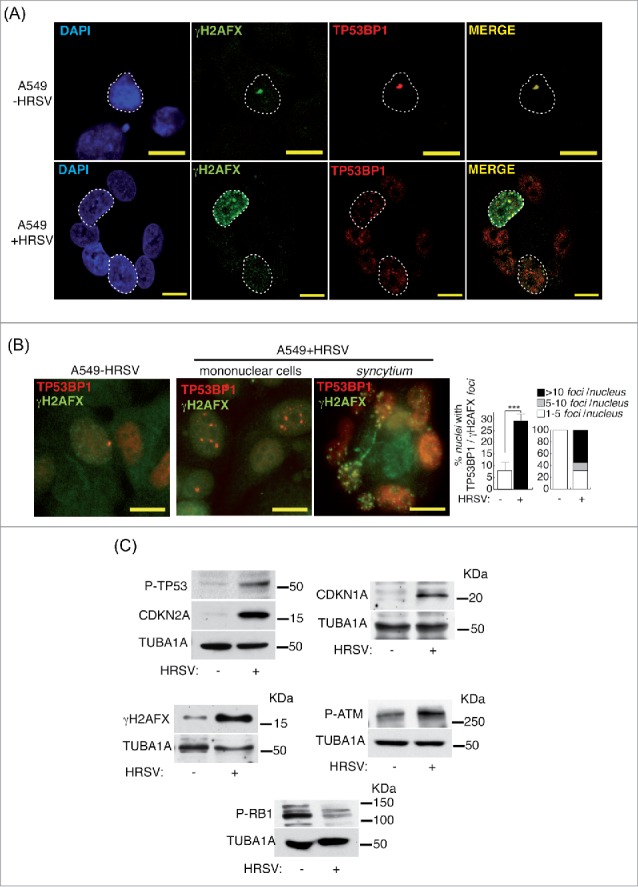
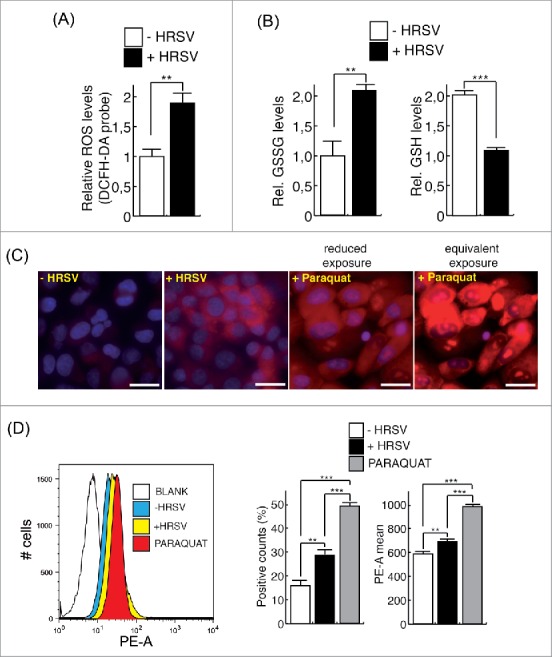
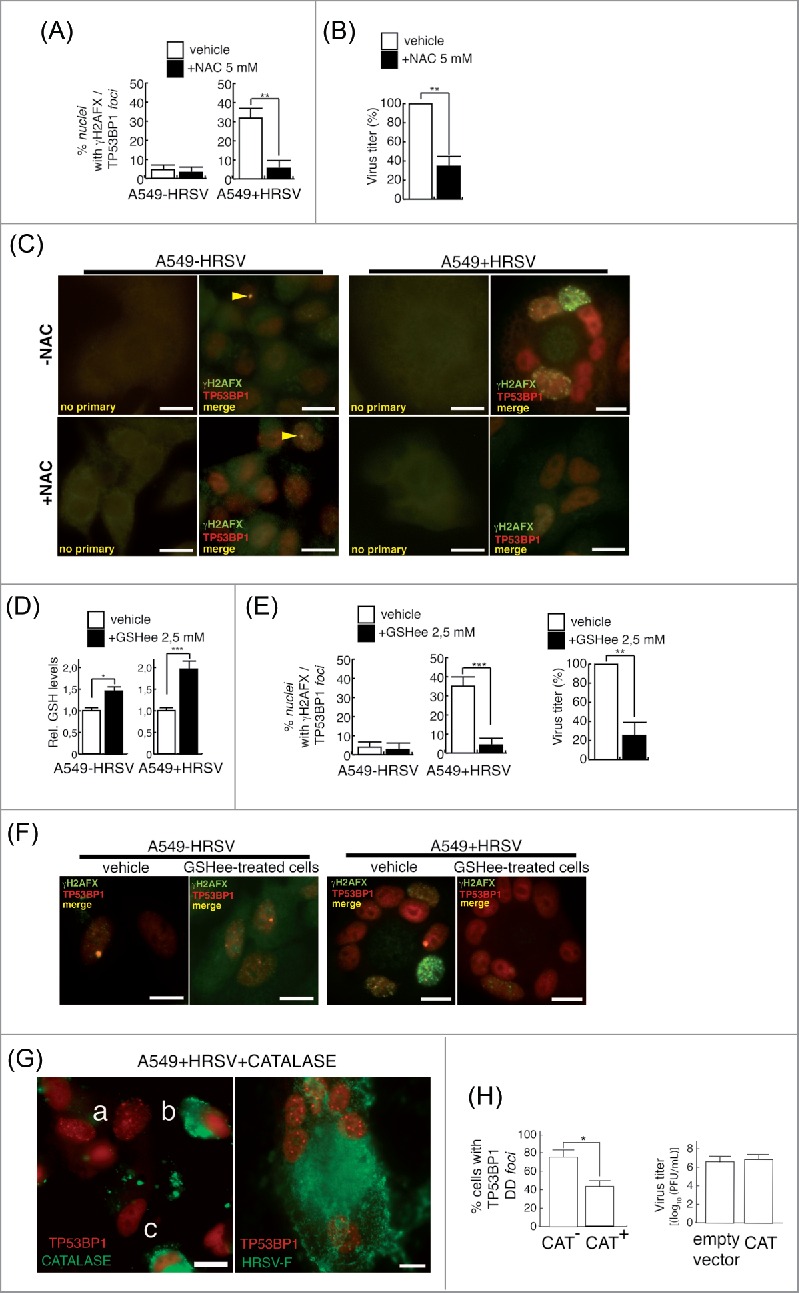
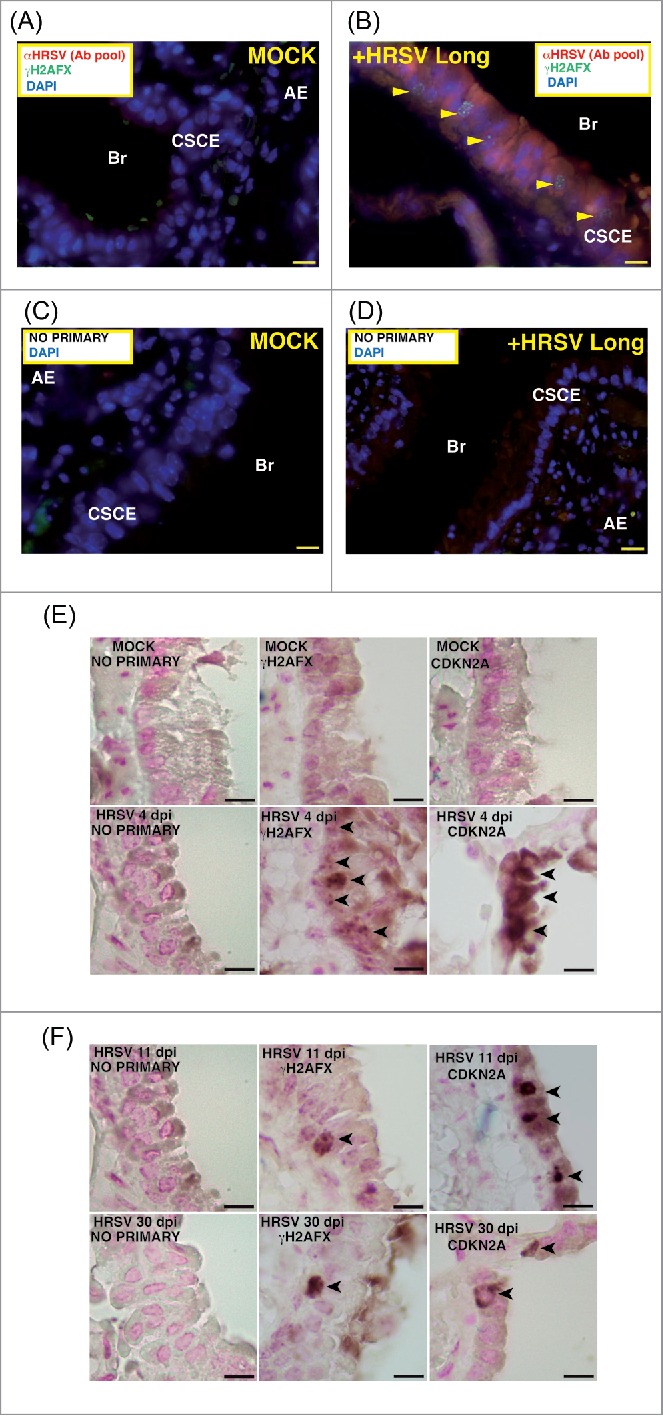
Human respiratory syncytial virus (HRSV) accounts for the majority of lower respiratory tract infections during infancy and childhood and is associated with significant morbidity and mortality. HRSV provokes a proliferation arrest and characteristic syncytia in cellular systems such as immortalized epithelial cells. We show here that HRSV induces the expression of DNA damage markers and proliferation arrest such as P-TP53, P-ATM, CDKN1A and γH2AFX in cultured cells secondary to the production of mitochondrial reactive oxygen species (ROS). The DNA damage foci contained γH2AFX and TP53BP1, indicative of double-strand breaks (DSBs) and could be reversed by antioxidant treatments such as N-Acetylcysteine (NAC) or reduced glutathione ethyl ester (GSHee). The damage observed is associated with the accumulation of senescent cells, displaying a canonical senescent phenotype in both mononuclear cells and syncytia. In addition, we show signs of DNA damage and aging such as γH2AFX and CDKN2A expression in the respiratory epithelia of infected mice long after viral clearance. Altogether, these results show that HRSV triggers a DNA damage-mediated cellular senescence program probably mediated by oxidative stress. The results also suggest that this program might contribute to the physiopathology of the infection, tissue remodeling and aging, and might be associated to long-term consequences of HRSV infections.
Keywords: DNA damage; ROS; cellular senescence; human respiratory; syncytial virus.
Figures
Comment in
-
Increasing the complexity of respiratory syncytial virus infection: Reactive oxygen species, DNA damage, and premature senescence.Virulence. 2016 May 18;7(4):372-5. doi: 10.1080/21505594.2016.1162370. Epub 2016 Mar 23. Virulence. 2016. PMID: 27008410 Free PMC article. No abstract available.
Similar articles
-
Respiratory Syncytial Virus-Induced Oxidative Stress Leads to an Increase in Labile Zinc Pools in Lung Epithelial Cells.mSphere. 2020 May 27;5(3):e00447-20. doi: 10.1128/mSphere.00447-20. mSphere. 2020. PMID: 32461278 Free PMC article.
-
Interferon-gamma induces cellular senescence through p53-dependent DNA damage signaling in human endothelial cells.Mech Ageing Dev. 2009 Mar;130(3):179-88. doi: 10.1016/j.mad.2008.11.004. Epub 2008 Nov 21. Mech Ageing Dev. 2009. PMID: 19071156
-
A new role for oxidative stress in aging: The accelerated aging phenotype in Sod1-/- mice is correlated to increased cellular senescence.Redox Biol. 2017 Apr;11:30-37. doi: 10.1016/j.redox.2016.10.014. Epub 2016 Nov 2. Redox Biol. 2017. PMID: 27846439 Free PMC article.
-
Contribution of Cytokines to Tissue Damage During Human Respiratory Syncytial Virus Infection.Front Immunol. 2019 Mar 18;10:452. doi: 10.3389/fimmu.2019.00452. eCollection 2019. Front Immunol. 2019. PMID: 30936869 Free PMC article. Review.
-
Inflammatory damage on respiratory and nervous systems due to hRSV infection.Curr Opin Immunol. 2015 Oct;36:14-21. doi: 10.1016/j.coi.2015.05.003. Epub 2015 May 27. Curr Opin Immunol. 2015. PMID: 26026788 Review.
Cited by
-
Enteroviral 2B Interacts with VDAC3 to Regulate Reactive Oxygen Species Generation That Is Essential to Viral Replication.Viruses. 2022 Aug 4;14(8):1717. doi: 10.3390/v14081717. Viruses. 2022. PMID: 36016340 Free PMC article.
-
The Interaction of Viruses with the Cellular Senescence Response.Biology (Basel). 2020 Dec 9;9(12):455. doi: 10.3390/biology9120455. Biology (Basel). 2020. PMID: 33317104 Free PMC article. Review.
-
Presence of rare potential pathogenic variants in subjects under 65 years old with very severe or fatal COVID-19.Sci Rep. 2022 Jun 20;12(1):10369. doi: 10.1038/s41598-022-14035-x. Sci Rep. 2022. PMID: 35725860 Free PMC article.
-
Redox Biology of Respiratory Viral Infections.Viruses. 2018 Jul 26;10(8):392. doi: 10.3390/v10080392. Viruses. 2018. PMID: 30049972 Free PMC article. Review.
-
Immune Senescence, Immunosenescence and Aging.Front Aging. 2022 May 30;3:900028. doi: 10.3389/fragi.2022.900028. eCollection 2022. Front Aging. 2022. PMID: 35821850 Free PMC article. Review.
References
-
- Allen RG, Tresini M. Oxidative stress and gene regulation. Free Radical Biol Med 2000; 28:463-99; http://dx.doi.org/10.1016/S0891-5849(99)00242-7 - DOI - PubMed
-
- Anderson L, Henderson C, Adachi Y. Phosphorylation and rapid relocalization of 53BP1 to nuclear foci upon DNA damage. Mol Cell Biol 2001; 21:1719-29; PMID:11238909; http://dx.doi.org/10.1128/MCB.21.5.1719-1729.2001 - DOI - PMC - PubMed
-
- Bian T, Gibbs JD, Orvell C, Imani F. Respiratory syncytial virus matrix protein induces lung epithelial cell cycle arrest through a p53 dependent pathway. PloS One 2012; 7:e38052; PMID:22662266; http://dx.doi.org/10.1371/journal.pone.0038052 - DOI - PMC - PubMed
-
- Bonner WM, Redon CE, Dickey JS, Nakamura AJ, Sedelnikova OA, Solier S, Pommier Y. GammaH2AX and cancer. Nat Rev Cancer 2008; 8:957-67; PMID:19005492; http://dx.doi.org/10.1038/nrc2523 - DOI - PMC - PubMed
-
- Borchers AT, Chang C, Gershwin ME, Gershwin LJ. Respiratory syncytial virus–a comprehensive review. Clin Rev Allergy Immunol 2013; 45:331-79; PMID:23575961; http://dx.doi.org/10.1007/s12016-013-8368-9 - DOI - PMC - PubMed
MeSH terms
Substances
LinkOut - more resources
Full Text Sources
Other Literature Sources
Research Materials
Miscellaneous