

Protonation of a glutamate residue modulates the dynamics of the drug transporter EmrE
- PMID: 26751516
- PMCID: PMC4755857
- DOI: 10.1038/nchembio.1999
Protonation of a glutamate residue modulates the dynamics of the drug transporter EmrE
Abstract
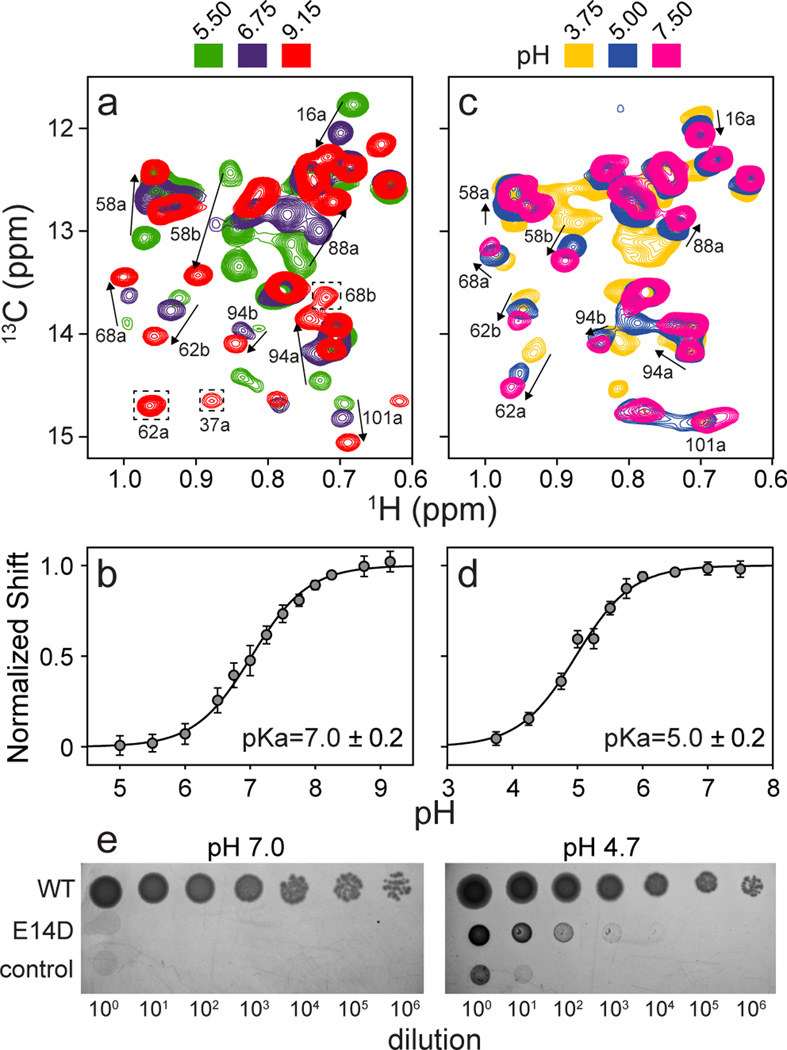
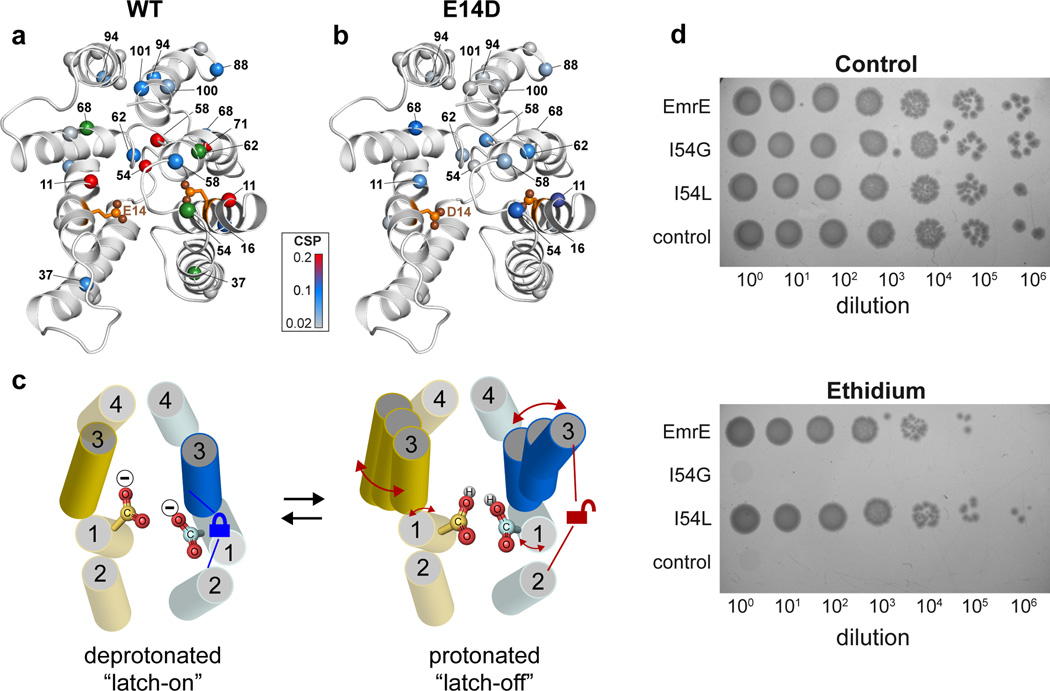
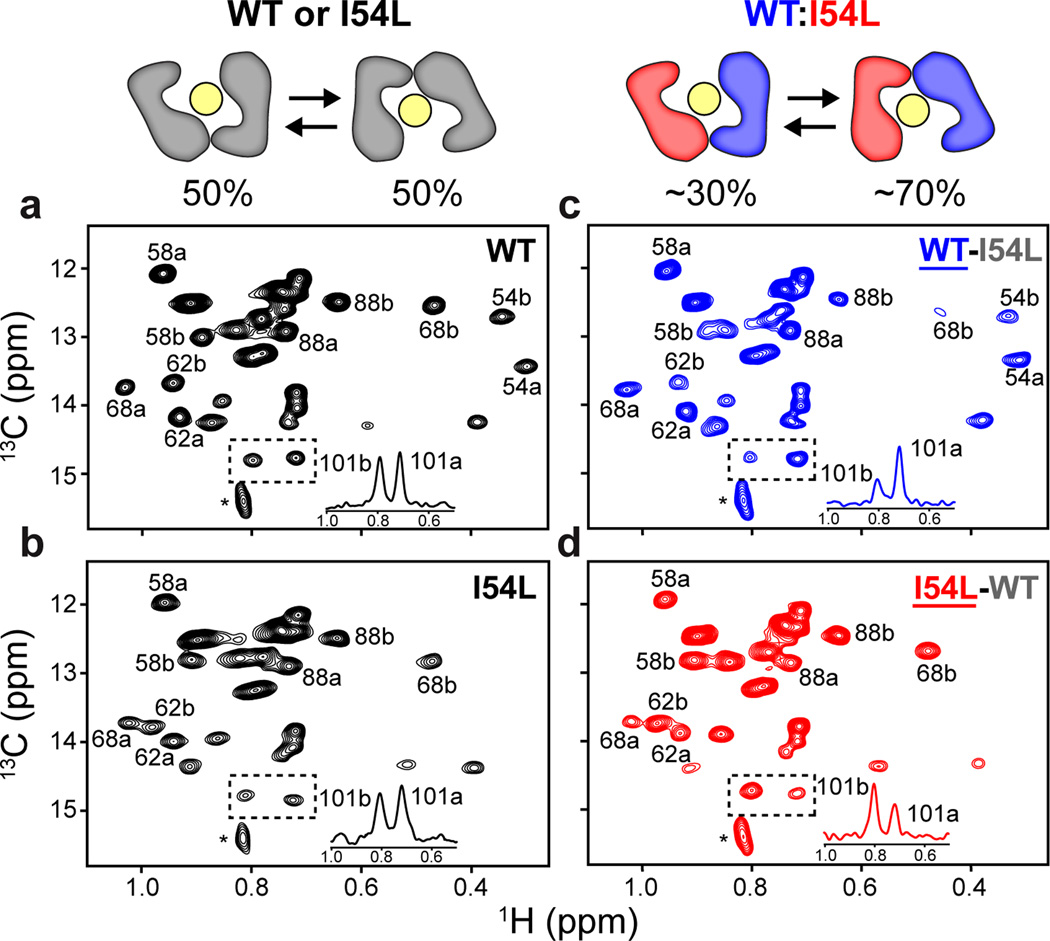
Secondary active transport proteins play a central role in conferring bacterial multidrug resistance. In this work, we investigated the proton-coupled transport mechanism for the Escherichia coli drug efflux pump EmrE using NMR spectroscopy. Our results show that the global conformational motions necessary for transport are modulated in an allosteric fashion by the protonation state of a membrane-embedded glutamate residue. These observations directly correlate with the resistance phenotype for wild-type EmrE and the E14D mutant as a function of pH. Furthermore, our results support a model in which the pH gradient across the inner membrane of E. coli may be used on a mechanistic level to shift the equilibrium of the transporter in favor of an inward-open resting conformation poised for drug binding.
Figures

Similar articles
-
Threonine-978 in the transmembrane segment of the multidrug efflux pump AcrB of Escherichia coli is crucial for drug transport as a probable component of the proton relay network.J Bacteriol. 2006 Oct;188(20):7284-9. doi: 10.1128/JB.00683-06. J Bacteriol. 2006. PMID: 17015667 Free PMC article.
-
Depressing time: Waiting, melancholia, and the psychoanalytic practice of care.In: Kirtsoglou E, Simpson B, editors. The Time of Anthropology: Studies of Contemporary Chronopolitics. Abingdon: Routledge; 2020. Chapter 5. In: Kirtsoglou E, Simpson B, editors. The Time of Anthropology: Studies of Contemporary Chronopolitics. Abingdon: Routledge; 2020. Chapter 5. PMID: 36137063 Free Books & Documents. Review.
-
Origin of the Difference in Proton Transport Direction between Inward and Outward Proton-Pumping Rhodopsins.Acc Chem Res. 2024 Nov 19;57(22):3292-3302. doi: 10.1021/acs.accounts.4c00488. Epub 2024 Nov 7. Acc Chem Res. 2024. PMID: 39509145 Review.
-
Qualitative evidence synthesis informing our understanding of people's perceptions and experiences of targeted digital communication.Cochrane Database Syst Rev. 2019 Oct 23;10(10):ED000141. doi: 10.1002/14651858.ED000141. Cochrane Database Syst Rev. 2019. PMID: 31643081 Free PMC article.
-
Conservative, physical and surgical interventions for managing faecal incontinence and constipation in adults with central neurological diseases.Cochrane Database Syst Rev. 2024 Oct 29;10(10):CD002115. doi: 10.1002/14651858.CD002115.pub6. Cochrane Database Syst Rev. 2024. PMID: 39470206
Cited by
-
Structure and dynamics of the drug-bound bacterial transporter EmrE in lipid bilayers.Nat Commun. 2021 Jan 8;12(1):172. doi: 10.1038/s41467-020-20468-7. Nat Commun. 2021. PMID: 33420032 Free PMC article.
-
Ion and lipid orchestration of secondary active transport.Nature. 2024 Feb;626(8001):963-974. doi: 10.1038/s41586-024-07062-3. Epub 2024 Feb 28. Nature. 2024. PMID: 38418916 Review.
-
Microsecond Motion of the Bacterial Transporter EmrE in Lipid Bilayers.J Am Chem Soc. 2023 May 10;145(18):10104-10115. doi: 10.1021/jacs.3c00340. Epub 2023 Apr 25. J Am Chem Soc. 2023. PMID: 37097985 Free PMC article.
-
Assembly and regulation of the chlorhexidine-specific efflux pump AceI.Proc Natl Acad Sci U S A. 2020 Jul 21;117(29):17011-17018. doi: 10.1073/pnas.2003271117. Epub 2020 Jul 7. Proc Natl Acad Sci U S A. 2020. PMID: 32636271 Free PMC article.
-
Highly coupled transport can be achieved in free-exchange transport models.J Gen Physiol. 2020 Jan 6;152(1):e201912437. doi: 10.1085/jgp.201912437. J Gen Physiol. 2020. PMID: 31816638 Free PMC article.
References
-
- Higgins CF. Nature. 2007;446:749–757. - PubMed
-
- Bay DC, Rommens KL, Turner RJ. Biochimica et biophysica acta. 2007 - PubMed
-
- Rapp M, Seppala S, Granseth E, von Heijne G. Science. 2007;315:1282–1284. - PubMed
-
- Schuldiner S. What Can a Living Fossil Tell Us About Evolution and Mechanism of Ion-Coupled Transporters: The Story of Small Multidrug Transporters. In: Kramer RZC, editor. Membrane Transport Mechanism, Vol. Springer Series in Biophysics 17. Berlin Heidelberg: Springer; 2014. pp. 233–248.
-
- Fleishman SJ, et al. Journal of Molecular Biology. 2006;364:54–67. - PubMed
Publication types
MeSH terms
Substances
Grants and funding
LinkOut - more resources
Full Text Sources
Other Literature Sources
Molecular Biology Databases
