

Targeted redox inhibition of protein phosphatase 1 by Nox4 regulates eIF2α-mediated stress signaling
- PMID: 26742780
- PMCID: PMC4741303
- DOI: 10.15252/embj.201592394
Targeted redox inhibition of protein phosphatase 1 by Nox4 regulates eIF2α-mediated stress signaling
Abstract
Phosphorylation of translation initiation factor 2α (eIF2α) attenuates global protein synthesis but enhances translation of activating transcription factor 4 (ATF4) and is a crucial evolutionarily conserved adaptive pathway during cellular stresses. The serine-threonine protein phosphatase 1 (PP1) deactivates this pathway whereas prolonging eIF2α phosphorylation enhances cell survival. Here, we show that the reactive oxygen species-generating NADPH oxidase-4 (Nox4) is induced downstream of ATF4, binds to a PP1-targeting subunit GADD34 at the endoplasmic reticulum, and inhibits PP1 activity to increase eIF2α phosphorylation and ATF4 levels. Other PP1 targets distant from the endoplasmic reticulum are unaffected, indicating a spatially confined inhibition of the phosphatase. PP1 inhibition involves metal center oxidation rather than the thiol oxidation that underlies redox inhibition of protein tyrosine phosphatases. We show that this Nox4-regulated pathway robustly enhances cell survival and has a physiologic role in heart ischemia-reperfusion and acute kidney injury. This work uncovers a novel redox signaling pathway, involving Nox4-GADD34 interaction and a targeted oxidative inactivation of the PP1 metal center, that sustains eIF2α phosphorylation to protect tissues under stress.
Keywords: Nox4; eIF2α; metal center; protein phosphatase; redox signaling.
© 2016 The Authors. Published under the terms of the CC BY 4.0 license.
Figures
- A
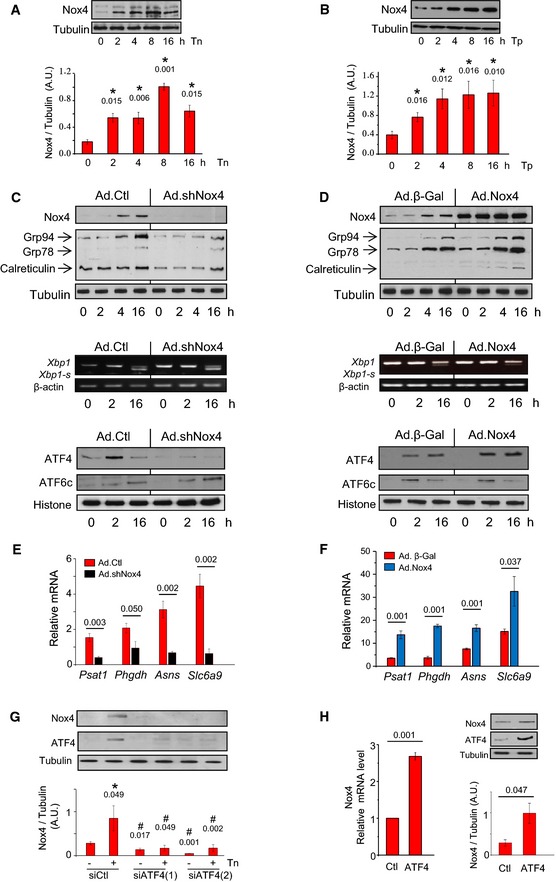
Tunicamycin (Tn, 2 μg/ml) increased Nox4 protein levels in H9c2 cells. Tubulin was used as a loading control. n = 4–6/group. *, significant compared to baseline.
- B
Thapsigargin (Tp, 1 μg/ml) increased Nox4 protein levels in H9c2 cells. n = 4–6/group. *, significant compared to baseline.
- C
Effect of Nox4 on the unfolded protein response. Nox4 was depleted in H9c2 cells by sh
RNA ‐mediated knockdown (Ad.shNox4), or cells were treated with a control adenovirus (Ad.Ctl). In cells with Nox4 knockdown, tunicamycin treatment resulted in lower increases in protein levels of theER chaperones Grp94, Grp78, and calreticulin than in control cells. Nuclear protein levels ofATF 4 were substantially lower in Nox4‐depleted cells than in control cells, but the levels of cleavedATF 6 (ATF 6c) were similar. Histone was used as a loading control. The relativemRNA levels of Xbp1‐s (a readout ofIRE 1 signaling) were unaltered after Nox4 knockdown. Mean data are shown in Appendix Fig S1E. Similar results were obtained with an independent siRNA approach (Appendix Fig S2A). - D
Effect of adenoviral‐mediated overexpression of Nox4 (Ad.Nox4) or a control β‐galactosidase protein (Ad.β‐Gal) on tunicamycin responses of H9c2 cells. Nox4 enhanced the increase in cellular
ER chaperones and nuclearATF 4 levels but did not affect tunicamycin‐induced changes in nuclearATF 6c levels and caused minor reduction in Xbp1smRNA levels. Mean data are shown in Appendix Fig S2B. - E, F
Effect of Nox4 knockdown or overexpression, respectively, on the tunicamycin‐induced changes in
mRNA levels ofATF 4 target genes. n = 4/group. Psat1, phosphoserine aminotransferase; Phgdh, 3‐phosphoglycerate dehydrogenase; Asns, asparagine synthetase; Slc6a9, glycine transporter 1. - G
Effect of
ATF 4 silencing with two different siRNA s on Nox4 protein levels in tunicamycin‐treated H9c2 cells. Scrambled siRNA s were used as a control (Ctl). Representative immunoblots shown to the top (captions at bottom of bar graphs refer also to the immunoblots); tubulin was used as a loading control. n = 4/group. *, significant compared to baseline; #, significant comparing siATF 4 versus corresponding siCtl. - H
Effect of
ATF 4 overexpression on Nox4mRNA and protein levels. n = 3/group.
- A
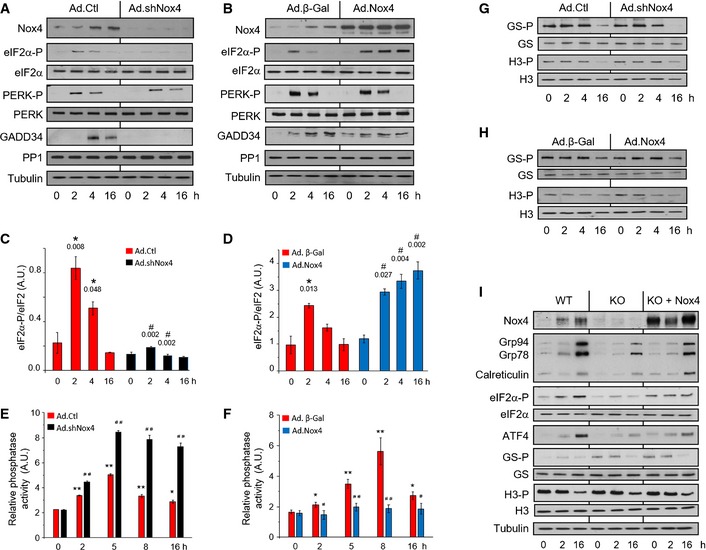
The knockdown of endogenous Nox4 resulted in a substantial inhibition of tunicamycin‐induced
eIF 2α phosphorylation in H9c2 cells, with no change in phospho‐Thr980‐PERK (PERK ‐P) levels.GADD 34 levels were significantly decreased after Nox4 knockdown, while there was no change inPP 1 protein levels. - B
Overexpression of Nox4 in H9c2 cells caused prolongation of tunicamycin‐induced
eIF 2α phosphorylation, with minimal change in phospho‐PERK levels. - C, D
Mean levels of phosphorylated
eIF 2α relative to totaleIF 2α protein in tunicamycin‐treated cells after Nox4 knockdown or overexpression, respectively. n = 3/group. *, significant compared to baseline; #, significant comparing Nox4 knockdown (Ad.shNox4) or overexpression (Ad.Nox4) versus corresponding controls (Ad.Ctl or Ad.β‐Gal, respectively). - E, F
Effect of Nox4 knockdown or overexpression, respectively, on okadaic acid‐resistant Ser/Thr phosphatase activity in membrane fractions of tunicamycin‐treated H9c2 cells. n = 4/group. *P < 0.05, **P < 0.01 cf. baseline; # P < 0.05, ## P < 0.01 comparing Nox4 knockdown (Ad.shNox4) or overexpression (Ad.Nox4) versus corresponding controls (Ad.Ctl or Ad.β‐Gal, respectively).
- G, H
Nox4 knockdown or overexpression, respectively, had no effect on the phosphorylation of glycogen synthase at Ser641 (
GS ‐P) or histone H3 at Ser57 (H3‐P) in H9c2 cells. - I
Nox4−/−
MEF cells (KO ) showed blunted tunicamycin‐induced increases in levels of phospho‐eIF 2α,ATF 4, andER chaperones as compared to wild‐type (WT )MEF s, a response that was rescued by reintroduction of Nox4 (KO + Nox4). The latter had no effect onGS ‐P or H3‐P levels.
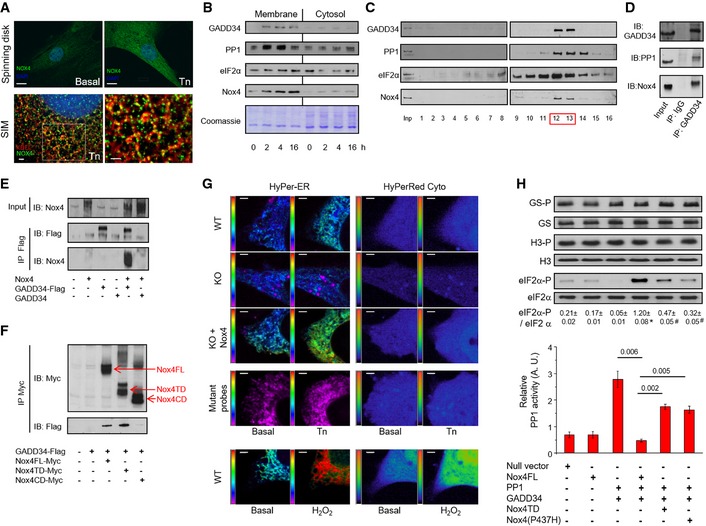
Subcellular localization of Nox4. Tunicamycin (Tn 2 μg/ml, 6 h) increased Nox4 levels in H9c2 cells as assessed by spinning disk confocal microscopy (scale bar, 10 μm). 3D
SIM images (scale bars, 2 μm) showed localization of Nox4 (green) to theER , which was labeled with an anti‐KDEL antibody (red). At higher magnification (right), yellow dots denote co‐localization of Nox4 andKDEL signals. Cell nuclei were stained withDAPI (blue). 1 Z slice from 3D stack is shown.Progressive enrichment of
GADD 34,PP 1,eIF 2α, and Nox4 in membrane fractions of tunicamycin‐treated H9c2 cells.After sucrose gradient fractionation of lysates of tunicamycin‐treated H9c2 cells,
GADD 34,PP 1, eIF2α and Nox4 co‐eluted in fractions 12 and 13 (F12, F13).Immunoprecipitation (
IP ) of pooled fractions 12/13 with an anti‐GADD 34 antibody revealed the presence of bothPP 1 and Nox4.The association of Nox4 with
GADD 34 was validated inHEK 293 cells co‐transfected with Nox4 and either Flag‐tagged or non‐taggedGADD 34, followed byIP with an anti‐Flag antibody.Co‐transfection of
HEK 293 cells withGADD 34‐Flag and different myc‐tagged Nox4 constructs, followed byIP with an anti‐myc antibody.GADD 34 binds to full‐length Nox4 (FL ) and the Nox4 transmembrane domain (TD ), but not the C‐terminal domain (CD ).Representative pseudocolor images of simultaneous
ER and cytosolicROS measurement with HyPer‐ER and HyPer‐Red Cyto, respectively, in tunicamycin‐treatedMEF cells. Redox‐insensitive mutant probes were used as negative controls and to excludepH changes. Extracellular H2O2 (200 nM) was added as a positive control. The pseudocolor scale is shown along the left vertical edge of each image.KO = Nox4−/−. Scale bars, 2 μm.Transfection of
HEK 293 cells withPP 1 andGADD 34 increasedPP 1 activity (bar graph) and decreased phospho‐eIF 2α levels (immunoblots). Co‐transfection of full‐length Nox4 reducedPP 1 activity and increased phospho‐eIF 2α levels (captions at bottom refer both to the bar graphs and immunoblots). These effects were abrogated when either Nox4 P437H or the Nox4 transmembrane domain (TD ) was transfected. Nox4 did not affect phosphorylation of glycogen synthase (GS ‐P) or histone H3 (H3‐P). Data are presented as mean ±SEM .
- A
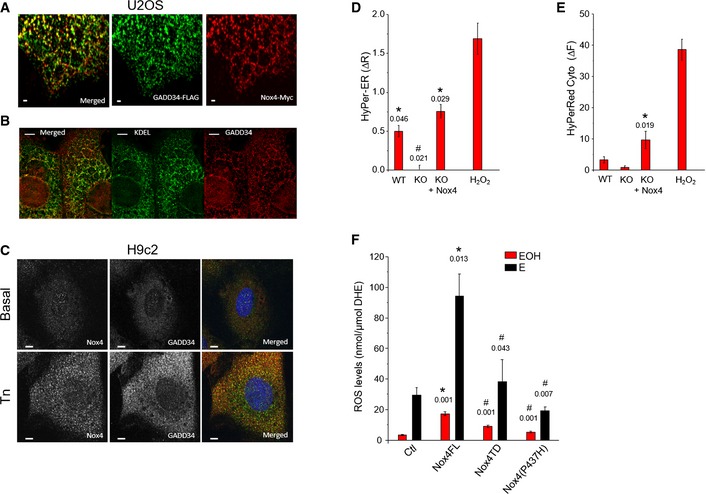
Confocal microscopic images of U2
OS cells co‐transfected with Myc‐tagged Nox4 and Flag‐taggedGADD 34 showed a co‐localization of Nox4 (red) andGADD 34 (green). Yellow dots in the top panel denote co‐localization of fluorescence signals. Scale bars, 1 μm. - B
Confocal microscopic images of U2
OS cells co‐transfected with Myc‐tagged Nox4 and Flag‐taggedGADD 34 as in (A), then stained forGADD 34 (red) andKDEL (green) as anER marker.GADD 34 co‐localized withKDEL . Scale bars, 5 μm. - C
Confocal microscopic images of H9c2 cells treated with tunicamycin (Tn, 2 μg/ml, 6 h), showing increased endogenous levels and co‐localization between Nox4 (green) and
GADD 34 (red). Scale bars, 10 μm. - D, E
Mean ±
SEM data for changes in HyPer‐ER and HyPer‐Red Cyto fluorescence from 3 independent cell preparations/group and at least 12 cells imaged/preparation. *, significant comparing Tn versus basal; #, significant comparingKO versus other groups. Extracellular H2O2 (200nM ) was added as a positive control, and the changes in HyPer‐ER and HyPer‐Red Cyto fluorescence were quantified. - F
ROS levels were increased inHEK 293 cells transfected with full‐length Nox4 (Nox4FL ), but not with Nox4 transmembrane domain (Nox4TD ) or a Nox4(P437H) mutant.ROS levels were measured byHPLC ‐based quantification of the dihydroethidium (DHE ) oxidation products, 2‐hydroxyethidium (EOH ) and ethidium (E). n = 4/group. *, significant comparing full‐length Nox4 versus control (Ctl); #, significant comparing full‐length Nox4 versus Nox4TD or Nox4 P437H.

- A
Purified recombinant
PP 1 was dose‐dependently inhibited by H2O2. - B
Overall representation of the
PP 1 catalytic domain. The catalytic Mn‐Mn or Mn‐Fe metal ions shown as magenta spheres are located in a shallow groove at the molecular surface.PP 1 side chains coordinating the metal ions and forming the base of the groove are highlighted in black. A phosphate ion, shown in stick representation with phosphate and oxygen atoms, colored cyan and red, respectively, is bound to the dinuclear center. - C
The X‐ray fluorescence emission spectrum of
PP 1 crystals reveals a mixture of Mn and Fe ions with the latter ion typically present in a lower amount. The ratio for the sample shown here is Mn:Fe 1:0.175. No other metals are present at significant concentration. The emission spectrum in the 4–8 keV energy region is shown by the gray thin line. Fitting for the individual Mn (purple dotted line, expected emission energies 5,899eV and 6,491eV ) and Fe (green dotted line, expected emission energies 6,404eV and 7,058eV ) metals as well as the total fit (black continuous line) are also shown. Fitting was carried out with the package PyMca (Solé et al, 2007). Excitation energy was 18 keV. - D
Cartoon representation of the
PP 1 active site with the dinuclear (M1, M2) metal center represented by purple spheres. The metal ions are pseudo‐octahedrally coordinated. Residues at coordinating distance (D64, H66, D92, N124, H173, H248) as well as the catalytically important H125 hydrogen‐bonded to the phosphate moiety are shown as sticks. P, N, C, O atoms are in cyan, blue, white, and red, respectively. The bridging μ‐OH − and the terminal water (W) are represented by small spheres. In crystallo metal analysis shows the presence of both Mn and Fe metals with the former being the most abundant. Anomalous difference maps (shown in purple at the +8σ level) calculated from data collected at the 6,876.6 eV energy where the Fe anomalous contribution is negligible indicate that Mn is present at both M1 and M2 centers. An attempt to specifically locate Fe ions using a double difference anomalous map approach (Than et al, 2005) was unsuccessful likely owing to the low Fe content. - E
Correlation between change in metal–ligand (M–L) coordination distances determined by X‐ray experimental and theoretical methods. There is a good correlation between theory and experiment with 75% of the Δ values (black circles) lying on the diagonal within error while three values (red circles) can be considered outliers. Most points lie on the lower‐left quadrant, implying a contraction of the average (M–L) distance upon metal oxidation. See Appendix Table S1 and related text for further details.
- F
PP 1 cysteine residues Cys127 (A) and Cys273 (B) were often seen oxidized to their sulfenic acid (CSO ) derivative. Occasionally, Cys291 is also oxidized. 2mFo‐DF c electron density maps are shown in blue at the 1.1σ level. S, C, O atoms are in yellow, white, and red, respectively. Cys oxidation appears independently of H2O2 treatment as we have observed sulfenic acid derivatization also in ascorbate‐treated crystals. Cysteine oxidation does not affectPP 1 catalysis as thePP 1 C127, 273S double variant displays the same activity asWT PP 1 (see Fig 4A). - G, H
Effect of H2O2 on the activity of
WT PP 1 andPP 1 variants bearing mutations in amino acids involved in metal coordination, N124D and D64N. ThepH optimum for eachPP 1 variant was determined by assessingPP 1 activity over a range ofpH values (buffers: 100 mM Tris–HC lpH 6–8 and 100 mM glycine–NaOH pH 9–10) (G). ThepK a forWT PP 1 and N124DPP 1 was 7.2, and for D64NPP 1, it was 9.8. ThePP 1 variants were incubated with 0.1 mM H2O2 for 20 min at 37°C, andPP 1 activity was assessed at optimumpH (H). The red bars showPP 1 activity under reduced conditions and the blue bars after H2O2 treatment. The relative inhibition by H2O2 was substantially increased in the mutant proteins. - I
Low‐temperature
EPR spectra of purifiedPP 1 at baseline and after treatment with H2O2 (1 mM). The central six‐line signal from 2.5 to 4.5 kG is consistent with Mn2+. After H2O2 treatment, there is a consistent signal in the region of 1.5 to 2 kG, which is typical for Fe(III ). - J
Effect of ascorbate (Asc, 0.5 mM) on
eIF 2α phosphorylation in tunicamycin (Tn)‐treated H9c2 cells with overexpression of Nox4 (Ad.Nox4). The Nox4‐induced increase ineIF 2α phosphorylation after 4 h of Tn was inhibited by ascorbate (see also Fig 4F).
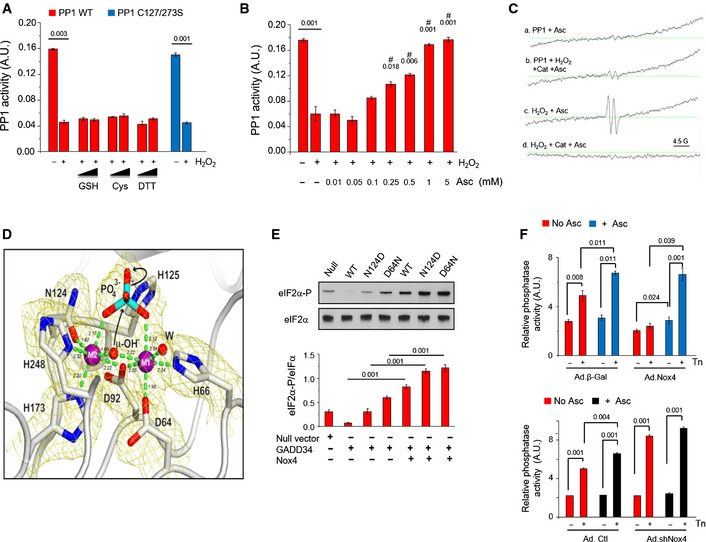
Recombinant
PP 1 was inhibited by H2O2 (0.2 mM) and activity was not restored by glutathione (GSH ), cysteine (Cys), or dithiothreitol (DTT ). A Cys127Ser/Cys273SerPP 1 mutant was inhibited by H2O2 similarly to wild‐typePP 1. Values above bars denote level of significance for the inhibitory effect of H2O2.Ascorbate (Asc) dose‐dependently restored
PP 1 activity. #, significant effect of Asc compared to H2O2 alone.EPR spectra ofPP 1 incubated with ascorbate (1 mM) alone (a) orPP 1 exposed to H2O2 followed by catalase treatment, then incubation with ascorbate (b). (b) shows a typical spectrum for the ascorbyl radical (hyperfine splitting constant,aH = 1.8 G), similar to the positive control obtained by exposing ascorbate to H2O2 (c). (d) shows that no ascorbyl radical is detected if H2O2 is degraded by catalase in the absence ofPP 1, prior to ascorbate addition.Cartoon representation of the active site of H2O2‐treated
PP 1 as in Fig EV2D. 2mF o‐DF c electron density map at the 2.2‐Å resolution is shown in yellow at the 1.1σ level. H2O2 treatment causes an overall shrinkage of thePP 1 coordination sphere by 0.12 Å compared to ascorbate‐treated crystals consistent with the oxidation of the dinuclear center. This increases the energy barrier for the catalytic steps involving μ‐OH − attack on the phosphorous center of the bridging phosphate and rupture of the P‐O scissile bond with the assistance of H125 (black arrows). Reported coordination distances in Å are averaged over the twoPP 1 molecules in the crystallographic asymmetric unit. See also Appendix Table S1.Effect of Nox4 on
GADD 34/PP 1‐mediatedeIF 2α dephosphorylation in transfectedHEK 293 cells. Nox4 increasedeIF 2α phosphorylation in cells transfected withGADD 34 andWT PP 1, and resulted in even higher phospho‐eIF 2α levels in cells transfected with N124D or D64NPP 1 variants.Effect of ascorbate (Asc, 0.5 mM) on phosphatase inhibition in tunicamycin‐treated H9c2 cells with overexpression or knockdown of Nox4 (Ad.Nox4 and Ad.shNox4, respectively). In control cells, ascorbate enhanced tunicamycin‐stimulated increases in phosphatase activity. Phosphatase activity was lower in Nox4‐overexpressing than control cells but was normalized by ascorbate to the same level as in control cells. In Nox4 knockdown cells, tunicamycin‐induced increases in phosphatase activity were enhanced and ascorbate had minimal additional effect.
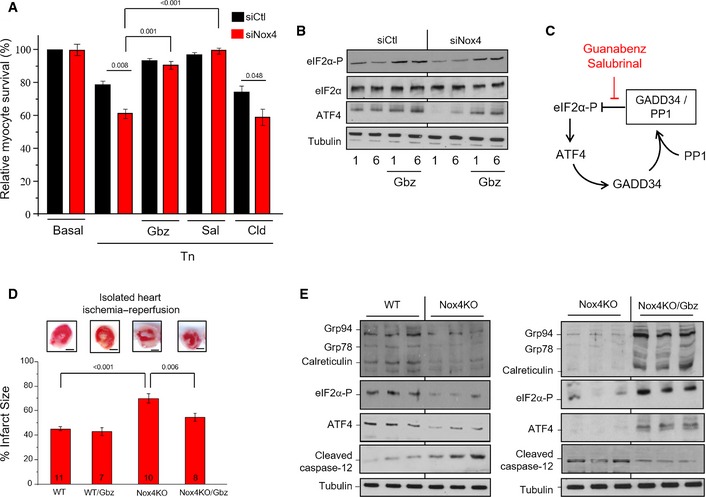
H9c2 cells treated with tunicamycin (2 μg/ml, 12 h) showed significantly lower survival when endogenous Nox4 was silenced (siNox4) as compared to cells treated with a scrambled si
RNA (siCtl). Cell survival was restored by treatment with either guanabenz (Gbz, 5 μM) or salubrinal (Sal, 50 μM) but was unaffected by clonidine (Cld, 5 μM). n = 3/group.Nox4‐depleted cells had lower levels of phospho‐
eIF 2α andATF 4 than control cells, but these were restored in the presence of guanabenz (Gbz).Schematic representation of the effect of the small molecule inhibitors, guanabenz and salubrinal, on the
GADD 34/PP 1/eIF 2α interaction.Hearts from Nox4 knockout (
KO ) mice andWT controls were subjected to global ischemia followed by aerobic reperfusion (I/R). Infarct size assessed by triphenyltetrazolium chloride (TTC ) staining was greater in Nox4KO hearts compared toWT and was significantly reduced by guanabenz (Gbz). In the representative heart sections shown at the top, white denotes infarct area and red the viable area. Scale bars, 1 mm. Numbers of hearts are indicated within the bars.Immunoblotting of heart homogenates after I/R showed lower levels of phospho‐
eIF 2α,ATF 4, andER chaperones, and higher levels of cleaved caspase‐12, in Nox4KO compared toWT . Tubulin was used as a loading control. Treatment with guanabenz (Gbz) reversed these changes (blots shown to the right).

Plasma urea levels were elevated to a greater extent in tunicamycin‐treated Nox4
KO mice thanWT . Co‐treatment with guanabenz (Gbz) reduced urea levels in both groups. Numbers of animals are indicated within bars.Forty‐eight hours after systemic tunicamycin treatment, kidneys of Nox4
KO mice showed a marked surface pallor (bottom right).TUNEL staining revealed a significantly higher number of apoptotic cells in tunicamycin‐treated Nox4KO mice. n = 4/group.Immunoblotting of kidney homogenates showed significantly elevated cleaved caspase‐12 and cleaved
PARP levels in tunicamycin‐treated Nox4KO mice compared toWT .Survival curves showed that a very high proportion of Nox4
KO mice died afterAKI . Guanabenz (Gbz) treatment dramatically improved survival in tunicamycin‐treatedKO mice. Number of animals as indicated. Levels of significance by Kaplan–Meier analysis are reported to the right.Schematic depicting the effect of Nox4‐generated
ROS onPP 1 activity and the balance betweeneIF 2α phosphorylation and dephosphorylation. Nox4 is upregulated byATF 4 and binds toGADD 34. It inhibitsGADD 34‐boundPP 1 through the local generation of H2O2 and oxidation of the metal (M) center of the serine–threonine phosphatase. The consequent prolongation ofeIF 2α phosphorylation promotes cell survival in the face of acute protein unfolding stress. M = iron or manganese, which are oxidized from the M (II ) to the M (III ) species.
Similar articles
-
Regulation of de novo translation of host cells by manipulation of PERK/PKR and GADD34-PP1 activity during Newcastle disease virus infection.J Gen Virol. 2016 Apr;97(4):867-879. doi: 10.1099/jgv.0.000426. Epub 2016 Feb 11. J Gen Virol. 2016. PMID: 26869028
-
Structural and Functional Analysis of the GADD34:PP1 eIF2α Phosphatase.Cell Rep. 2015 Jun 30;11(12):1885-91. doi: 10.1016/j.celrep.2015.05.043. Epub 2015 Jun 18. Cell Rep. 2015. PMID: 26095357 Free PMC article.
-
An eIF2α-binding motif in protein phosphatase 1 subunit GADD34 and its viral orthologs is required to promote dephosphorylation of eIF2α.Proc Natl Acad Sci U S A. 2015 Jul 7;112(27):E3466-75. doi: 10.1073/pnas.1501557112. Epub 2015 Jun 22. Proc Natl Acad Sci U S A. 2015. PMID: 26100893 Free PMC article.
-
An Overview of Methods for Detecting eIF2α Phosphorylation and the Integrated Stress Response.Methods Mol Biol. 2022;2428:3-18. doi: 10.1007/978-1-0716-1975-9_1. Methods Mol Biol. 2022. PMID: 35171470 Review.
-
The PPP1R15 Family of eIF2-alpha Phosphatase Targeting Subunits (GADD34 and CReP).Int J Mol Sci. 2023 Dec 10;24(24):17321. doi: 10.3390/ijms242417321. Int J Mol Sci. 2023. PMID: 38139150 Free PMC article. Review.
Cited by
-
The regulation of cardiac intermediary metabolism by NADPH oxidases.Cardiovasc Res. 2023 Jan 18;118(17):3305-3319. doi: 10.1093/cvr/cvac030. Cardiovasc Res. 2023. PMID: 35325070 Free PMC article. Review.
-
Hydrogen peroxide as a central redox signaling molecule in physiological oxidative stress: Oxidative eustress.Redox Biol. 2017 Apr;11:613-619. doi: 10.1016/j.redox.2016.12.035. Epub 2017 Jan 5. Redox Biol. 2017. PMID: 28110218 Free PMC article. Review.
-
Cellular and molecular roles of reactive oxygen species in wound healing.Commun Biol. 2024 Nov 19;7(1):1534. doi: 10.1038/s42003-024-07219-w. Commun Biol. 2024. PMID: 39562800 Free PMC article. Review.
-
Mammalian integrated stress responses in stressed organelles and their functions.Acta Pharmacol Sin. 2024 Jun;45(6):1095-1114. doi: 10.1038/s41401-023-01225-0. Epub 2024 Jan 24. Acta Pharmacol Sin. 2024. PMID: 38267546 Review.
-
The reduced activity of PP-1α under redox stress condition is a consequence of GSH-mediated transient disulfide formation.Sci Rep. 2018 Dec 7;8(1):17711. doi: 10.1038/s41598-018-36267-6. Sci Rep. 2018. PMID: 30531830 Free PMC article.
References
-
- Alessi DR, Street AJ, Cohen P, Cohen PT (1993) Inhibitor‐2 functions like a chaperone to fold three expressed isoforms of mammalian protein phosphatase‐1 into a conformation with the specificity and regulatory properties of the native enzyme. Eur J Biochem 213: 1055–1066 - PubMed
-
- Anilkumar N, Weber R, Zhang M, Brewer A, Shah AM (2008) Nox4 and Nox2 NADPH oxidases mediate distinct cellular redox signaling responses to agonist stimulation. Arterioscler Thromb Vasc Biol 28: 1347–1354 - PubMed
-
- Barford D, Keller JC (1994) Co‐crystallization of the catalytic subunit of the serine/threonine specific protein phosphatase 1 from human in complex with microcystin LR. J Mol Biol 235: 763–766 - PubMed
-
- Bedard K, Krause KH (2007) The NOX family of ROS‐generating NADPH oxidases: physiology and pathophysiology. Physiol Rev 87: 245–313 - PubMed
Publication types
MeSH terms
Substances
Grants and funding
LinkOut - more resources
Full Text Sources
Other Literature Sources
Molecular Biology Databases
Research Materials
