. 2015 Dec 21:6:1432.
doi: 10.3389/fmicb.2015.01432. eCollection 2015.

Modulation of Biofilm Exopolysaccharides by the Streptococcus mutans vicX Gene

Affiliations

Modulation of Biofilm Exopolysaccharides by the Streptococcus mutans vicX Gene

Lei Lei et al. Front Microbiol. .

Abstract

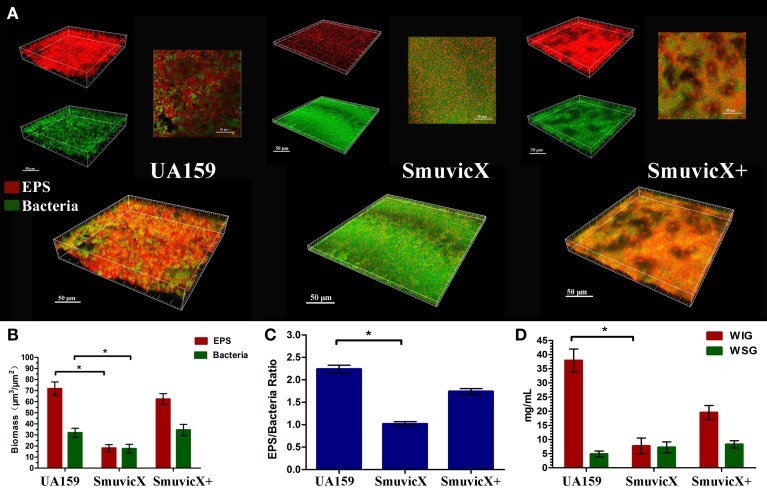
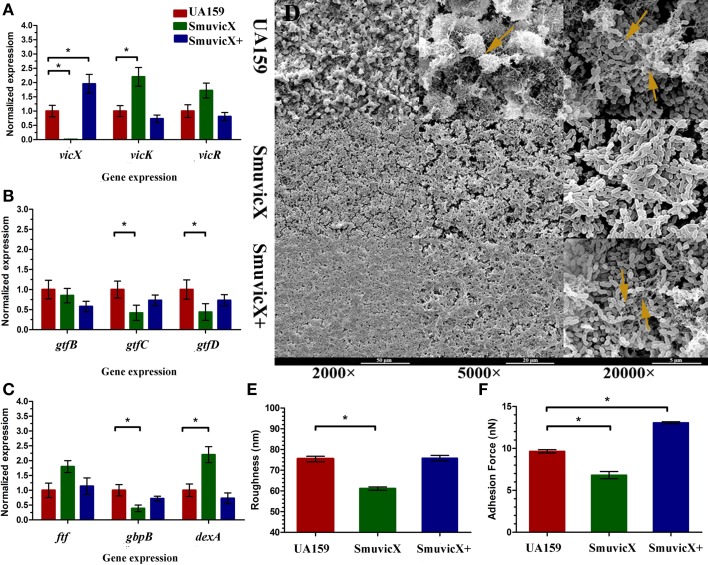
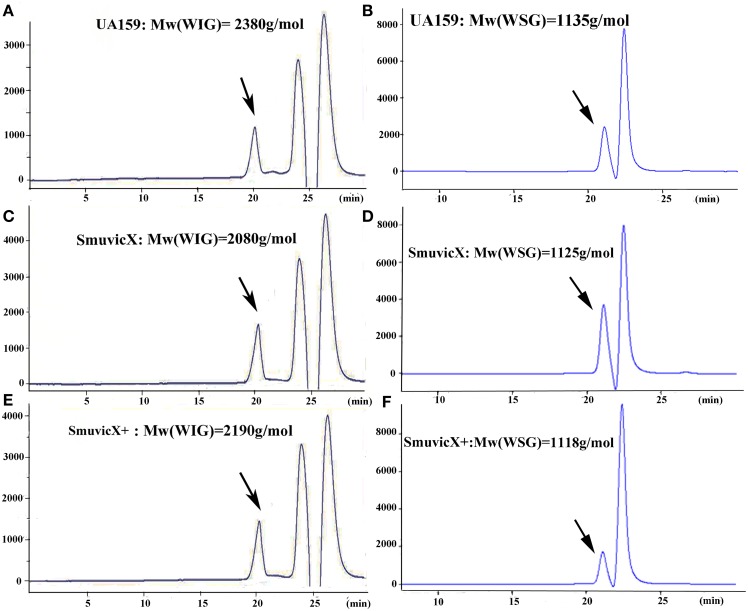
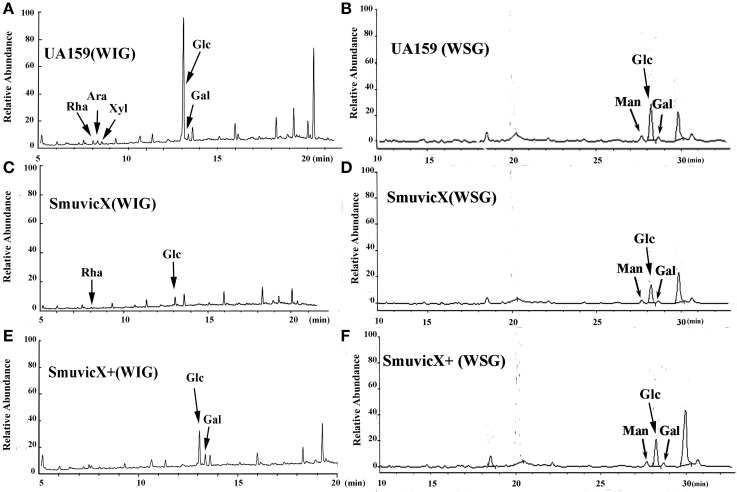
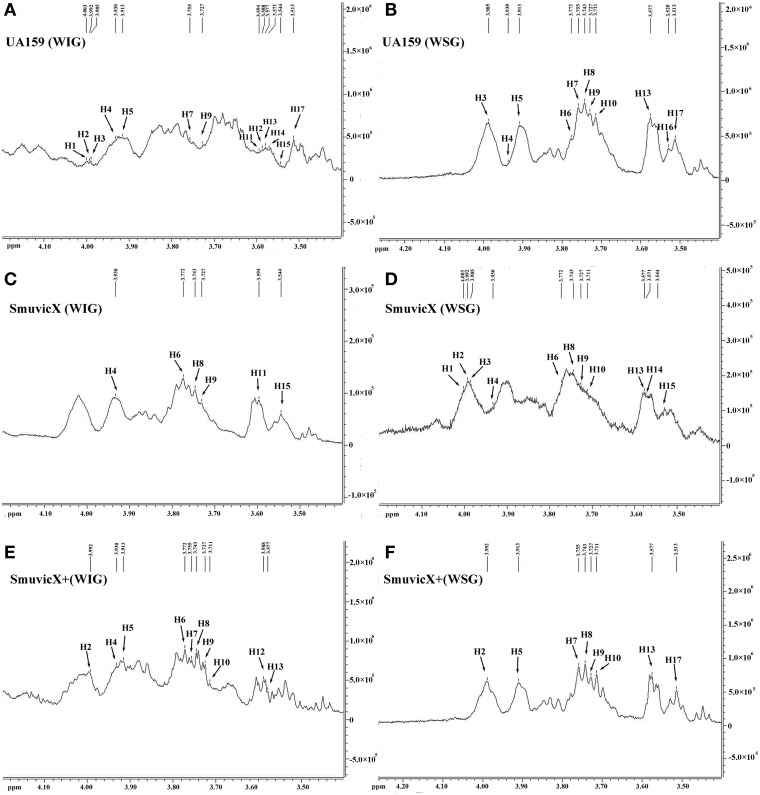
The cariogenic pathogen Streptococcus mutans effectively utilizes dietary sucrose for the synthesis of exopolysaccharide, which act as a scaffold for its biofilm, thus contributing to its pathogenicity, environmental stress tolerance, and antimicrobial resistance. The two-component system VicRK of S. mutans regulates a group of virulence genes that are associated with biofilm matrix synthesis. Knockout of vicX affects biofilm formation, oxidative stress tolerance, and transformation of S. mutans. However, little is known regarding the vicX-modulated structural characteristics of the exopolysaccharides underlying the biofilm formation and the phenotypes of the vicX mutants. Here, we identified the role of vicX in the structural characteristics of the exopolysaccharide matrix and biofilm physiology. The vicX mutant (SmuvicX) biofilms seemingly exhibited "desertification" with architecturally impaired exopolysaccharide-enmeshed cell clusters, compared with the UA159 strain (S. mutans wild type strain). Concomitantly, SmuvicX showed a decrease in water-insoluble glucan (WIG) synthesis and in WIG/water-soluble glucan (WSG) ratio. Gel permeation chromatography (GPC) showed that the WIG isolated from the SmuvicX biofilms had a much lower molecular weight compared with the UA159 strain indicating differences in polysaccharide chain lengths. A monosaccharide composition analysis demonstrated the importance of the vicX gene in the glucose metabolism. We performed metabolite profiling via (1)H nuclear magnetic resonance spectroscopy, which showed that several chemical shifts were absent in both WSG and WIG of SmuvicX biofilms compared with the UA159 strain. Thus, the modulation of structural characteristics of exopolysaccharide by vicX provides new insights into the interaction between the exopolysaccharide structure, gene functions, and cariogenicity. Our results suggest that vicX gene modulates the structural characteristics of exopolysaccharide associated with cariogenicity, which may be explored as a potential target that contributes to dental caries management. Furthermore, the methods used to purify the EPS of S. mutans biofilms and to analyze multiple aspects of its structure (GPC, gas chromatography-mass spectrometry, and (1)H nuclear magnetic resonance spectroscopy) may be useful approaches to determine the roles of other virulence genes for dental caries prevention.

Keywords: Streptococcus mutans; biofilms; caries prevention; glucosyltransferase; polysaccharides; two component VicRK system.


Figures

Figure 1
Figure 1
Laser confocal microscopy of the exopolysaccharide matrix in the biofilm architecture and glucan quantification. (A) Double labeling of the biofilms in the three types of strains. Images were taken at 63× magnification. Green, total bacteria (SYTO 9); red, exopolysaccharide (EPS; Alexa Fluor 647); scale bars, 50 μm. The three-dimensional reconstruction of the biofilms was performed using Imaris 7.0.0. (B) Quantitative data of bacterial and exopolysaccharide (EPS) biomass in the three types of strains. Results were averaged from 10 independent cultures of different strains (UA159, SmuvicX, SmuvicX+) and experiments were performed in triplicate. The data are presented as mean ± standard errors. Shapiro–Wilk tests and Bartlett's tests showed that the data were parametric. One-way ANOVA were used to detect the significant effects of variables, *P < 0.05. (C) Volume ratio of the exopolysaccharide (EPS) matrix to the bacterial biomass in the biofilms of the three types of strains. The SmuvicX strains exhibited the lowest EPS/bacteria ratio, whereas the UA159 strain had the highest ratio. Results were averaged from 10 independent cultures of different strains (UA159, SmuvicX, SmuvicX+) and the data are presented as mean ± standard errors, *P < 0.05. (D) Water-insoluble glucan (WIG) and water-soluble glucan (WSG) of samples from different strains, as measured using the anthrone method. WIG synthesis in the three types of strains was calculated; the UA159 strain exhibited the highest amount of WIG (37.9 ± 4.1), whereas the SmuvicX strains exhibited the lowest amount of WIG (7.7 ± 2.8). Results were averaged from 10 independent cultures of different strains (UA159, SmuvicX, SmuvicX+) and experiments were performed in triplicate. The data are presented as mean ± standard errors. Shapiro–Wilk tests and Bartlett's tests showed that the data were nonparametric. Significant differences were determined using the Kruskal–Wallis test and least significant difference (LSD) multiple comparisons method, *P < 0.05.
Figure 2
Figure 2
Dynamics of the expression of exopolysaccharide-associated genes and phenotypic characteristics of S. mutans. (A) Differences in vicR/K/X expression in interaction with the vicRK transduction system among three types of strains. (B) Differences between gtfB/C/D expressions in exopolysaccharide synthesis of three types of strains. (C) Differences in ftf, gbpB, and dexA expression in exopolysaccharide synthetic catalysis and degradation among three types of strains. S. mutans gene expression was relatively quantified by real-time PCR using gyrA as an internal control and calculated based on the UA159 expression, which was set as 1.0. Results were averaged from 10 independent cultures of different strains (UA159, SmuvicX, SmuvicX+) and experiments were performed in triplicate. The data are presented as mean ± standard deviations. Shapiro–Wilk tests and Bartlett's tests showed that the data were nonparametric. The Kruskal–Wallis test and least significant difference (LSD) multiple comparisons method were used to compare the effects of variables. Asterisks indicate the significant differences among the expressions of genes were considered differentially at a minimal ratio of two-fold changes. (D) Scanning electron microscopy (SEM) observation of the architecture of S. mutans biofilms. Images were taken at 2000×, 5000×, and 20,000× magnifications, respectively. Clusters of bacterial cells surrounded by enriched exopolysaccharide matrix in the biofilm of the UA159 and SmuvicX+ strains (yellow arrows). The SmuvicX strain seemed to be devoid of exopolysaccharide matrix in the biofilms. Representative images are shown from three randomly selected areas from each sample. (E) The means of surface roughness average (Ra) of S. mutans biofilms obtained from atomic force microscopy (AFM) experiments were calculated. The values obtained for SmuvicX (61.11 ± 2.55) were lower than those obtained for the UA159 (75.4 ± 4.23) and SmuvicX+ (75.81 ± 4.1) strains. Results were averaged from 10 independent cultures of different strains (UA159, SmuvicX, SmuvicX+) and experiments were performed in triplicate. The data are presented as mean ± standard errors. Shapiro–Wilk tests and Bartlett's tests showed that the data were parametric. One-way ANOVA were used to detect the significant effects of variables, *P < 0.05. (F) The values of adhesion force data were obtained from AFM. The SmuvicX+ strain showed the highest average force (13.1 ± 0.64), whereas the SmuvicX strain exhibited the lowest force of adhesion (6.8 ± 2.3); Results were averaged from 10 independent cultures of different strains (UA159, SmuvicX, SmuvicX+) and experiments were performed in triplicate. The data are presented as mean ± standard errors. Shapiro–Wilk tests and Bartlett's tests showed that the data were nonparametric. Significant differences were determined using the Kruskal–Wallis test and LSD multiple comparisons method, *P < 0.05.
Figure 3
Figure 3
The molecular weight distribution of the polysaccharides was estimated using high-performance gel permeation chromatography (GPC). The GPC analysis demonstrated that each peak from different S. mutans strains corresponded to an average molecular weight of 2.38 × 10³ g/mol for the water-insoluble glucan (WIG) of the UA159 strain (retention time: 20.12 min; A); a molecular weight of 1.14 × 10³ g/mol for the water-soluble glucan (WSG) of the UA159 strain (retention time: 20.98 min; B); a molecular weight of 2.08 × 10³ g/mol for the WIG of the SmuvicX strain (retention time: 20.27 min; C); a molecular weight of 1.13 × 10³ g/mol for the WSG of the SmuvicX strain (retention time: 21.0 min; D); a molecular weight of 2.19 × 10³ g/mol for the WIG of the SmuvicX+ strain (retention time: 20.21 min; E); and a molecular weight of 1.12 × 10³ g/mol for the WSG of the SmuvicX+ strain (retention time: 21.01 min; F). Each exopolysaccharide sample was technically replicated three times. The data represent the average molecular weight for the entire polymer distribution.
Figure 4
Figure 4
A monosaccharide composition analysis of the polysaccharide was carried out using a preparation that was precipitated by acetylation. The GC/MS profile of the monosaccharide composition analysis showed that the water-insoluble glucan (WIG) of the UA159 strain consisted of rhamnose (Rha, retention time: 8.030 min), arabinose (Ara, retention time: 8.273 min), xylose (Xyl, retention time: 8.513 min), glucose (Glc, retention time: 13.061 min), and galactose (Gal, retention time: 13.351 min) with a molar ratio of 1.74:2.4:1.0:58.31:4.19 (A); the water-soluble glucan (WSG) of the UA159 strain contained Man (retention time: 27.690 min), Glc (retention time: 28.225 min), and Gal (retention time: 28.694 min) with a molar ratio of 12.1:70.47:7.27 (B); the WIG of the SmuvicX strain contained Rha (retention time: 8.033 min)and Glc (retention time: 13.069 min) with a molar ratio of 1:13 (C); the WSG of the SmuvicX strain consisted of Man (retention time: 27.690 min), Glc (retention time: 28.223 min), and Gal (retention time: 28.694 min) with a molar ratio of 14.14:53.56:6.24 (D); the WIG of the SmuvicX+ strain contained Glc (retention time: 13.060 min) and Gal (retention time: 13.352 min) with a molar ratio of 2.19:1.0 (E); and the monosaccharide components of the WSG of the SmuvicX+ strain included Man (retention time: 27.690 min), Glc (retention time: 28.238 min), and Gal (retention time: 28.694 min) with a molar ratio of 19.11:95.85:17.75 (F). Each exopolysaccharide sample was technically replicated three times. The data represent the average molar ratio of each monosaccharide.
Figure 5
Figure 5
The structural properties of the glucan of S. mutans biofilms were further elucidated using 600 MHz 1H nuclear magnetic resonance (NMR) spectroscopy. Several sharp well-resolved peaks corresponding to the dextran standard metabolites could be observed in each of the strains. The 1H NMR spectrum of the water-insoluble glucan (WIG) of the UA159 strain consisted mostly of signals at 4.003, 3.992, 3.985, 3.9301, 3.913, 3.755, 3.727, 3.594, 3.588, 3.577, 3.571, 3.544, and 3.513 ppm (A); the 1H NMR spectrum of the water-soluble glucan (WSG) of the UA159 strain consisted mostly of signals at 3.985, 3.9301, 3.913, 3.772, 3.755, 3.743, 3.727, 3.711, 3.577, 3.528, and 3.513 ppm (B); the 1H NMR spectrum of the WIG of the SmuvicX strain consisted of lesser signals at 3.930, 3.772, 3.743, 3.727, 3.594, and 3.544 ppm (C); the 1H NMR spectrum of the WSG of the SmuvicX strain consisted of signals at 4.003, 3.992, 3.985, 3.930, 3.772, 3.743, 3.727, 3.711, 3.577, 3.571, and 3.544 ppm (D); the 1H NMR spectrum of the WIG of the SmuvicX+ strain consisted of signals at 3.992, 3.930, 3.913, 3.772, 3.755, 3.743, 3.727, 3.711, 3.588, and 3.577 ppm (E); and the 1H NMR spectrum of the WSG of the SmuvicX+ strain consisted of signals at 3.992, 3.913, 3.755, 3.743, 3.727, 3.711, 3.571, and 3.544 ppm (F).

Similar articles

Cited by

References

    1. Arirachakaran P., Benjavongkulchai E., Luengpailin S., Ajdić D., Banas J. A. (2007). Manganese affects Streptococcus mutans virulence gene expression. Caries Res. 41, 503–511. 10.1159/000110883 - DOI - PMC - PubMed
    1. Bales P. M., Renke E. M., May S. L., Shen Y., Nelson D. C. (2013). Purification and characterization of biofilm-associated EPS exopolysaccharides from ESKAPE organisms and other pathogens. PLoS ONE 8:e67950. 10.1371/journal.pone.0067950 - DOI - PMC - PubMed
    1. Bester E., Kroukamp O., Wolfaardt G. M., Boonzaaier L., Liss S. N. (2010). Metabolic differentiation in biofilms as indicated by carbon dioxide production rates. Appl. Environ. Microbiol. 76, 1189–1197. 10.1128/AEM.01719-09 - DOI - PMC - PubMed
    1. Biswas S., Biswas I. (2006). Regulation of the glucosyltransferase (gtfBC) operon by CovR in Streptococcus mutans. J. Bacteriol. 188, 988–998. 10.1128/JB.188.3.988-998.2006 - DOI - PMC - PubMed
    1. Bitoun J. P., Nguyen A. H., Fan Y., Burne R. A., Wen Z. T. (2011). Transcriptional repressor Rex is involved in regulation of oxidative stress response and biofilm formation by Streptococcus mutans. FEMS Microbiol. Lett. 320, 110–117. 10.1111/j.1574-6968.2011.02293.x - DOI - PMC - PubMed

LinkOut - more resources